


 nueva página del texto (beta)
 Inglés (pdf)
 Artículo en XML
 Referencias del artículo
 Enviar artículo por email
 Citado por SciELO
  Similares en
SciELO
Similares en
SciELO 
 Permalink
Introduction
In hair sheep breeds, dissection of some carcass cuts could be used as a predictor of overall carcass tissue composition (Escalante-Clemente et al. 2022). This technique is increasingly used due to its low cost. This technique has recently been used to determine the body chemical composition of hair sheep (Sousa et al. 2020) and carcass characteristics of Black Belly sheep (Escalante-Clemente et al. 2022).
On the other hand, image processing technologies have developed rapidly and can be reliably used to quantitatively characterize the size, shape, and density of organisms or objects. Similarly, these image analysis techniques have been used extensively in animal science for predicting body composition, carcass grading, and assessing meat quality traits. The use of these non-invasive and non-destructive techniques, which avoid carcass dissection (destruction or tearing into pieces) or chemical analysis, has become increasingly interesting for the meat industry (Olsen et al. 2017, Kucha et al. 2018). Similarly, meat quality studies have focused on the relationships between the amount of intramuscular fat and tenderness, juiciness, flavour, and palatability, as these parameters have been highlighted as essential for consumer acceptability (Font-i-Furnols et al. 2012).
ImageJ software is a useful tool for agricultural and animal science. Recent applications have been used to compare ultrasound images of reproductive and productive structures (ovaries, muscle depth and width) in livestock (Brito et al. 2022, Pimentel et al. 2023). Recently, ImageJ software has been demonstrated as a potential tool for the in vivo measurement of longissimus thoracis muscle parameters and fat thickness in hair sheep (Ramos-Ramos et al. 2024). Therefore, the use of digital image analysis to predict some of the cut or carcass characteristics of this type of sheep has not been reported in hair sheep breeds. Therefore, this study aims to evaluate the relationship between tissue composition of rib sections 9th-11th and digital image analysis measurements in hair sheep.
Materials and methods
The study was carried out in the meat workshop of the Department of Agricultural Sciences of the Universidad Juárez Autónoma de Tabasco, located at km 25 of the Villahermosa-Teapa highway, Ranchería, la Huasteca, Villahermosa, Tabasco. Twenty Black Belly lambs (6 months old) obtained from the Centro de Integración Ovina del Sureste (CIOS) were used. The animals were housed in raised floor cages and fed in groups of 20 animals. The animals were previously fed a diet consisting of 66% forage and 34% concentrate.
Slaughter of animals
Animals were slaughtered after a 24-hour fasting period according to the official Mexican norms (NOM-008-ZOO-1994, NOM-EM-09-ZOO-1994, and NOM-033-ZOO-1995). These are based on the Technical Specifications for the Production, Care and Use of Laboratory Animals; NOM-051-ZOO-1995, Humane Treatment in the Movement of Animals; and NOM-033-SAG / ZOO 2014, Humane Slaughter of Domestic and Wild Animals. Before slaughter, the body weight (BW) of the animals was recorded. The carcasses were then weighed (hot carcass weight, HCW) and placed in a refrigerator at 1°C for 24 hours. The carcasses were then reweighed (cold carcass weight, CCW) and divided into two halves along the dorsal midline. The intercostal space between the 9th and 11th ribs (out of a total of 13 pairs of ribs) was dissected as described by Sousa et al. (2020) and Escalante-Clemente et al. (2022). This section was photographed and then weighed and dissected into fat, muscle, and bone.
Digital image analysis measurements of the 9th-11th rib section
Images were taken using a smartphone with a front-facing camera. The camera, built into an iPhone 12 mobile phone (Apple Inc., Cupertino, California, United States), has a focal length of 26 mm, an aperture of f/2.4, and 12 megapixels. The mobile phone was mounted on a stand, which allowed it to move in a vertical direction and to remain stable. The camera was set to standard quality, and photographs were taken 24 hours after slaughter. The distance between the camera and the 9th-11th rib section was 35 cm. Each sample was photographed over a blank area, and a ruler (15 cm) was placed over the meat cut to obtain the pixel: cm ratio for sequential image analysis as described by Chay-Canul et al. (2023). The images were stored on a USB flash card and then transferred to a PC. Five photographs were taken from each 9th-11th rib section. The best images were selected using the criteria that the 9th-11th rib section should be within the defined rectangular area and that the image should have a good resolution (clear and stable) as described by Chay-Canul et al. (2023). The images were processed using ImageJ software release 1.54g. The measurements recorded on the digital images are described in Figure 1. The digital measurements were carried out in several steps. The first step was to set the scale pixel/cm by converting pixels to cm units using the ruler present in the photographic image, then the straight-line tool was used to calculate the total rib length (Figure 1a, cm), width and depth of the longissimus thoracis (Figure 1b, cm). For total rib area (Figure 1c, cm2) the polygon selection tool was used. For the LT area (Figure 1d, cm2), images were extracted from the background and the threshold was adjusted to highlight using a standard thresholding technique. The coloured image shows the rib muscle area.
Statistical analysis
To determine the degree of association between the variables obtained for each experimental unit (animal), a correlation matrix was used, using the Pearson coefficient as a measure of the association. The result, including the value of the coefficient and its level of significance, were presented graphically in a correlogram. The R programming environment (R Core Team 2024), version 4.0.0, was used for all calculations and graphs.
Results and discussion
Table 1 summarizes the mean, standard deviation, minimum, and maximum values for the tissue composition of 9th-11th ribs section and the digital images measurements. The photographic measurements ranged from 13.63 to 18.71 cm for length, 6.12 to 7.64 cm for width, and 2.47 to 3.54 cm for depth. Ra and LTa were found to have a coefficient of variation (CV, %) of about 15.83%. Whereas the rib tissue composition weights showed a CV that varied from 55 to 70%.
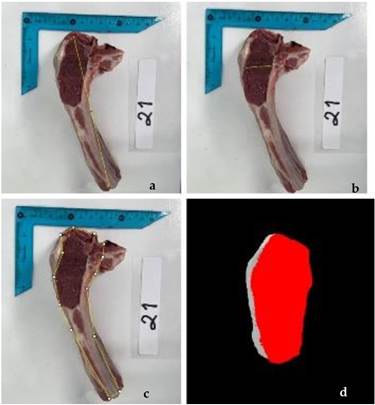
Table 1 Descriptive statistics from all evaluated variables
| Variable | Description | Mean | SD | Minimum | Maximum |
|---|---|---|---|---|---|
| Rl | Rib length (cm) | 16.24 | 1.40 | 13.63 | 18.71 |
| Ra | Rib area (cm2) | 36.81 | 7.33 | 26.47 | 48.10 |
| LTw | Longissimus thoracis width (cm) | 6.95 | 0.43 | 6.12 | 7.64 |
| LTd | Longissimus thoracis depth (cm) | 3.07 | 0.34 | 2.47 | 3.54 |
| LTa | Longissimus thoracis area (cm2) | 18.78 | 3.10 | 13.64 | 23.67 |
| Rw | Rib weight (g) | 201.55 | 33.02 | 155.00 | 260.00 |
| Rm | Rib muscle (g) | 98.25 | 18.94 | 65.00 | 135.00 |
| Rb | Rib bone (g) | 63.25 | 11.27 | 45.00 | 95.00 |
| Rf | Rib fat (g) | 35.50 | 17.24 | 15.00 | 70.00 |
As demonstrated in Figure 2, a high correlation was observed between ImageJ measurements and the characteristics of the 9th-11th rib sections (P < 0.01). RI had a strong correlation with Rw (r = 0.84) and a moderate correlation with Rm, Rf and Rb (0.54 ≤ r ≤ 0.68, P < 0.05). In addition, LTa, Rw, and Rm exhibited r values of 0.71 and 0.79, respectively (P < 0.05). Conversely, LTw demonstrated no substantial correlation with the characteristics of the 9th-11th rib section.
This work aims to and determine the feasibility of using mobile phones via camera to evaluate some characteristics of the 9th-11th rib section of sheep using digital image analysis. The 9th-11th rib section has previously been evaluated as a good predictor of carcass tissue composition in hair sheep breeds (Escalante-Clemente et al. 2022). The approach based on image analysis of carcass cuts and joints and their relationship to tissue composition may be a cost-effective indirect method to estimate the amount and distribution of tissue in the carcass of animals for human consumption. However, to the best of our knowledge, no study has been carried out to correlate measurements of the 9th-11th rib sections obtained from open-source ImageJ software with their tissue composition in hair sheep.
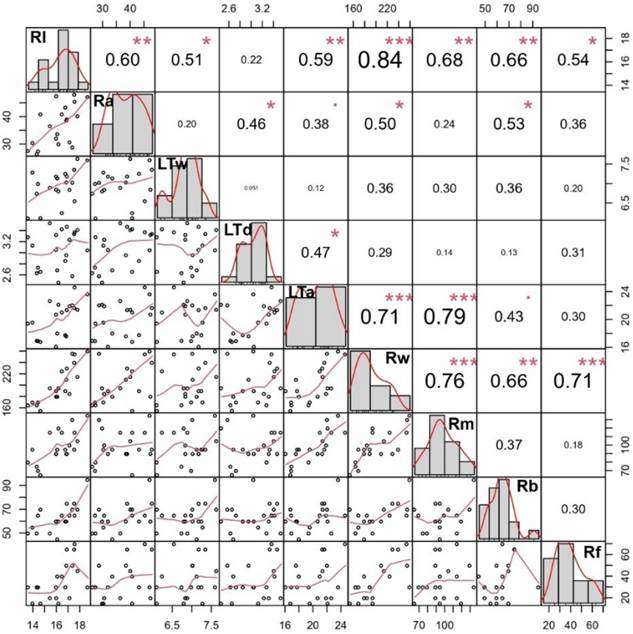
Figure 2 Correlogram of the biometric variables evaluated in the study. Included are the histogram and density curve on the diagonal, the test statistic and significance level on the horizontal, and the scatter plot below.
A fundamental process in determining the quality and value of the animal at slaughter is the evaluation of carcass characteristics (Silva et al. 2021). In recent years, work has been undertaken to introduce consistency, accuracy, credibility, and confidence into carcass value assessment by classifying carcass quality based on non-destructive image analysis techniques (Silva et al. 2021). Although computed tomography and dual-energy X-ray absorptiometry (DXA) have shown great ability to predict carcass and body composition in farm animals, their use is limited by the high cost and complexity of application (Tiera et al. 2003; Silva et al. 2021). On the other hand, the potential of the use of imaging, a low-cost method of carcass trait prediction, has not been widely explored, particularly for lamb carcass evaluation (Silva et al. 2021).
Digital image analysis (DIA), focuses on segmenting, extracting, and measuring the objects of interest in an image to obtain their objective information and thus describe the image in terms of data (Xu et al. 2024). In meat science, DIA has been identified as an efficient method for evaluating beef carcass yield, determining colour and fat thickness, water holding capacity in beef, and commercial quality grade determined by marbling level, which is a measure of the density of fat distribution in the rib eye region (Tiera et al. 2023; Giaretta et al. 2018). In recent decades, image processing techniques have advanced significantly due to their ability to characterize physical properties such as size, shape, colour, and texture in digital images. Image processing techniques in the food industry Image processing techniques in the food industry have been in use for a long time and have been applied as a method of non-destructive quality assessment in various food products (Du and Sun, 2004).
Tiera et al. (2003) to predict the weight and yield of whole and individual pistol cuts through regression equations using variables obtained through image analysis of the 12th rib steak of cattle. They used the total rib steak area (TRSA, cm2), rib eye area (REA, cm2), rib eye area percentage (REA%), fat thickness (FT, mm), fat area (FA, cm2), and fat area percentage (FA%) obtained through image analysis. They concluded that the inclusion of DIA parameters results in obtaining the most appropriate models, with r2 values that ranged from 0.84 to 0.87.
Tiera et al. (2003) concluded that there are a few studies that have reported the use of image analysis of steaks removed from the 12th rib to predict the weight and yield of subprime cuts (Shackelford et al. 1998). In this sense, Shackelford et al. (1998), using the 12th and 13th ribs in cattle, found that the single image analysis variable that accounted for the greatest proportion of variation in retail product yield was the percentage lean (r2 = 0.77). While the single image analysis variable that accounted for the greatest proportion of variation in steak longissimus area was a total lean area (r2 = 0.85). They concluded that image analysis could therefore be used by the beef industry to more accurately predict individual sub primal weights. In turn, this information and appropriate price premiums could be used to more accurately estimate carcass value. Cross et al. (1983) used the Image analysis to predict the composition of the 9-10-11 rib section of 44 carcasses of bulls and steers. The total fat area (cm2 or percent) as measured by the DIA was highly correlated with the percent lean and the percent fat in the 9-10-11 rib section. The total fat area was also correlated with carcass traits such as actual fat thickness (r = 0.86) and rib eye area (r = -0.33) as determined by DIA. These prediction equations, developed on 9-10-11 rib sections, are only intended to show the potential of DIA.
Significant correlations were observed between the measurements of ImageJ and the characteristics of the 9th-11th rib section. A stronger correlation (r = 0.84) was found between Rl and Rw. Similarly, LTa and Rw and Rm had r = 0.71 and 0.79, respectively. The study results indicate that the measurement of the 9th-11th rib sections using an image analysis method could be used to predict their tissues. The technique has the potential to serve as a viable indirect method for determining the amount and distribution of carcass tissues in farm animals. This study showed that using image-processing techniques can help farmers and researchers get reliable data to make decisions about research and industry. It also shows how we can use image-processing methods to quickly and accurately examine the quality of animal products.

