


 nueva página del texto (beta)
 Inglés (pdf)
 Artículo en XML
 Referencias del artículo
 Enviar artículo por email
 Citado por SciELO
  Similares en
SciELO
Similares en
SciELO 
 Permalink
Metabolomics is a powerful tool for plant breeding by linking metabolic traits to agronomic performance (Fernandez et al. 2016). This is particularly relevant for coffee (Coffea spp. L.), a globally important crop with limited genetic diversity. Most Coffea arabica lines derive from a few Typica and Bourbon founder plants and, due to high autogamy, plantations exhibit low genetic diversity and therefore are highly vulnerable to drought, diseases, and pests (Meyer 1965, Anthony et al. 2002).
In Mexico, coffee remains primarily produced in traditional agroforestry systems that preserve a fair share of the native biodiversity and provide crucial socioeconomic support for ancestral communities -including many Indigenous smallholders- making crop sustainability a priority for both conservation and livelihoods (Hernández-Martínez et al. 2019).
Breeding efforts have sought to broaden C. arabica resistance by introgressing genes from C. canephora, notably via the natural Timor hybrid (HDT, by its original Portuguese name) and artificial Arabusta hybrids (de Oliveira 2017, Cheserek et al. 2020). These hybrids improved resistance to coffee leaf rust (CLR), coffee berry disease (CBD), and nematodes (Lashermes 2002, Maldonado & Ángel-Giraldo 2020). Still, monogenic resistance can be overcome by pathogens (Eskes et al. 1990), and other threats -such as the coffee berry borer (CBB, Hypothenemus hampei)- remain insuf ficiently addressed even from fundamental knowledge such as the susceptibility of different hybrids (Guerreiro Filho & Mazzafera 2003, Oliva et al. 2023). Most coffee metabolomic research has concentrated on processed beans, specifically on sensory attributes, compounds associated with ripeness, origin, cup quality, species, and variety (Bertrand et al. 2008, Wei et al. 2012, Bicho et al. 2013, Setoyama et al. 2013, Kwon et al. 2015, Marie et al. 2024) -while agronomically focused studies are fewer (Subroto et al. 2019, Chekol et al. 2024).
Processing (fermentation, drying, roasting) substantially alters bean chemistry and therefore introduces variance desirable for marketing coffee beans and coffee in the cup but not relevant when the objective is to detect intrinsic, genotype-driven metabolites linked to agronomic traits (Koskei et al. 2020, Therdtatha et al. 2023, Bollen et al. 2025).
Agronomic metabolomic work on coffee leaves has revealed drought-associated accumulation of amino acids, sugars, and organic acids (Chekol et al. 2024) and relationships between flavonoid levels and rust severity (Subroto et al. 2019), but metabolic markers tied to bean targeting pests, such as CBB, remain underexplored. A few studies have examined berry volatiles or genotype antibiosis (Guerreiro Filho & Mazzafera 2003, Cruz et al. 2016, Molina 2022), yet specific metabolites that could be used as breeding targets for antibiosis or other bean-relevant resistance traits have not been identified.
Here, we profile the untreated endosperm (raw beans) of commercial Coffea genotypes grown in Central Veracruz state, Mexico, to (1) assess whether cultivars can be discriminated by their intrinsic chemical composition and (2) identify candidate chemical fingerprints potentially linked to agronomic performance or resistance to bean pests. By analyzing unprocessed endosperm, this study aims to reduce post-harvest processing variance and reveal genotypedriven metabolic signals that could support rapid phenotyping and targeted breeding for more resilient coffee cultivars.
Materials and methods
Coffea genotypes. Genotypes were selected based on their genetic background, consumer and producer preferences. All sampled plants were visually healthy. A summary of the origin and agronomic characteristics of the selected genotypes is in Figure 1. Four C. arabica and four C. arabica introgressed with C. canephora genotypes were selected for the study. The worldwide extended C. arabica ‘Red Bourbon’ is in the Typica-Bourbon genotypic group (T/B) and is sensitive to most diseases and pests. This genotype was chosen to represent early cultivated genotypes in America, which are more susceptible to diseases and pests (Montagnon et al. 2021, WCR 2024). The cultivar C. arabica ‘SL28’ is drought-tolerant but susceptible to pests. This variety was selected from the Red Bourbon lineage and has been cultivated in Kenya for over 100 years and was recently introduced to America (Montagnon et al. 2021, WCR 2024). We also included two Ethiopian landraces of C. arabica in our study as they possess greater genetic diversity and retain some of the wild resistance traits (Labouisse et al. 2008). The Ethiopian landrace ‘Gesha’ was first introduced to the Americas in the mid-20th century. It has moderate tolerance to CLR and is renowned for its exceptional coffee cup quality (Montagnon et al. 2021, WCR 2024). The second Ethiopian landrace was “Pink Bourbon”, selected by coffee growers due to its favorable agricultural characteristics. This landrace was initially believed to be a cross between Red and Yellow Bourbon; however, it was later determined to be an Ethiopian landrace (Fretheim 2023). From the Sarchimor group we selected C. arabica ‘Marsellesa’ (Villa Sarchí CIFC 971/10 × Timor 832/2) and ‘Mundo Maya’ (T5296 × ET01) both resistant to CBD and CLR, and the latter tolerant to nematodes. There is also a representative of the Catimor group, C. arabica (Timor 832/1 × Caturra) ‘Costa Rica 95’, which is resistant to CLR. Though less common in America, we also included an Arabusta related genotype, C. arabica (Icatú × Catuaí) ‘Yellow Catucaí.’ While Catuaí is a cross between C. arabica cultivars of Caturra and Mundo Novo which in turn is a cross between Bourbon and Typica, Arabusta genes of Catucaí comes from Icatú, which was developed by a cross of Mundo Novo with the tetraploid C. canephora, followed by several backcrosses with Mundo Novo. Therefore, Yellow Catucaí are mostly T/B, however it retained moderate resistance to CLR from the Arabusta parents (Eskes et al. 1990, WCR 2024).
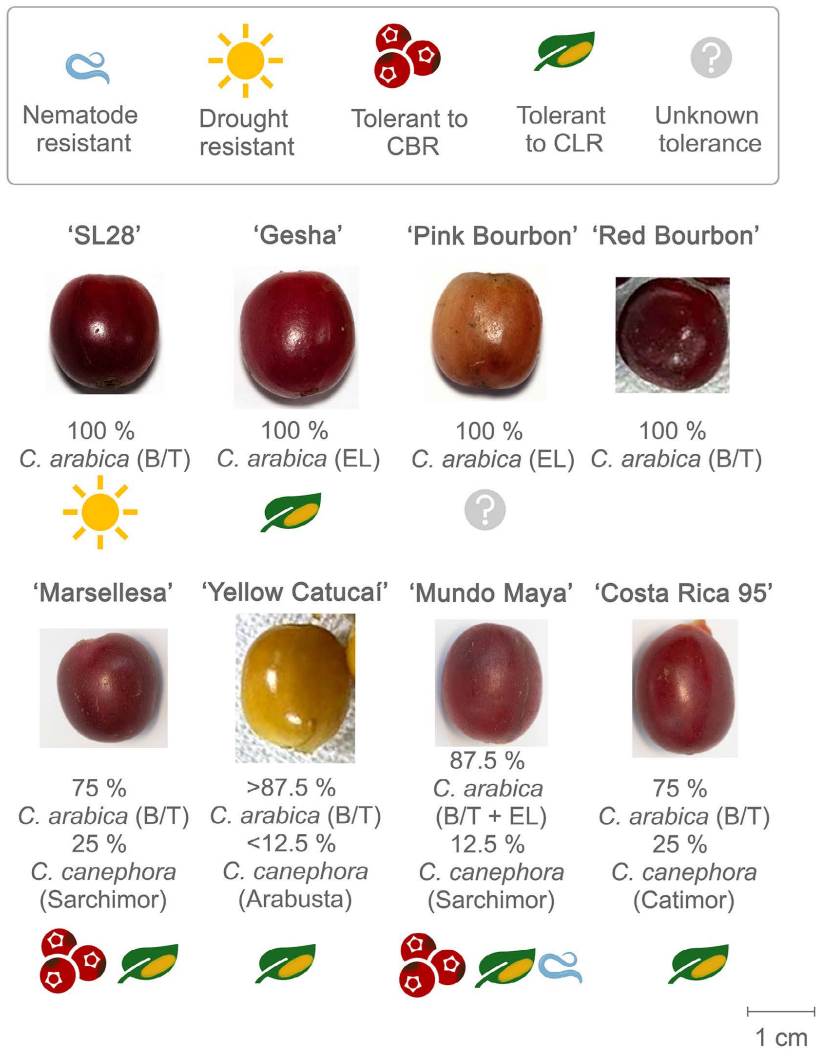
Pictures by Akeri Cruz Bonilla.
Figure 1 Coffee berries collected in the demonstrative coffee plantation of the Francisco Javier Clavijero Botanical Garden and the Private Conservation Area Finca Metlapili. Information about agronomic traits for each genotype is indicated.
Sampling area. Coffea spp. berries from the genotypes of Marsellesa, Costa Rica 95, Mundo Maya and Yellow Catucaí were collected from the demonstrative coffee plantation of the Francisco Javier Clavijero Botanical Garden (INECOL), Xalapa, Veracruz (19° 29′ N 97° 09′ O, 1,400 m asl) while biological material corresponding to Red Bourbon, Gesha, Pink Bourbon, and SL28 were collected from the private conservation area Finca Metlapili, Coatepec, Veracruz (19° 29’ N 96° 57’ O, 1,300-1,400 m asl) on March 2025. Due to the geographical proximity and similar height of both coffee plantations, the climatic conditions were similar. Both sites were chosen due to their very similar agronomic management, where coffee plants grown in an agroforestry system under tree shade and adjacent to mist forest areas and water streams. Agronomic management include minimum intervention, avoiding the use of pesticides or herbicides, being weeds controlled manually. Fertilizing occurs only when necessary and only using compost. Coffee plants are not man-watered and are just irrigated by rainwater.
Plant material collection and processing. For each genotype at least 40 healthy berries at stage 88 according to the Biologische Bundesanstalt, Bundessortenamt und Chemische Industrie’s scale for coffee development (Arcila-Pulgarín et al. 2002) were hand-picked from a minimum of five different plants. Pulp was removed immediately after harvest, and seeds were kept at -80 °C to avoid fermentation. The endosperms were lyophilized (FreeZone 2.5, Labconco, Kansas City, MO, USA) at -40 °C and < 0.1 mBar and milled using a food processor (NBR-0801, Nutribullet, Los Angeles, CA, USA).
Extract preparation. Methanolic extraction of each genotype was performed using 2.5 g of lyophilized endosperm powder mixed with one gram of diatomaceous earth as a dispersant agent in an Accelerated Solvent Extraction (ASE) system (Dionex ASE 350, Thermo Fischer Scientific, Sunnyvale, CA, USA). Extraction was performed using 34 mL cells with a 30 % rinse volume at 40 °C with two static cycles of five minutes each. The methanol solvent was completely removed using a rotary evaporator (R-100, Büchi, Flawil, Switzerland).
Untargeted metabolomics. Analyses were performed according to previous reports (Monribot-Villanueva et al. 2022). Briefly, dried extract was resuspended in methanol with 0.1 % (v/v) of formic acid to a concentration of 50 mg·mL-1 and filtered with a 0.2 μm pore PVDF membrane. Five microliters were injected (15 °C) into an Ultra HighPerformance Liquid Chromatography (UPLC) system (ACQUITY I-Class, Waters, Milford, MA, USA) coupled to a Quadrupole Time Of Flight (QTOF) high-resolution mass spectrometer (Synapt G2-Si, Waters, Milford, MA, USA). Samples run at 40 °C through an ACQUITY Bridged Ethylene Hybrid column (2.1 × 50 mm, particle size of 1.7 μm) with a linear elution gradient of water-acetonitrile with 0.1 % (v/v) of formic acid at a constant flux of 0.3 mL min-1. Triplicates were run for each genotype and quality control (mix of equal volumes of each extract) samples were included.
Data processing, analysis, and identification of compounds. MassLynx (Waters version 4.3.1) software was used for the acquisition of raw data. Processing of the raw data was performed with Progenesis QI (Waters) including peak detection, retention time (RT) alignment, and analysis of variance (ANOVA) between genotypes. A good level of accuracy for the tentative annotation (confidence level two according to Schymanski et al. 2014) based on mass per charge (m/z) error (<10 ppm), mass spectra and isotopic pattern similarity was achieved. A quality filter based on taxonomy criterion was applied to the identifications to retain only those metabolites reported for Coffea spp. according to public databases included in Pubchem (Kim et al. 2025). The identity of caffeic acid, chlorogenic acid, p-coumaric acid and phenylalanine were confirmed by co-elution with authentic standards (level one according to Schymanski et al. 2014).
Peaks statistical analysis. Data analysis of the peak intensities was performed using MetaboAnalyst v. 6.0 software (Pang et al. 2024). Constant or single-value peaks were discarded. Raw intensities were quantile-normalized, log10-transformed, and Pareto-scaled. Unsupervised hierarchical clustering analysis (HCA) was performed using Euclidean distance and Ward’s clustering method. Principal Component Analysis (PCA) was built using two components and the association between cultivars and the resulting structure was calculated through 999 permutations in a Permutational Multivariate Analysis of Variance (PERMANOVA). Functional analysis was performed including the 10 % most significant features (P value were all under 10-11) for the ANOVA test performed by Progenesis QI. Arabidopsis thaliana was chosen as a reference organism for metabolite identification and pathway enrichment analysis. Only pathways with at least three compounds identified by the algorithm, based on m/z values (level three according to Schymanski et al. 2014) were included in the analysis.
Chemical profile analysis. The annotated metabolites (accuracy levels 1 and 2) were analyzed. Peak intensities were transformed into log2 and Pareto scaled. To identify differentially accumulated metabolites, an HCA in a heatmap was built using Euclidean distance and Ward’s clustering algorithm. To identify key metabolites for Coffee cultivars differentiation, it was performed a two component Spared Partial Least Squares Discriminant Analysis (sPLS-DA) model using ten metabolites by component.
Results
Untargeted metabolomics. The HCA dendrogram of the combined samples, along with a heatmap built using the feature-scaled, normalized peak intensities (Figure 2A), shows that the endosperms of each cultivar had characteristic metabolic profiles and were grouped based on their genetic background. In the dendrogram, the samples were first divided into two main groups: one included all Timor hybrids, and the other included all T/B-related cultivars. Yellow Catucaí, although it has introgression with Arabusta genes, was included in the T/B group, while the two Ethiopian landraces were each placed in their own group: Gesha was grouped within the Timor group, and SL28 was placed within the T/B group (Pink Bourbon). The Timor group showed more chemical variations among cultivars, and no clear subgroups were observed in the dendrogram. The first ramification was for the Catimor Costa Rica 95. The second and third ramifications were for the Sarchimor, Marsellesa, and Mundo Maya cultivars, respectively, and finally, the Gesha. The T/B-related group exhibited two subgroups: one formed by SL28 and the Yellow Catucaí, and the other by the Red Bourbon and the Pink Bourbon. On the other hand, the PCA (Figure 2B) was able to explain 35.4 % of the variability (the first component accounted for 23.1 % and the second component for 12.3 %), and the permutation analysis of the PCA was highly significant (P value = 0.001), discarding it as a chance occurrence. Cultivars were grouped by the first component’s coefficients, similarly to the HCA (Figure 2A), into two groups: the Timor group, with negative coefficients, and the T/B group, with positive coefficients (Figure 2B). The first component coefficients of the three Timor-related cultivars were superposed; nevertheless, incorporating the second component allowed differentiation between the only Catimor (Costa Rica 95) and the two Sarchimor cultivars (Marsellesa and Mundo Maya). Gesha samples did not overlap with the Sarchimors but were close to Mundo Maya in both PCA dimensions. In the T/B related group, the first component mimics the first subdivision of the dendrogram, where Yellow Catucaí completely overlapped with SL28, and Red Bourbon partially overlapped with Pink Bourbon. The Ethiopian landrace Pink Bourbon had positive coefficient for the second component, contrary to the other T/B group genotypes which all had negative coefficients; even though Yellow Catucaí remain close to SL28 and Red Bourbon, the latter were the only ones which overlapped in the second component.
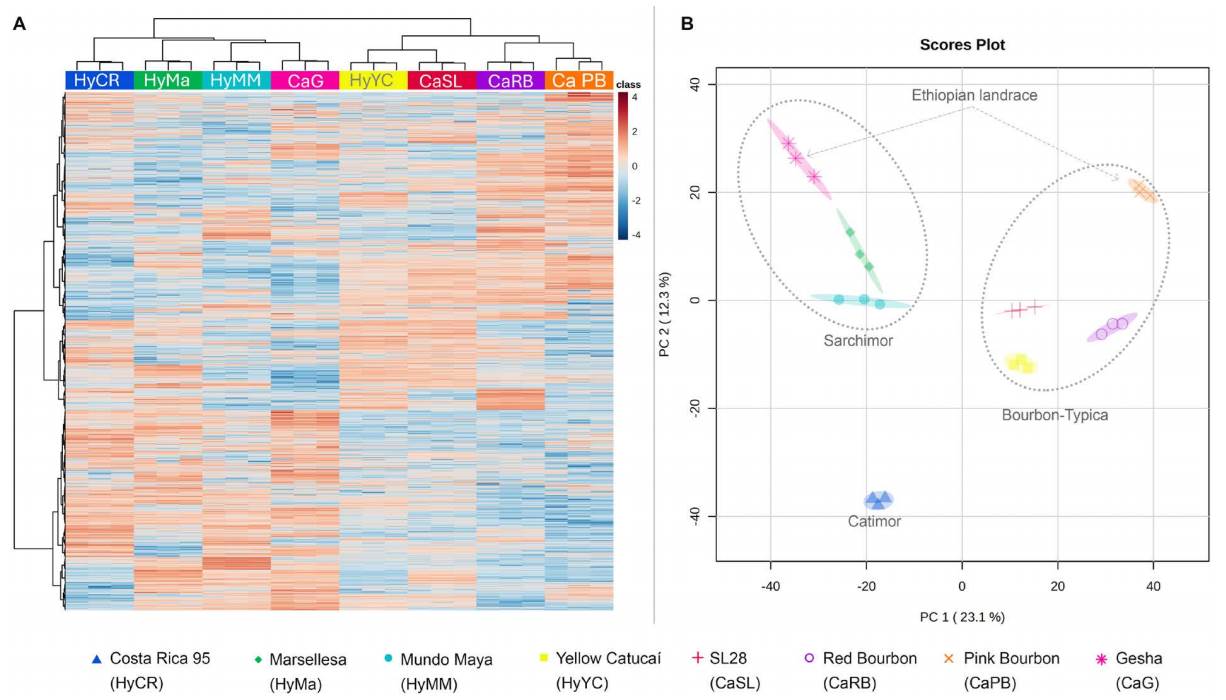
Figure 2 Statistical analysis on the full set of m/z-RT features from both positive and negative modes detected through UPLC-MS. A) Dendrogram using Euclidean distance and Ward algorithm combined with a heatmap showing color-coded z-scored normalized intensities of each m/z-RT features (rows) for each sample (columns). B) Unsupervised PCA (F value = 381.9 and R 2 = 0.99405) showing scores from the first PC in the X- axis and second PC in the Y-axis; percentage of explained variance by each PC is indicated in brackets.
Functional analysis. The Mummichog algorithm identified a total of 67 pathways that were shared by all genotypes, suggesting more quantitative than qualitative differences (Figure 3). The metabolic pathways with the greatest variance coefficient between genotypes in the enrichment factor are represented in Figure 3. The full list of pathways can be seen in the Supplementary material, Figure S1. Differences in enrichment factors between cultivars were small, as would be expected for individuals belonging to the same species. Arachidonic metabolism was the pathway with the most variation, and it was enhanced in Gesha, and least in SL28. Gesha also had enhanced glycine, serine, and threonine metabolism. Linoleic acid metabolism was more enriched in Marsellesa, Red Bourbon, SL28, and Yellow Catucaí. Monoterpenoid biosynthesis was enriched in all genotypes compared to Costa Rica 95. Pink Bourbon stands out for its glycolysis-gluconeogenesis, inositol phosphate metabolism, and fructose metabolism enrichment. TCA cycle was enriched in all lines with introgressed genes from C. canephora and Red Bourbon.
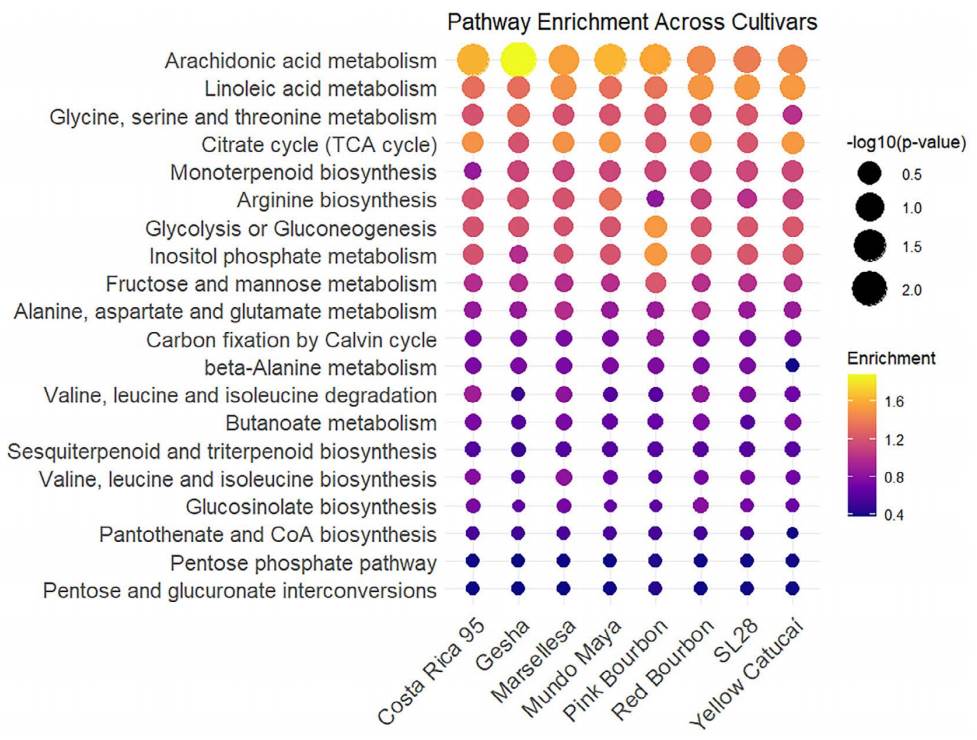
Figure 3 Pathway enrichment analysis using Arabidopsis thaliana as model organism. Color-coded enrichment factor and size of the dots representing the negative logarithm of the P value.
Differential chemical profiles of Coffea cultivars. From the complete set of compounds identified with high confidence by Progenesis QI, 69 fulfilled our stricter quality and taxonomic criteria (Table 1). Most compounds found were phenylpropanoids. We also identified alkaloids, terpenoids, organic acids and free amino acids. As expected in endosperm, auxin related compounds were identified. Peak intensities of the annotated compounds were used for an HCA (Figure 4) which gave a similar structure to the one produced by the full list of m/z-RT features (Figure 2A). The heatmap showed that the T/B-related group accumulated more metabolites than the Timor-related group. Most caffeoylquinic acids (CQAs), feruloylquinic acids (FQAs), amino acids and organic acids followed this pattern. Yellow Catucaí stood out because it accumulated theobromine, SL28 for the accumulation of 9-HOTrE, Red Bourbon for the accumulation of pipecolic acid, Pink Bourbon for the accumulation of 1-palmitoyl-2-hydroxyglycer-3-phophoetanolamine, Marsellesa for the accumulation of xanthosine, Mundo Maya for both linoleic, and 2,3-dihydroxypropyl palmitate and Gesha for its accumulation of cafestol.
Table 1 Metabolites identified in the coffee endosperm.
| Accepted Compound ID | RT (min) |
m/z (Da) |
Adducts | Mass Error (ppm) |
Isotope Similarity (%) |
|---|---|---|---|---|---|
| Vanillic acid | 5.92 | 165.0540 | [M+H-H2O]+ | -3.6 | 93.7 |
| Methyl-chlorogenate | 2.39 | 391.0975 | [M+Na]+ | -6.7 | 89.7 |
| 3-O-Caffeoyl-4-O-sinapoylquinic acid | 6.02 | 559.1442 | [M-H]- | -2.7 | 87.4 |
| Sinapic acid | 7.00 | 207.0645 | [M+H-H2O]+ | -2.9 | 92.9 |
| Cinnamic acid | 11.18 | 131.0491 | [M+H-H2O]+ | 0.0 | 95.8 |
| Caffeic acid hexoside | 2.61 | 323.0754 | [M-H2O-H]- | -5.3 | 89.2 |
| Catechin gallate | 3.87 | 407.0729 | [M+H-2H2O]+ | -7.24 | 86.7 |
| 5-Caffeoylshikimic acid | 4.05 | 319.0796 | [M+H-H2O]+ | -4.7 | 88.9 |
| Caffeic acid* | 3.07 | 145.0289 | [M+H-2H2O]+ | 2.8 | 92.2 |
| 4-Caffeoylquinic acid | 2.94 | 353.0867 | [M-H]- | -3.2 | 98.0 |
| 3-p-Coumaroylquinic acid | 5.59 | 337.0907 | [M-H]- | -6.3 | 91.7 |
| Isoscopoletin | 4.30 | 193.0486 | [M+H]+ | -4.6 | 93.2 |
| 3,4-Dimethoxycinnamic acid | 7.07 | 191.0706 | [M+H-H2O]+ | 1.5 | 93.3 |
| Coniferaldehyde | 3.39 | 161.0588 | [M+H-H2O]+ | -4.9 | 95.9 |
| 1,3-Dicaffeoylquinic acid | 4.96 | 517.1325 | [M+H]+ | -2.9 | 89.0 |
| 4,5-Dicaffeoylquinic acid | 5.41 | 515.1182 | [M-H]- | -2.5 | 96.0 |
| 3,4-Dicaffeoylquinic acid | 4.93 | 515.1184 | [M-H]- | -2.2 | 96.0 |
| 3,5-Dicaffeoylquinic acid | 5.06 | 539.1137 | [M+Na]+ | -4.4 | 86.4 |
| p-Coumaric acid* | 3.47 | 147.0447 | [M+H-H2O]+ | 4.0 | 93.4 |
| 3-Caffeoylquinic acid | 2.26 | 353.0867 | [M-H]- | -3.1 | 98.1 |
| Ferulic acid | 5.87 | 177.0547 | [M+H-H2O]+ | 0.5 | 93.1 |
| Oxypeucedanin hydrate | 7.78 | 305.0997 | [M+H]+ | -7.4 | 90.8 |
| 4-Feruloylquinic acid | 3.87 | 369.1167 | [M+H]+ | -3.5 | 91.4 |
| Chlorogenic acid* | 2.85 | 355.1004 | [M+H]+ | -5.4 | 90.1 |
| Eugenol | 11.84 | 165.0906 | [M+H]+ | -2.3 | 98.6 |
| LPC 18:3 | 12.80 | 562.3121 | [M+FA-H]- | -5.7 | 94.7 |
| LPC 18:2 | 13.46 | 520.3397 | [M+H]+ | -0.1 | 90.5 |
| 2-Palmitoylglycerol | 13.83 | 363.3076 | [M+CH3OH+H] | -8.9 | 93.4 |
| LPE 18:2 | 12.20 | 476.2770 | [M-H]- | -2.6 | 94.4 |
| 1-Palmitoyl-2-hydroxy-glycero-3-phosphoethanolamine | 13.88 | 495.3169 | [M+ACN+H]+ | -5.5 | 73.3 |
| Linolenic acid | 13.76 | 279.2317 | [M+H]+ | -0.6 | 92.2 |
| FA 18:2+3O | 9.59 | 327.2151 | [M-H]- | -7.9 | 90.8 |
| 2,3-Dihydroxypropyl palmitate | 7.56 | 331.2854 | [M+H]+ | 3.3 | 96.4 |
| FA 18:3+2O | 12.80 | 309.2070 | [M-H]- | -0.3 | 93.2 |
| 9-HOTrE | 6.72 | 275.2024 | [M-H2O-H]- | 2.5 | 97.6 |
| PC(16:0/0:0) | 14.47 | 496.3399 | [M+H]+ | 0.2 | 96.7 |
| Linoleic acid | 12.22 | 279.2312 | [M-H]- | -6.4 | 96.8 |
| Arachidic acid | 13.15 | 312.3019 | [M-]- | -4.8 | 96.8 |
| Indolelactic acid | 5.30 | 186.0541 | [M-H2O-H]- | -9.6 | 93.3 |
| Indole-3-ethanol | 3.27 | 144.0801 | [M+H-H2O]+ | -4.4 | 84.3 |
| Phenethylamine | 3.52 | 122.0965 | [M+H]+ | 0.6 | 99.0 |
| Dopamine | 3.37 | 136.0752 | [M+H-H2O]+ | -3.5 | 94.7 |
| Trigonelline | 0.60 | 120.0448 | [M+H-H2O]+ | 2.9 | 98.1 |
| Indole-3-acetamide | 1.43 | 175.0860 | [M+H]+ | -3.6 | 93.4 |
| Serotonin | 1.53 | 177.1013 | [M+H]+ | -5.5 | 95.7 |
| Theobromine | 2.37 | 181.0707 | [M+H]+ | -7.2 | 90.9 |
| Caffeine | 2.99 | 195.0883 | [M+H]+ | 3.2 | 99.1 |
| Mascaroside I | 4.84 | 509.2383 | [M+H]+ | 0.4 | 91.2 |
| Mascaroside II | 6.19 | 513.2143 | [M+Na]+ | 9.7 | 85.1 |
| Cafestol | 11.34 | 299.2001 | [M+H-H2O]+ | -1.4 | 91.3 |
| Kahweol | 11.19 | 297.1851 | [M+H-H2O]+ | 0.7 | 94.1 |
| Geraniol | 5.87 | 177.1250 | [M+Na]+ | -0.1 | 90.2 |
| Malic Acid | 0.51 | 133.0139 | [M-H]- | -2.9 | 96.8 |
| Isoleucine | 0.62 | 132.1018 | [M+H]+ | -0.6 | 97.2 |
| Glutamic acid | 0.64 | 130.0500 | [M+H-H2O]+ | 1.1 | 93.5 |
| Citric acid | 0.82 | 191.0179 | [M-H]- | -9.3 | 96.1 |
| Leucine | 1.27 | 132.1019 | [M+H]+ | 0.0 | 95.1 |
| 3-methyl-2-oxovalerate | 1.63 | 129.0547 | [M-H]- | -7.5 | 97.4 |
| Phenylalanine* | 1.8 | 166.0861 | [M+H]+ | -0.8 | 93.9 |
| Proline | 3.25 | 116.0701 | [M+H]+ | -4.1 | 97.7 |
| Aspartic acid | 3.29 | 134.0458 | [M+H]+ | 7.3 | 94.5 |
| Pipecolic acid | 0.77 | 130.0868 | [M+H]+ | 3.9 | 95.6 |
| Quinic Acid | 3.80 | 191.0551 | [M-H]- | -5.5 | 97.6 |
| Xanthosine | 1.50 | 283.0659 | [M-H]- | -8.7 | 94.2 |
| Adenosine | 1.32 | 268.1039 | [M+H]+ | -0.4 | 92.7 |
| Guanosine | 1.36 | 284.0968 | [M+H]+ | -7.6 | 94.9 |
| 9-(β-D-Ribofuranosyl)zeatin | 6.12 | 393.1864 | [M+ACN+H]+ | -4.8 | 97.6 |
| Trehalose | 0.51 | 377.0825 | [M+Cl]- | -9.0 | 90.6 |
| Raffinose | 0.72 | 549.1637 | [M+FA-H]- | -6.9 | 88.9 |
*Metabolites identity confirmed with standards.
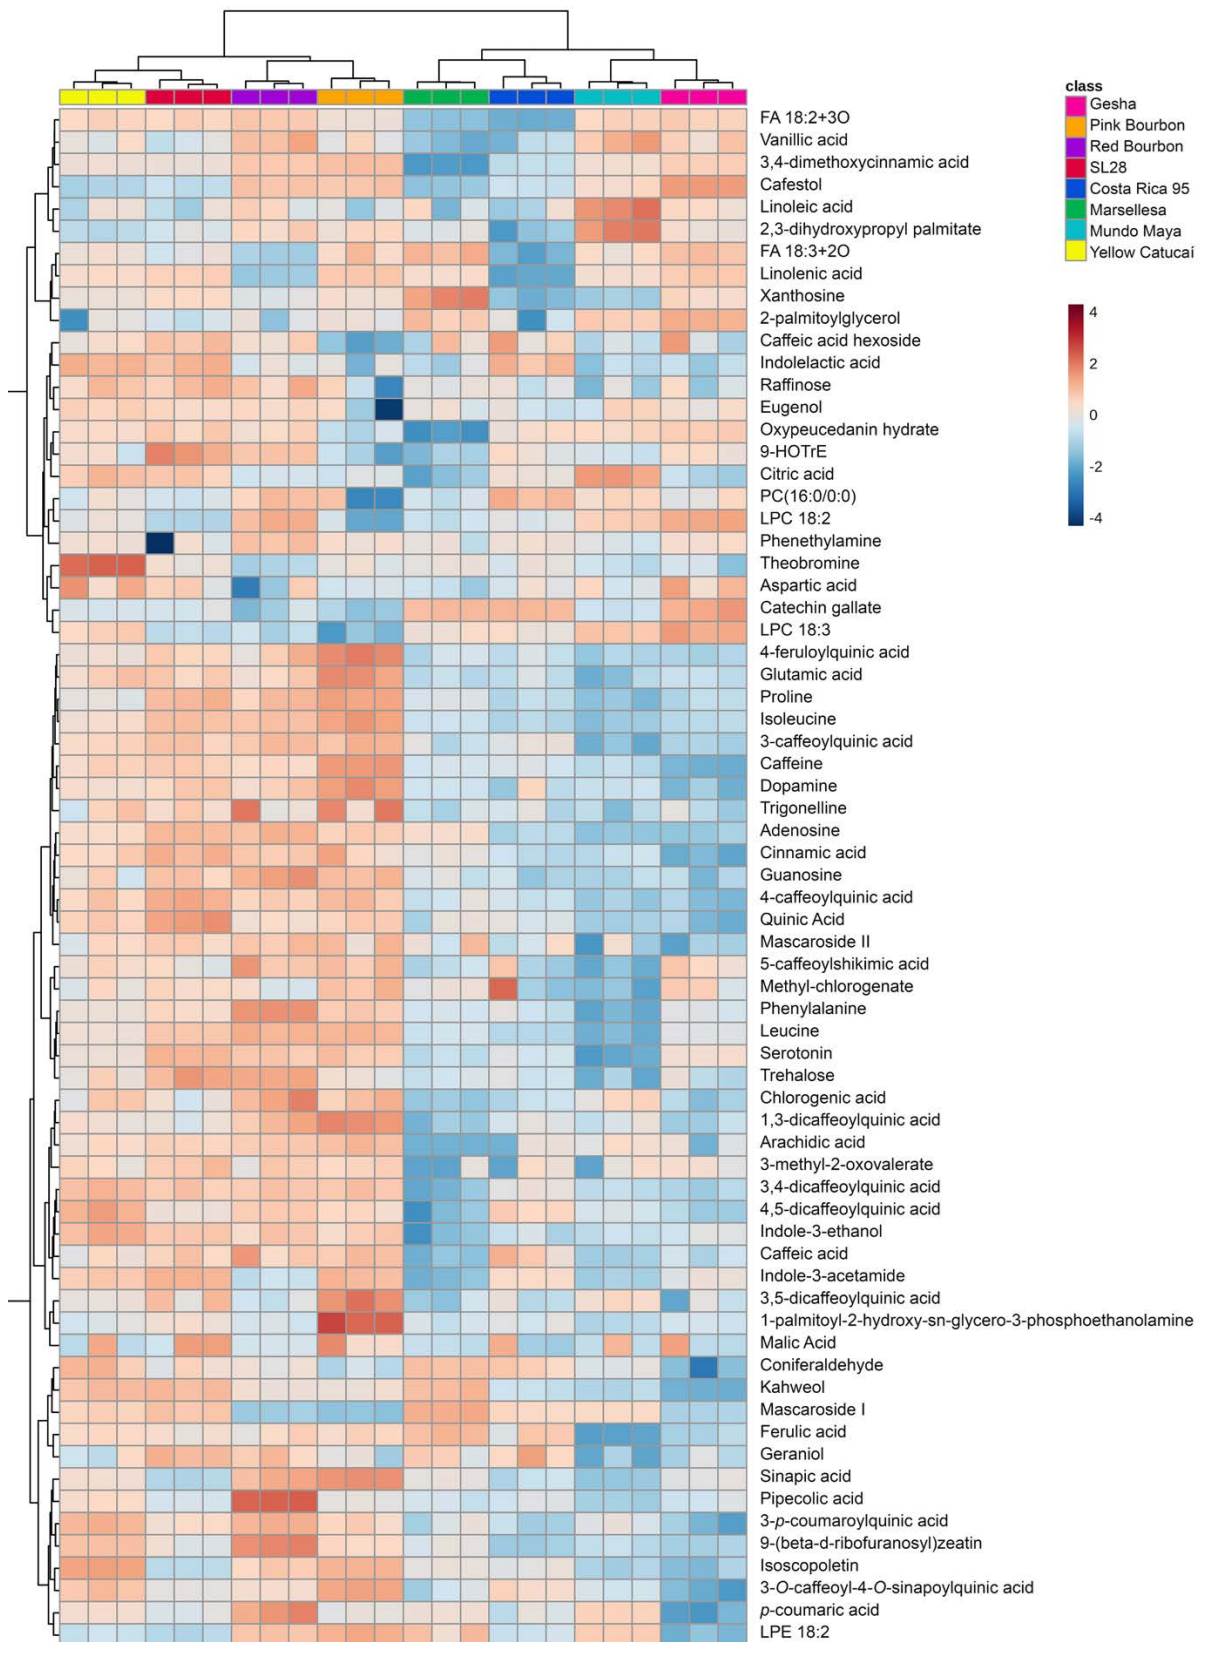
Figure 4 Dendrogram using Euclidean distance and Ward algorithm combined with a hierarchically ordered heatmap showing color-coded z-scored normalized intensities of each high confidence metabolite identification (rows) for each sample (columns).
Accumulation patterns of metabolites related to the caffeine biosynthetic pathway differed between genotypes. Trigonelline and caffeine followed the general pattern of accumulation in T/B related group and not in Timor related group. Gesha cultivar exhibited the lowest caffeine content, while the other Ethiopian landrace, Pink Bourbon, exhibited the highest level; nevertheless, both had similar levels of xanthosine and theobromine. Marsellesa presented elevated levels of xanthosine and low levels of theobromine and caffeine; Mundo Maya and Costa Rica 95 exhibited low levels of the three metabolites; SL28 and Red Bourbon had lower levels of xanthosine and theobromine than caffeine; and Yellow Catucaí greatly accumulated theobromine compared to all other genotypes. As well as caffeine, other alkaloids or alkaloids-related compounds were generally more accumulated in T/B related genotypes. Phenethylamine did not present great differences in accumulation between genotypes while dopamine was accumulated mostly in Pink Bourbon and lowest in Gesha. Pipecolic acid was mostly accumulated in Red Bourbon and exhibited the lowest content in Mundo Maya cultivar. In fact, Mundo Maya was the genotype with less accumulation of alkaloids being closely followed by Marsellesa.
Lipids were most accumulated in Mundo Maya and Gesha genotypes. Mundo Maya especially accumulated linolenic acid and 2,3-dihidroxypropyl palmitate and Gesha LPC 18.2, LPC 18:3 and 2-palmitoylglycerol. Amino acids and organic were mostly accumulated in the Timor-related group while being diminished in the T/B-related group. Diterpenoids exhibited different accumulation patterns. Only cafestol was differentially accumulated in Gesha while none of the other diterpenoids exhibited differences compared to the other genotypes. Pink Bourbon and Red Bourbon accumulated mascaroside II and cafestol, but not as much as in Gesha. The three varieties Yellow Catucaí, SL28 and Marsellesa follow a similar diterpenoid accumulation pattern and the monoterpenoid geraniol was mostly accumulated in SL28 genotype.
Modelling of metabolite profile differentiation. The sPLS-DA model built with the annotated compounds was able to differentiate all the genotypes using only two components with ten metabolites per component (Figure 5A). Together, the 20 metabolites included in both components explained 50.5 % of the total variability. Coffee cultivars were separated into four quadrants: Mundo Maya and Gesha clustered in the negative-negative quadrant; Costa Rica 95 and Marsellesa were clustered in the negative-positive quadrant; in the positive-positive quadrant the T/B related Yellow Catucaí and SL28 were grouped and in the positive-negative quadrant were Red Bourbon and Pink Bourbon. First component, built with primary metabolism compounds including amino acids and nucleosides as well as specialized metabolism, particularly CQAs and FQAs, was able to differentiate between the Timor related and the T/B genotypes. On the other hand, metabolites from the second component presented a more varied distribution of chemical groups, including phenolics, diterpenoids, and lipids. The diterpenoid cafestol, and the phenylpropanoid dimethoxycinnamic acid were the most important compounds in this component, followed by vanillic acid, mascaroside I and kahweol. This component was able to differentiate almost all Bourbon genotypes from Ethiopian landraces, excepting for Red Bourbon.
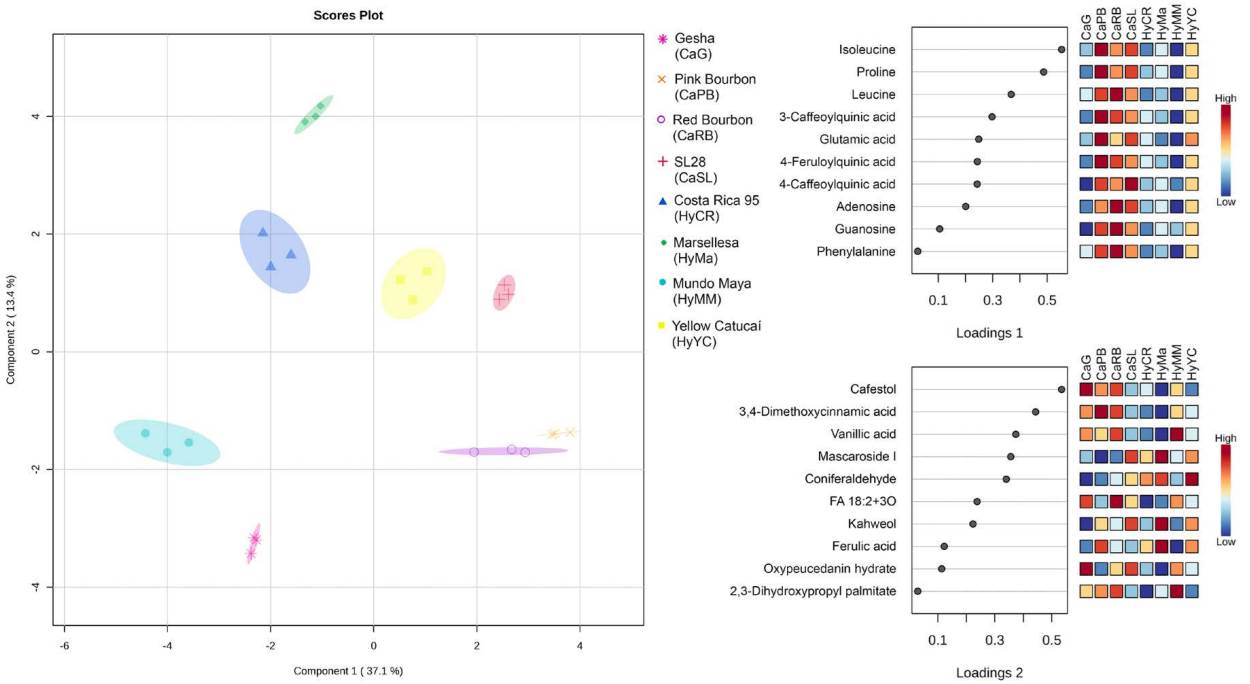
Figure 5 Score plot (left) of the first two components of the sPLS-DA built with the high confidence identifications (error rate ~ 0 calculated by LeaveOne-Out-Cross-Validation). The percentage of explained variation by each component is written in parenthesis. The loading values for metabolites of each component is presented together with the z-score for each genotype.
Discussion
Discrimination of cultivars by their chemical profiles. Previous studies have successfully discriminated among cultivars based on endosperm chemical composition (Bertrand et al. 2008, Wei et al. 2012, Bicho et al. 2013). While some studies compared genotypes under the same conditions, they used processed green coffee beans, which introduced a source of variation. In this study, it was possible to correctly cluster samples in consideration of their genotype using unprocessed lyophilized endosperm by their differential chemical profile. Importantly, genotypes did not cluster according to the coffee plantation, whereas other studies have shown geographic origin to be a crucial factor in determining metabolic profiles (Bertrand et al. 2008). It might be due to our effort to minimize environmental variability by choosing similar coffee plantations. However, the studies with processed green coffee beans highlight the contribution of the process to variability, which is known to have a great effect on physicochemical characteristics and cup quality (Therdtatha et al. 2023, Freire Muñoz et al. 2024).
Genotypes in the HCA and PCA were grouped into cultivars according to their genetic background. Timor cultivars were all grouped, as were T/B genotypes. It is important to note that Ethiopian landraces exhibit high genetic variability; therefore, it is not surprising that they are not clustered together (Silvestrini et al. 2007, Labouisse et al. 2008). In fact, Pink Bourbon’s genetic studies conducted by two private laboratories showed that its closest relatives were Ethiopian landraces; however, none of them were Gesha, while exhibiting some similarity with Bourbon and other Yemen-dispersed varieties (Fretheim 2023). In fact, even in academic writings it was wrongly thought to be a natural cross between Red and Yellow Bourbon due to its phenotypic characteristics, therefore the name given to this variety (Osso-Bolañoz & Perez-Santofimio 2021). The association between the Ethiopian landrace Gesha, famous for its excellent cup aroma, and the Sarchimor varieties was unsuspected. However, they share important agronomic characteristics. For instance, Timor hybrids were engineered to be resistant to the CLR, and Gesha is known to be naturally resistant to type II CLR, the most common type found in Latin America (WCR 2024). Interestingly, Gesha is chemically closer to Mundo Maya in the HCA; the latter is a cross of a Sarchimor and an Ethiopian landrace collected by CATIE, and the Gesha genotype was also collected by CATIE. It is known that they come from different original Ethiopian plants, with distinct accessions -Gesha original accession ID was ‘T2722’ and ancestor of Mundo Maya ‘ET01’- however, close genetic relation between both ancestors might be possible (WCR 2024). The presence of the backcross hybrid Yellow Catucaí in the T/B related group is not surprising as both parentals Icatú and Catuaí varieties have mostly T/B genetics. The parental C. arabica Catucaí is 100 % T/B (‘Caturra’ and ‘Mundo Novo’) while Icatú was developed through several backcrosses of Arabusta with ‘Bourbon’ and ‘Mundo Novo’ (‘Bourbon’ × ‘Typica’) and it is mostly considered C. arabica (Eskes et al. 1990, Velásquez Orozco 2019, WCR 2024).
Caffeine, CQAs, and FQAs, although they do not belong to the same biosynthetic pathway, are usually correlated and have been used for chemotaxonomic classification of Coffea spp. Both C. arabica and C. canephora belonged to the group of Coffea species that accumulated high concentrations of all caffeine, CQAs and FQAs in comparison with other Coffea spp. (Anthony et al. 1993). Studies in commercial green coffee beans generally found higher content of caffeine and total CQAs and FQAs in C. canephora than in C. arabica (Wei et al. 2012, Bicho et al. 2013). Nevertheless, different genotypes are usually grown in different conditions, C. canephora and hybrids, are usually grown at lower altitudes, in warmer climates and in plain sun while C. arabica is usually grown at higher altitudes, cooler climate and under tree shade and caffeine production has been reported to varied enormously according to environmental conditions (Ramalho et al. 2018, Chekol et al. 2024). Other studies have shown that there are complex metabolic variations in hybrids, backcrosses and introgressed lines showing overlapping and smaller values of caffeine, CQAs, and FQAs than in C. arabica (Guerrero et al. 2001, Bertrand et al. 2008, Cheserek et al. 2021). In the present study all C. arabica genotypes but for Gesha exhibited higher accumulation of caffeine and CQAs than the genotypes introgressed with C. canephora. A previous comparative analysis, including three of the genotypes included in the present study, the introgressed Costa Rica 95 and Marsellesa and the pure C. arabica Gesha, showed that there were no significant differences in total CQAs and FQAs content between these varieties (Jeon et al. 2024). While there are discrepancies in the CQAs and FQAs accumulation pattern between this previous study and ours, for example, 4-CQA in the present study was accumulated in Marsellesa than in Gesha, while the pattern was opposite in the Jeon et al. (2024) study. Previous studies also showed that location not only affects the content of these metabolites, but the effect it produces differs depending on the genotype (Bertrand et al. 2008, Cheserek et al. 2021). Despite the generalized use of CQAs as coffee genotype identification criteria, due to the complex relation between genotype and phenotype for these metabolites it might not be possible to generalize this criterion and might only apply for specific climatic conditions.
Identified compounds with possible agronomic traits. Many of the identified compounds play a role in plant defense. Caffeine has been known to be an insecticide for decades (Nathanson 1984), however the most important insect pest that attacks coffee bean, CBB, is known to be well adapted to this compound (Ceja-Navarro et al. 2015). Similarly to previous studies, a great diversity of CQAs, FQAs, and other cinnamic acid derivatives were identified which seems to be useful in genotypes discrimination due to their presence in the first component of the sPLS-DA. These compounds belong to a very active group with reported antimicrobial and insecticide activity (Almeida et al. 2006, Martínez et al. 2017, Lin et al. 2022). This extends to its constituents, cinnamic acid, p-coumaric acid, ferulic acid, and caffeic acid some of which have shown biocidal activity against Collecotrichum, the causal agent of the CBD (Cheng et al. 2008, Roy et al. 2018, Kaushik et al. 2019, Hu et al. 2023b). Ferulic acid, caffeic acid, and chlorogenic acid have been reported as antifeedant or/and insecticidal and have been related with plant resistance mechanisms to insects (Classen et al. 1990, Joshi et al. 2014, Lin et al. 2022). Moreover, in the potential control of CBB, a member of the Curculionidae family, ferulic acid exhibited antibiosis (affecting Dobie index) and antixenosis effect against Sitophilus zeamais, another endosperm borer member of this family (Classen et al. 1990). Nevertheless, transcriptomic studies of CBB have shown high expression levels of cytochrome P450, which is known to detoxify these metabolites (Noriega et al. 2019, Lin et al. 2022).
Vanillic acid is a well-known antifungal compound and has also shown modest insecticidal effect (Cheng et al. 2008, Roy et al. 2018, Kaushik et al. 2019, Hu et al. 2023a). In this group, eugenol might be an interesting compound as it is a potent insecticide to some insects (Huang et al. 2002, Cheng et al. 2008, Adhikari et al. 2022). Moreover, eugenol also affects S. zeamais through antifeedant effect (Huang et al. 2002). Terpenoids are another set of plant metabolites with agronomic potential, they are important in differentiating genotypes based on the chemical profiles due to their inclusion in the second component of the sPLS-DA. They have been reported with antibacterial, antifungal and insecticidal properties, particularly geraniol and cafestol (Zanetti et al. 2015, Tang et al. 2018, Antoine et al. 2023). Lipids, particularly linolenic acid, both as a free fatty acid and oxidated forms, are signaling and precursors of jasmonates (Wasternack & Hause 2013). Some exogenously applied hydroxy unsaturated fatty acids have direct antifungal properties (Yasari et al. 2021).
Even though cultivars have been developed against some diseases and pests important for coffee, such as nematodes, CBD, and CLR, there are few genotypes described to have a negative effect on the worst plant pest for this crop, CBB (Molina 2022), none of which are commercially grown. The antixenosis or antibiosis effect of these genotypes is not characterized and is not being related yet to any metabolite, though it seems to respond to a quantitative trait locus (Molina et al. 2022). Caffeine does not seem to be involved, however, in this study some interesting compounds have been identified with potential insecticidal or antifeedant properties such as ferulic acid, eugenol, coniferaldehyde, geraniol and cafestol (Huang et al. 2002, Zanetti et al. 2015, AlJabr et al. 2017, Novaes et al. 2019, Martins et al. 2025). These compounds and Coffea genotypes accumulating them should be evaluated against the CBB.
Altogether, this study highlights the presence of metabolites with potential agronomic importance and proves that they are differentially accumulated under the same conditions in different genotypes. These results pave the way to assessing the antixenosis or antibiosis effect of these genotypes and correlate them with the chemical composition.
Supplementary material
Supplemental data for this article can be accessed here: https://doi.org/10.17129/botsci.3812

