


 nueva página del texto (beta)
 Inglés (pdf)
 Artículo en XML
 Referencias del artículo
 Enviar artículo por email
 Citado por SciELO
  Similares en
SciELO
Similares en
SciELO 
 Permalink
Human activities have deeply altered Earth’s natural systems through land use change, overexploitation of resources, and the emission of atmospheric pollutants (Foley et al. 2005, Ceballos et al. 2015, Rockström et al. 2024). These processes have degraded air quality, compromised human health, and placed mounting pressures on biodiversity, leading to widespread disruptions in global biogeochemical cycles (Crutzen 2002, Lewis & Maslin 2018). Illustrating the scale of these changes, atmospheric CO2 rose from 280 ppm in 1750 to over 426 ppm in 2025, with a particularly steep increase from 369 ppm in 2000 (Lan et al. 2025, Eggleston et al. 2016). In turn, reactive nitrogen (Nr) emissions followed a similar trajectory, climbing from 15 Tg N yr-1 in 1860 to 220 Tg N yr-1 by 2010, with projections of up to 270 Tg N yr-1 by 2050 (Galloway et al. 2008, Fowler et al. 2013). Current estimates remain limited, but available data suggest that global Nr deposition peaked around 2015 and stabilized near 93 Tg N yr-1 by 2020 (Zhu et al. 2025).
Despite regulatory efforts, Mexico’s emissions remain high, largely due to its dependence on fossil fuels and limited enforcement capacity. In 2021, the country released 456 million tons of CO2 and 3.8 million tons ofNOₓ(INECC 2021). However, monitoring programs are concentrated in major urban centers such as Mexico City, Guadalajara, and Monterrey (SEMARNAT 2018a, b, PIGECA 2023). By contrast, mid-sized cities like Xalapa, with nearly 500,000 inhabitants and an estimated 200,000 vehicles (INEGI 2020, 2023) rely on a single monitoring station, a clear limitation for comprehensive assessments. This shortcoming is critical given additional sources of pollution, such as seasonal sugarcane burning, which has been associated with respiratory health impacts, including 74,882 reported infections between 2013 and 2017 (Andrade Rivera et al. 2022). Air quality records from Xalapa show that PM10 and PM2.5 concentrations frequently exceed both WHO guidelines and Mexican standards, while NO2 and SO2 occasionally surpass WHO thresholds, mainly due to road traffic (González-Rocha et al. 2016). Although high-resolution spatial data are lacking, the city’s complex topography and uneven urban development strongly suggest heterogeneous pollutant deposition, making Xalapa a relevant case study for spatial analyses of urban air pollution (González-Rocha et al. 2016, UV Ciencia Blog 2024).
In tropical urban environments, epiphytic plants, particularly atmospheric bromeliads, have become widely used as cost-effective biomonitors of urban air pollution, a role that is particularly valuable in regions with limited monitoring infrastructure (Felix et al. 2016, Díaz-Álvarez & de la Barrera 2018, 2020). Thriving in cities, they obtain water and nutrients directly from the atmosphere, so their tissues capture local air composition and reveal spatial patterns of pollutant deposition (Díaz-Álvarez & de la Barrera 2018). Bromeliads, for instance, have proven effective in tracking CO2 and nitrogenous emissions across both urban and rural environments. As a result, their elemental and isotopic profiles provide consistent indicators of pollution sources and concentrations at the sites where they grow (Zambrano García et al. 2009, Vianna et al. 2011, Pellegrini et al. 2014, Díaz-Álvarez et al. 2018, 2020). Within this group, T. schiedeana is particularly suitable for Xalapa, given its local abundance and documented sensitivity to atmospheric carbon and nitrogen emissions, reflected in both tissue content and isotopic composition (Tirado-Zamora et al. 2025). Its physiology further supports its role as a reliable long-term biomonitor in tropical seasonal environments.
Like other atmospheric bromeliads, T. schiedeana grows in environments with intermittent water supply, often regarded as arid or semi-arid (Benzing 2000). To withstand this stress, it relies on crassulacean acid metabolism (CAM), a photosynthetic pathway in which most CO2 uptake occurs at night. By keeping its stomata closed during the day, the plant minimizes water loss (Andrade et al. 2007, Reyes-García & Griffiths 2009). CAM photosynthesis also shapes tissue δ13C values, typically ranging from -10 to -22‰ in CAM species because phosphoenolpyruvate carboxylase discriminates less against13C than ribulose bisphosphate carboxylase/oxygenase (RuBisCO) in C3 plants (Ehleringer & Osmond 1989, Silvera et al. 2009). Moreover, CAM allows year-round photosynthetic activity, even though extended dry periods when C3 plants often reduce gas exchange or enter dormancy. This capacity to maintain activity enables T. schiedeana to integrate atmospheric inputs over time and strengthens its value as a biomonitor in tropical environments (Zotz & Winter 1996, Lüttge 2004, Males & Griffiths 2017).
Due to the reasons stated above, the spatial patterns of carbon and nitrogen contents, together with δ13C and δ15N values, of the epiphytic CAM bromeliad Tillandsia schiedeana across twenty sites in the metropolitan area of Xalapa were examined. This species could reflect spatial variation in elemental and isotopic composition, with more enriched values in densely urbanized areas and more depleted values in less urbanized or rural zones.
Materials and methods
Study area. The study was conducted in the metropolitan area of Xalapa-Enriquez, Veracruz, which covers approximately 200 Km2, in an altitude gradient between 1,120 - 1,720 meters above sea level (Figure 1). Xalapa is located within a mountainous landscape with fragments of Tropical Montane Cloud Forest, pastures, shade-grown coffee, sugarcane, and corn crops. Climate is characterized by a dry season from December to May and a rainy season from June to November, average annual temperature of 18 °C and an average annual rainfall of 1,509 mm (Soto-Esparza & Gómez-Columna 1993, Domínguez-Eusebio et al. 2019). During the dry season, the region is affected by frontal systems, while the rainy season brings tropical systems, including easterly waves, depressions, storms, and occasional hurricanes (Domínguez-Eusebio et al. 2019, and references therein).
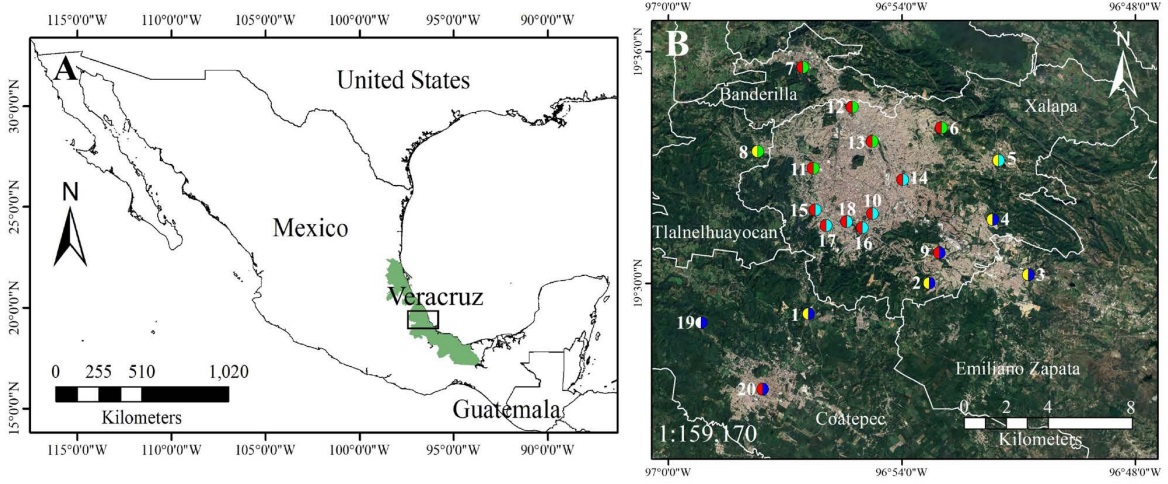
Figure 1 Study area (A) Mexico, with the state of Veracruz in the eastern region highlighted in green. A black rectangle marks the location of the Xalapa metropolitan area. (B) Close-up of selected municipalities within the ZMX, indicated by a white line. The study area includes 20 sampling sites (numbered). Symbol key: point fill = urbanization category (urban = red; peri-urban = yellow; rural = white); point ring/halo = geographical zone (north = green; center = light blue; south = blue). Sites by category: urban (points 6, 7, 9, 10, 11, 12, 13, 14, 15, 16, 17, 18, and 20), peri-urban (points 1, 2, 3, 4, 5, and 8), and rural zone (point 19). Satellite images were obtained from Google Earth Pro 7.3.6, dated April 16, 2024, with an eye elevation of 70.9 km.
High concentrations of PM2.5 and PM10 particles, as well as elevated levels of suspended gases (SO2 and NO2), have been reported in the Xalapa metropolitan area (González-Rocha et al. 2016). Specifically, average daily concentrations reached 85.9 µg/m3 for PM10 and 45.4 µg/m3 for PM2.5, which exceeded or approached the limits established by Mexican standards (75 and 45 µg/m3, respectively). Mean annual concentrations of NO2 (25.8 ppb) and SO2 (13.3 ppb) remained below national thresholds, although they may still contribute to health and environmental risks (González-Rocha et al. 2016).
To capture a broad range of environmental conditions and potential emission sources, 20 sampling sites, across the Xalapa metropolitan area, were selected. The location of sites was initially proposed at random but were constrained by the natural occurrence of this epiphyte and the region’s complex topography, which precluded the use of a systematic sampling grid the spatial distribution included sites near high-traffic roads, densely populated neighborhoods, vegetated urban zones, and a reference rural area without agricultural activity. In addition, large urban green areas and forested parks were deliberately excluded, as dense vegetation can act as a barrier that intercepts and dilutes atmospheric pollutants through deposition and altered wind flow patterns (Janhäll 2015, Xing & Brimblecombe 2019, Barwise & Kumar 2020, Chen et al. 2021). Although no direct measurements of traffic intensity or industrial emissions were taken, the spatial arrangement of sites ensured the representation of key land use types while avoiding clustering. This allowed for a broader interpretation of spatial trends.
Based on field observations, land use characteristics, and satellite imagery, the sampling sites were classified as urban (13 sites), peri-urban (6 sites), and rural (1 site) (Figure 1). Urban sites were located within the consolidated built-up area of Xalapa, which is characterized by high construction density, paved roads, dense infrastructure, and some vegetation cover. Although parameters such as construction density can be quantified using satellite imagery (e.g., Google Earth), in this study these characteristics were assessed qualitatively based on field observations and visual interpretation of aerial images. The peri-urban sites were found along the city’s fringe and featured lower construction density, mixed land use, unpaved roads, and remnants of vegetation or small-scale agriculture. This category corresponds to transitional zones between urban and rural areas (MacGregor-Fors 2010). The rural site was located outside the urbanized matrix, in an area dominated by natural vegetation and minimal urban infrastructure. We included it as a reference point to contrast pollutant loads in developed areas with those in a relatively undisturbed environment, while maintaining the study’s primary focus on Xalapa’s urban landscape.
In addition, the 20 sampling sites were grouped into three regions for spatial interpretation: north (sites 6, 7, 8, 11, 12, and 13), central (sites 5, 10, 14, 15, 16, 17, and 18), and south (sites 1, 2, 3, 4, 9, 19, and 20) (Table S1). This classification was based on the relative position of sites within the urban landscape, using satellite imagery and field mapping. These groupings supported the interpretation of spatial trends in carbon and nitrogen accumulation and isotopic composition.
Plant material. For this study, we selected Tillandsia schiedeana due to its abundance and wide distribution in the study area, its atmospheric habit, and its CAM photosynthesis (Espejo-Serna et al. 2004). In February 2024, we collected five healthy, newly formed, and fully developed leaves from five T. schiedeana individuals at each of the 20 sampling sites. These leaves can be visually differentiated from those that grew in previous years to ensure that all samples had comparable physiological age and condition, minimizing variations in nutrient content due to leaf age rather than environmental factors. All samples were collected from the lower canopy of host trees at heights ranging from two to four meters. The identity of the host trees was not recorded because it was not a variable of interest in this study, although the plants grew on different host species.
Elemental and isotopic analyses. The plant material was dried at 60 ºC in a gravity convection oven until a constant weight was reached (Díaz-Álvarez & de la Barrera 2019). The dried tissues were ground to a fine powder in a ball mill, packed in tin capsules and weighed with a microbalance (resolution of 0.01 mg, Sartorius, Goettingen, Germany). For each sample, the carbon and nitrogen content, as well as the corresponding isotopic composition, were determined at the University of Wyoming Stable Isotope Facility (Laramie, WY, USA). Analyses were performed using a Costech 4010 elemental analyzer (Costech Analytical Inc., Valencia, CA, USA) attached to a continuous-flow isotope ratio mass spectrometer (Finnigan Delta Plus XP, Thermo Electron Corp,Waltham, MA, USA). Carbon and nitrogen isotope ratios, expressed in parts per thousand, were calculated relative to Vienna Pee Dee Belemnite (V-PDB) or atmospheric air using glutamic acid and alfalfa as secondary standards (accessions: 36-UWSIF-Glutamic 1, 39-UWSIF-Glutamic 2, and UWSIF05). The natural abundances of 13C and 15N were calculated as follows:
where, R is the ratio of 13C/12C for C and 15N/14N for N isotope abundance for a given sample (Evans et al. 2001).
Statistical analysis. The data were not normally distributed (Shapiro-Wilk tests), therefore, the differences between sites for the carbon and nitrogen content (% dry weight), the C:N ratio, δ13C and δ15N values, were determined with the Kruskal-Wallis test followed by Dunn’s post hoc test for multiple comparisons (P≤0.05). Comparisons between categories (urban vs. peri-urban) were analyzed using the Mann-Whitney U test, and to assess the magnitude of the differences the Cliff’s delta test was used. The rural category was excluded from category comparisons because it only included one site. Comparisons among regions were conducted using the Kruskal-Wallis test. All analyses were conducted in R (R Core Team R 2024) using the packages dunn.test for multiple comparisons (Dinno 2024), and effect size estimation (Torchiano 2020).
Geostatistical Analysis. We conducted spatial interpolation of carbon, nitrogen content, δ13C and δ15N values using ordinary kriging in ArcGIS 10.5 (ESRI, Redlands, CA, USA). Ordinary kriging is an exploratory tool to visualize general spatial trends, and the resulting maps should be regarded as exploratory visualizations rather than high-resolution predictive surfaces. This method assumes spatial autocorrelation, which is a common feature of air pollutants due to localized emission sources that influence plant responses (Cressie 1988, Wang et al. 2002, Stevens et al. 2004, Wong et al. 2004, Díaz-Álvarez et al. 2018). Although more advanced interpolation techniques exist, ordinary kriging remains widely used in environmental studies, including those addressing atmospheric pollution. It is effective even in relatively small datasets (Liao & Zhang 2018, Gupta et al. 2018, Gómez-Losada et al. 2019, Huang et al. 2020). For this analysis, no altitude correction was applied to the measured values prior to interpolation. Instead, altitude was considered part of the environmental variability that influences pollutant deposition and plant physiology across the region.
Results
Carbon and nitrogen content, and C:N ratio. The mean C content for Tillandsia schiedeana (dry weight) for the 20 sites in Xalapa was 43.9±0.24 %. The lowest value (40.1±0.75 %) was found at site 14, which is in the central part of Xalapa in an area with dense urban infrastructure and heavy traffic. However, site 18, also situated in the city center and similarly exposed to intense vehicular activity, had the highest carbon content (46.9±1.12 %). Statistically differences were observed among sites (P≤0.05; Table 1; Figure 2).
Table 1 Kruskal-Wallis for differences among 20 sites for the carbon and nitrogen content (% dry weight), the C:N ratio, as well as for the δ13C and δ15N values for Tillandsia schiedeana in Xalapa, Mexico.
| Parameter | d.f. | Chi-Square | P-value |
|---|---|---|---|
| Carbon content | 19 | 37.675 | 0.006527 |
| Nitrogen content | 19 | 79.655 | 2.132e-09 |
| C:N ratio | 19 | 78.814 | 2.974e-09 |
| δ13C %o | 19 | 52.719 | 5.16e-05 |
| δ15N %% | 19 | 83.047 | 5.518e-10 |
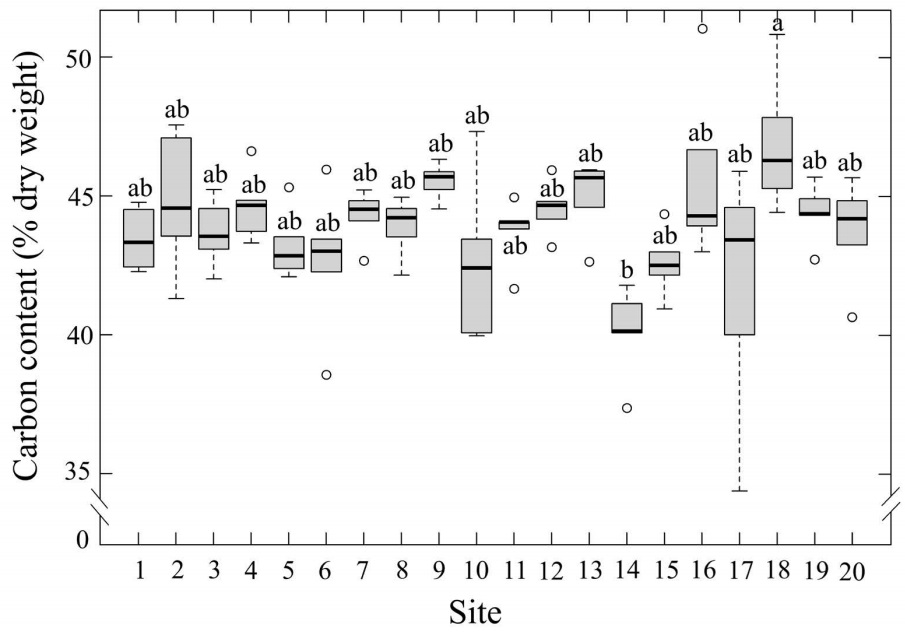
Figure 2 Leaf carbon content (% dry weight) of Tillandsia schiedeana across the Metropolitan Area of Xalapa, Mexico, grouped by urbanization category. Boxes represent the interquartile range (IQR), horizontal lines within boxes indicate medians, and whiskers extend to 1.5×IQR. Shaded areas correspond to the range of values within each category, open circles denote site means (n = 20), and error bars represent standard error.
The average nitrogen content of T. schiedeana was 1.3±0.04 % (dry weight). Statistical differences among sites were observed (P≤0.05; Table 1; Figure 3). The lowest value was 0.79±0.04 % at site 19, which is located in a rural area with low nitrogen emissions. In contrast, the highest content of 2.1±0.07 % was found at site 8, which is part of the north region of the metropolitan area. Site 14, also exposed to intense traffic in the city center, exhibited a relatively low nitrogen content of 0.87±0.04 %.
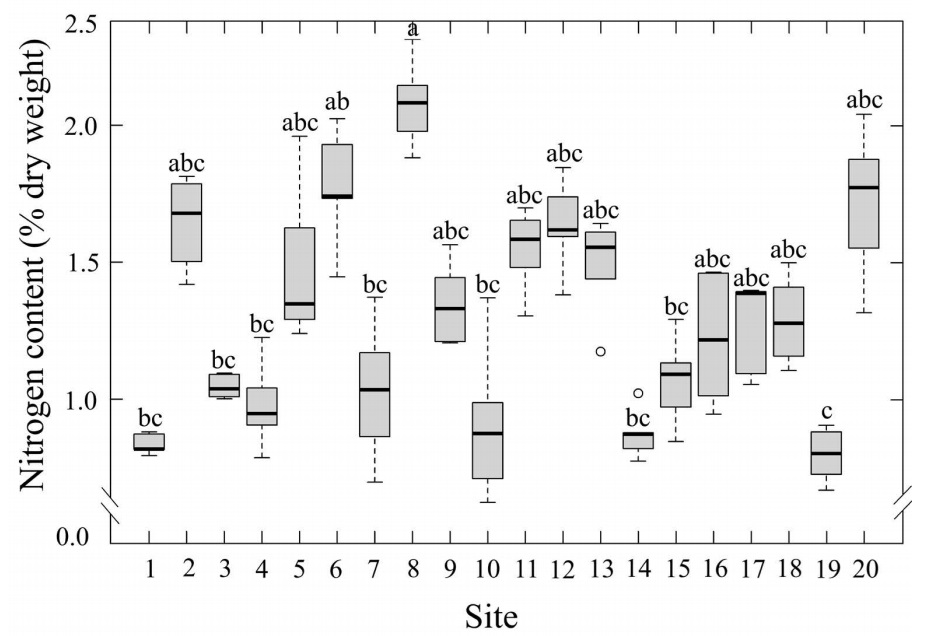
Figure 3 Leaf nitrogen content (% dry weight) of Tillandsia schiedeana across the Metropolitan Area of Xalapa, Mexico, grouped by urbanization category. Boxes represent the interquartile range (IQR), horizontal lines within boxes indicate medians, and whiskers extend to 1.5×IQR. Shaded areas correspond to the range of values within each category, open circles denote site means (n = 20), and error bars represent standard error.
The average C:N ratio was 36.9±1.13. The lowest value of 21.2±0.83, was found on Site 8. The highest ratio, 56.4±2.76, was found at site 19 (Figure 4), which is in a rural area. Significant differences among sites were registered (Table 1).
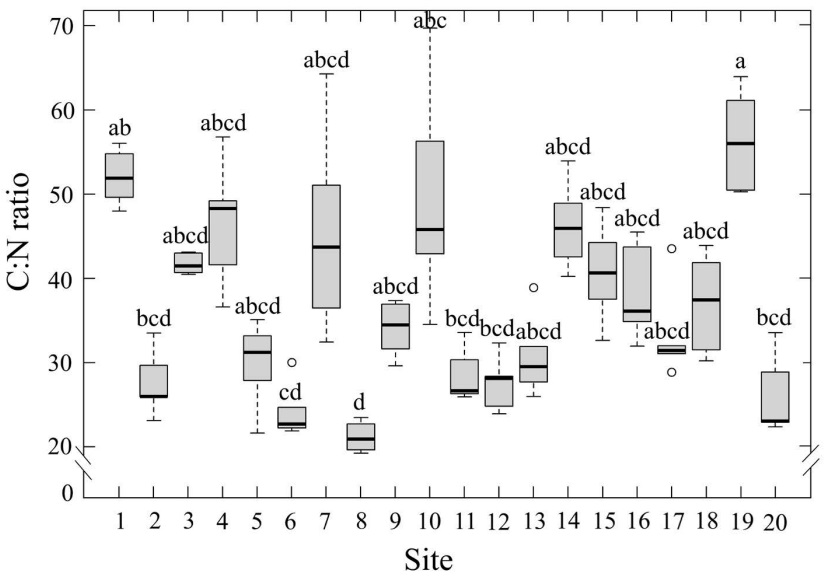
Figure 4 Leaf C:N ratio of Tillandsia schiedeana across the Metropolitan Area of Xalapa, Mexico, grouped by urbanization category. Boxes represent the interquartile range (IQR), horizontal lines within boxes indicate medians, and whiskers extend to 1.5×IQR. Shaded areas correspond to the range of values within each category, open circles denote site means (n = 20), and error bars represent standard error.
Carbon and nitrogen isotopic composition. The average δ13C value for T. schiedeana was -14.9 ± 0.05‰. The most negative value recorded at Site 2 was -15.77±0.36‰, located in the south portion of the metropolitan Xalapa area. The highest value was observed at site 10 (-14.3±0.15‰),situated in the central area of Xalapa. Statistically differences were found among sites (P≤0.05; Table 1; Figure 5). Most sites showed intermediate values between -14.5 and -15.5‰, with no clear spatial gradient.
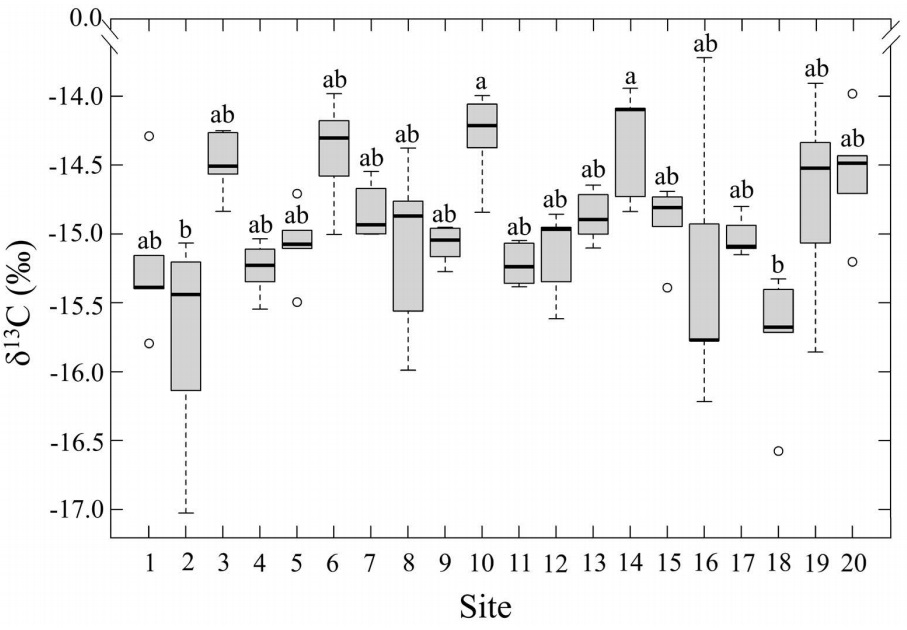
Figure 5 Leaf δ13C (‰) of Tillandsia schiedeana across the Metropolitan Area of Xalapa, Mexico, grouped by urbanization category. Boxes represent the interquartile range (IQR), horizontal lines within boxes indicate medians, and whiskers extend to 1.5×IQR. Shaded areas correspond to the range of values within each category, open circles denote site means (n = 20), and error bars represent standard error.
The average δ15N values was -4.5±0.33‰. The most negative value of -10.4±0.73‰ was recorded at Site 19, which is in the south rural area of the study region. On the contrary, the most positive value was found at Site 20 (1.72±0.09‰),located in Coatepec’s downtown. Statistically differences were observed among sites (P≤ 0.05; Table 1; Figure 6).
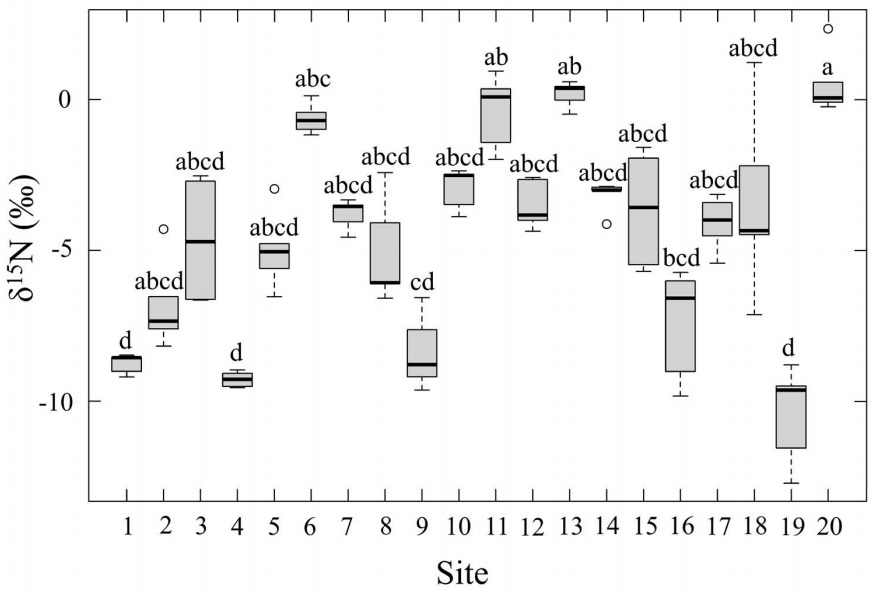
Figure 6 Leaf δ15N(‰) of Tillandsia schiedeana across the Metropolitan Area of Xalapa, Mexico, grouped by urbanization category. Boxes represent the interquartile range (IQR), horizontal lines within boxes indicate medians, and whiskers extend to 1.5×IQR. Shaded areas correspond to the range of values within each category, open circles denote site means (n = 20), and error bars represent standard error.
Spatial distribution overview. Across the study area, the spatial distribution of all measured variables showed apparent geographic trends (Figure 7). Carbon contents tended to be higher in the northern and southern regions, while lower values were observed at some central sites (Figure 7A). However, these differences were not statistically different. Nitrogen content showed apparent variability among sites, with relatively higher values at Xalapa and Coatepec´s downtown (6, 8, 11, 12, 13) and southern locations (2, 20), and lower concentrations at central sites such as 14 (Figure 7B). The δ13C values did not show a clear directional gradient, though slightly more negative values were observed at some southern and downtown sites (Figure 7C). Overall, δ15N values exhibited variability across the region, but without a consistent spatial pattern; both peripheral and urban sites showed negative values (Figure 7D).
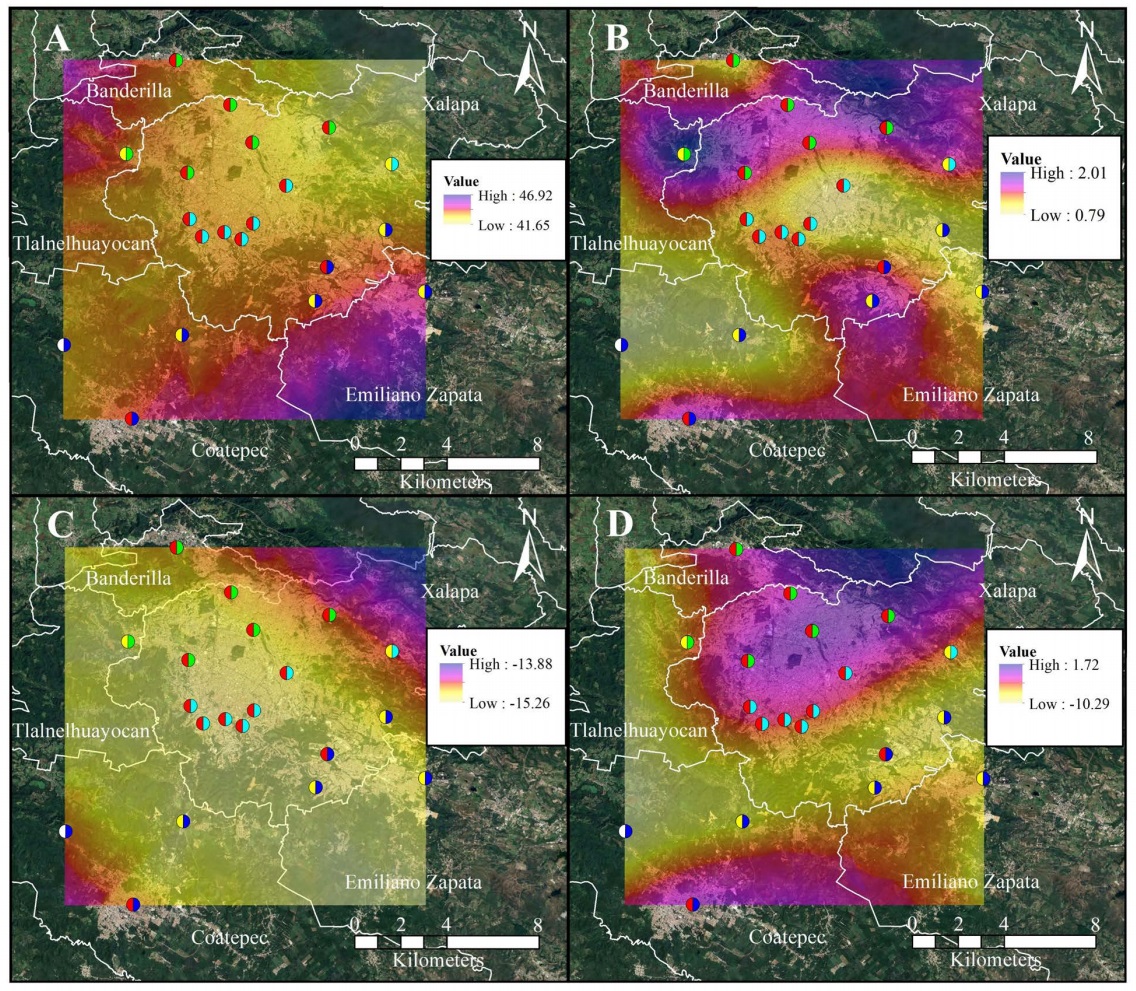
Figure 7 Spatial interpolation of (A) carbon content, (B) nitrogen content, (C) δ13C, and (D) δ15N measured in Tillandsia schiedeana at each sampling site (n = 20). The maps were generated using ordinary kriging based on values obtained directly from plant tissue collected at the 20 sites. Sampling sites are shown with the same color code as in Figure 1 (urban = red; peri-urban = yellow; rural = white; north = green; center = light blue; south = blue). See Figures 2-6 for site-specific values.
Only foliar δ15N differed significantly between urban and peri-urban sites (Mann-Whitney U = 70.0, P = 0.0047; Cliff’s δ= 0.80; Table 2). In contrast, carbon and nitrogen content, C:N ratio, and δ13C did not differ between categories (P > 0.05). Similarly, comparisons among regions (north, center, south) revealed no significant differences for any variable (Kruskal-Wallis, P > 0.05; Table 2), indicating no broad-scale geographic gradient.
Table 2 Statistical comparisons of carbon, nitrogen, C:N ratio, and the isotopic values δ13C, δ15N for Tillandsia schiedeana between site categories (urban vs. peri-urban) and among regions (north, center, and south) in the Xalapa metropolitan area. Mann-Whitney U tests include Cliff’s delta (δ) as the effect size. Kruskal-Wallis tests were used for regional comparisons.
| Regional comparisons | ||||||
|---|---|---|---|---|---|---|
| Variable | Test | Comparison | n (group 1 / group 2) |
Statistic | P-value | Cliff's δ |
| C | Mann-Whitney U | Urban vs. Peri-urban | 13 / 6 | 38.0 | 0.9661 | -0.026 |
| N | Mann-Whitney U | Urban vs. Peri-urban | 13 / 6 | 40.0 | 0.9661 | 0.026 |
| C:N | Mann-Whitney U | Urban vs. Peri-urban | 13 / 6 | 37.0 | 0.8983 | -0.051 |
| δ13C | Mann-Whitney U | Urban vs. Peri-urban | 13 / 6 | 54.0 | 0.2100 | 0.385 |
| δ15N | Mann-Whitney U | Urban vs. Peri-urban | 13 / 6 | 70.0 | 0.0047 | 0.795 |
| Site category comparisons | ||||||
| C | Kruskal-Wallis | North (n = 6), Center (n = 7), South (n = 7) | 一 | 2.2061 | 0.3319 | 一 |
| N | Kruskal-Wallis | North (n = 6), Center (n = 7), South (n = 7) | ― | 4.6170 | 0.0994 | ― |
| C:N | Kruskal-Wallis | North (n = 6), Center (n = 7), South (n = 7) | 一 | 4.9592 | 0.0838 | ― |
| δ13C | Kruskal-Wallis | North (n = 6), Center (n = 7), South (n = 7) | ― | 0.1925 | 0.9082 | ― |
| δ15N | Kruskal-Wallis | North (n = 6), Center (n = 7), South (n = 7) | ― | 5.7925 | 0.0552 | ― |
Discussion
Carbon content is a central trait in biomonitoring studies because it reflects the balance between carbon fixation and photorespiration, processes influenced by environmental drivers such as water availability, solar radiation, temperature, and atmospheric CO2 concentration (Paul & Pellny 2003, Flexas et al. 2006, Chen et al. 2009). This aspect is especially relevant in regions like Xalapa, where gradients in elevation, urbanization, and human activity shape local conditions (Soto-Esparza & Gómez-Columna 1993, Lemoine-Rodríguez et al. 2019). Our results showed that carbon content only had slight variation among sites, and all values fell within the expected range of 40-50 % (dry weight) for Tillandsia species (Ma et al. 2018, Díaz-Álvarez & de la Barrera 2020, Tirado-Zamora et al. 2025). These results suggest that T. schiedeana maintained normal physiological function across the study area and that carbon content did not signal strong environmental stress. Instead, its consistency suggests that C content is a useful baseline parameter, which reinforces its role in biomonitoring frameworks (Tirado-Zamora et al. 2025).
Nitrogen content in plants is strongly influenced by atmospheric pollution, a factor particularly important for epiphytes such as bromeliads that rely almost entirely on atmospheric inputs (Díaz-Álvarez et al. 2018). As reactive nitrogen increases, plants accumulate it, making tissue values useful indicators of deposition patterns (Martínez et al. 2021). For instance, in the Valley of Mexico, Tillandsia recurvata shows nitrogen contents from 0.8 % in rural sites to 3.6 % in heavily polluted zones (Díaz-Álvarez & de la Barrera 2018). In our study, nitrogen values varied only moderately among sites but still suggested spatial contrasts across Xalapa. Kriging maps illustrated these tendencies, but they are only exploratory visualizations. Even so, comparisons between site categories and among regions showed no significant differences, suggesting that variability within categories equaled or exceeded differences between them. Unmeasured local conditions, such as airflow, vegetation cover, or urban structure may also shape these patterns (Jacob & Winner 2009, Lin et al. 2020, Lindén et al. 2023). Taken together, these findings indicate that nitrogen content in T. schiedeana reflects moderate deposition in Xalapa but without the clear spatial gradients often reported in larger metropolitan areas.
The carbon isotopic composition of CAM epiphytic bromeliads responds both to environmental conditions and to CO2 emissions from urban activity (Zambrano García et al. 2009, Díaz-Álvarez & de la Barrera 2020). Atmospheric δ13C varies according to its source: in natural environments without combustion, values are typically around -8‰, while in cities dominated by industrial and vehicular emissions they can drop to -42‰ (Pataki et al. 2003, Widory & Javoy 2003, Naus et al. 2018). CAM epiphytes reflect these contrasts, generally showing fewer negative values in rural areas (around -14‰) and more negative ones in densely urbanized sites (down to -17.5‰ ,Díaz-Álvarez & de la Barrera 2020). In Xalapa, δ¹³C values for T. schiedeana ranged from -15.8 to -14.3‰, with a mean near -15‰ across the 20 sites. These results fall within the expected range for CAM bromeliads in moderately urbanized settings, indicating that local atmospheric CO2 is shaped by anthropogenic inputs but not at the extreme levels documented in larger metropolitan areas (cf. Díaz-Álvarez & de la Barrera 2020). Although variability among sites was present, it remained limited to specific areas.
Overall, the slight variability in δ13C values of T. schiedeana suggests that the isotopic composition of atmospheric CO2 in Xalapa is relatively uniform. However, a few sites exhibited contrasting values that were not clearly associated with vegetation cover or urban structure. For example, sites 10 and 18 are geographically close yet displayed different values, a discrepancy that may reflect local traffic conditions or microtopography influencing pollutant dispersion (Giovannini et al. 2020). This interpretation remains speculative, as no microclimatic or traffic data were collected. Physiological factors may also contribute to CAM plants, the balance between nocturnal fixation by PEPc and diurnal fixation by Rubisco can shape tissue isotopic signatures (Winter & Holtum 2002, Wild et al. 2010). These mechanisms may explain the subtle differences observed at the site level under otherwise similar atmospheric conditions. Nevertheless, the relatively stable temperature and humidity in Xalapa (Tirado-Zamora et al. 2025) make major physiological shifts unlikely. Overall, the results suggest that T. schiedeana effectively records anthropogenic CO2 inputs but provides limited resolution of fine-scale spatial variation in moderately polluted settings, such as Xalapa downtown. This contrasts with megacities, including Mexico City, where isotopic gradients are more pronounced (Díaz-Álvarez & de la Barrera 2018).
Foliar δ15N values provide important information about sources of nitrogen pollution, which is especially relevant for epiphytic species that almost depend entirely on atmospheric inputs (Díaz-Álvarez et al. 2018). In relatively pristine environments with little nitrogen pollution, δ15N values are typically negative but close to zero. In contrast, emissions from agriculture and livestock, which are dominated by volatilized NH3 and airborne NH4 +, often result in negative δ15N values in plants (Stewart et al. 2002). Conversely, when fossil fuel combustion is the main source, NOₓ emissions typically generate positive δ15N values. This pattern has been reported in mosses, grasses, and vascular epiphytes, including bromeliads such as Tillandsia recurvata which grow near urban roads or in major metropolitan areas such as Mexico City, Los Angeles, and London (Pearson et al. 2000, Wang & Pataki 2010, Díaz-Álvarez & de la Barrera 2018, 2021). In such contexts, the isotopic composition of plant tissues can closely reflect the dominant atmospheric nitrogen source.
In our study, most sites in Xalapa showed negative δ15N values, including many urban locations, with only two urban sites presenting positive signatures. This pattern suggests that NOₓ is not the primary nitrogen source in the city, unlike what is commonly observed in large metropolitan areas. Likely contributors are peri-urban agricultural activities, such as extensive sugarcane cultivation and seasonal residue burning, which can generate mixed nitrogen inputs and obscure the isotopic signature of urban NOₓ emissions (Takeda et al. 2021, Gobierno de México 2024). Geographic and environmental features may also play a role, for example, Xalapa’s mountainous setting and coastal proximity potentially influence airflow and pollutant dispersion, while urban green areas may further alter transport and deposition processes (Jacob & Winner 2009, Lindén et al. 2023). However, because atmospheric δ15N was not directly measured in this study, the correspondence between foliar and air values must be inferred from existing literature and should be interpreted cautiously.
Although Tillandsia schiedeana showed consistent responses to atmospheric pollution across sites, the subtle spatial heterogeneity observed in δ13C, δ15N, and tissue C and N content likely reflects the interaction of multiple factors rather than clear large-scale gradients. Meteorological processes and local conditions such as topography, urban structure, vegetation, and traffic, could shape these patterns (Gómez-Losada et al. 2019, Zhou et al. 2020, Yang et al. 2022). Additionally, peri-urban agricultural practices, including fertilizer use and sugarcane residue burning, may also contribute additional nitrogen inputs (Díaz-Álvarez & de la Barrera 2018, Takeda et al. 2021), while urban green spaces can alter airflow and filter particulates (Lindén et al. 2023). These factors were not quantified here because the study was exploratory and aimed to evaluate the suitability of T. schiedeana as a biomonitor rather than modelling environmental drivers. Their specific effects can only be inferred qualitatively from our data, but they are likely to contribute to the observed spatial variability. For this reason, our findings are best interpreted as integrative indicators of pollution distribution, consistent with the established role of epiphytes in biomonitoring studies.
In conclusion, Tillandsia schiedeana emerges as a valuable coarse-scale biomonitor of urban reactive-nitrogen inputs. In Xalapa, foliar δ15N distinguished urban from peri-urban sites, while total C, total N, C:N, and δ13C remained spatially uniform at the scale of our sampling. It is important to note that foliar δ15N does not equal atmospheric δ15N; rather, it integrates mixtures of reactive nitrogen sources along with deposition and uptake processes. Thus, T. schiedeana captures atmospheric inputs but should not be interpreted as a direct proxy of ambient isotopic values. To detect finer spatial patterns will require complementary strategies, including additional biomonitors, direct atmospheric or meteorological measurements, and spatial modeling, ideally with co-located plant-air-deposition data to establish a local calibration for Xalapa.
Supplementary material
Supplemental data for this article can be accessed here: https://doi.org/10.17129/botsci.3817

