


 nueva página del texto (beta)
 Inglés (pdf)
 Artículo en XML
 Referencias del artículo
 Enviar artículo por email
 Citado por SciELO
  Similares en
SciELO
Similares en
SciELO 
 Permalink
The occurrence and distribution of a given vegetation type in a region are mainly driven by the prevailing macroclimate (Ooi et al. 2017). For example, whereas some regions of the world receive abundant rainfall every year and thus enjoy a benign climate humidity-wise, other regions are fraught with unfavorable environmental conditions, such as scant precipitation or extremely low or high temperatures that limit the establishment and survival of many species. Globally, the Tropical Rainforest (hereafter TRF) is a favored vegetation type because it is free from any water or temperature stress (Beard 1955).
The TRF is a complex ecosystem renowned for its large diversity of plant species, which efficiently utilize available resources to produce substantial amounts of biomass (Lal & Kimble 2019). Worryingly, TRF is one of the most threatened ecosystems by human activities (Achard et al. 2002) despite its fundamental ecosystem function. For example, in Mexico, TRF transformation into anthropic ecosystems has taken them to the verge of extinction (Challenger 1998), a process that greatly accelerated in the 1960s and 1970s due to colonization campaigns promoted by Mexico's Federal Government that resulted in the clearing of large expanses of tropical forests. The consequences of these governmental programs were catastrophic. For instance, by the early 1980s, the Los Tuxtlas region in Veracruz state had already lost more than 80 % of its original forest (Dirzo & García 1992), and Tabasco state, originally covered almost entirely by tropical rainforests, wetlands, and savannas, had lost nearly 90 % of its native vegetation by 2010 (Maldonado-Sánchez & Maldonado-Mares 2010).
TRF is probably the most prominent vegetation type among the various plant formations within the Humid Tropical Forests biome (the Humid Tropical Biome sensuVillaseñor & Ortiz 2014). This vegetation type, also known in Mexico as Tropical Evergreen Forest (Breedlove 1973), Selva Alta Perennifolia (Miranda & Hernández-X. 1963), or Bosque Tropical Perennifolio (Rzedowski 1978), cannot be readily distinguished from the Semi-Evergreen Medium-Height Forest (Selva Mediana Subperennifolia after Miranda & Hernández-X. (1963) or the Bosque Tropical Subperennifolio after Rzedowski (1978). Very few studies have systematically compared them, making it difficult to accurately pinpoint their structural and compositional differences (e.g.,Martínez-Sánchez 2016).
Unlike other forest communities (for example, boreal and most temperate forests), where dominance concentrates on one or a few species, synecological studies have shown that numerous species share dominance in most TRFs so that no single species displays dominance in the community. This situation was aptly depicted by Richards (1973), who stated that in a pristine forest, one often needs to walk a long way before encountering one more individual of the same species. Paul W. Richards is considered the pioneer in the study of this vegetation type worldwide (Rzedowski 1978); for Mexico, Pennington & Sarukhán (1968, 2005) and Rzedowski (1978) described the main characteristics that help recognize a TRF in the field. According to them, TRF is a plant community dominated by trees (the tallest ones exceeding 30 m), often having large buttresses and branching at a considerable height above the ground. Trees in these forests support numerous epiphytic and climbing plants (especially lianas), and they do not shed all their leaves at the same time, and leaves may last for several years (thus "evergreen"). A further TRF characteristic is a complex vertical community structure (Popma et al. 1988) that, for practical reasons is often described through the distinction of various strata (stories) in its canopy; generally, three or four strata are identified; the upper layer (upper canopy) is the most conspicuous TRF component, with direct exposure to the sun; by contrast, the lowest layer (undergrowth or understory) is generally poorly illuminated and exhibits relatively constant humidity and temperature conditions.
The northern limit of the TRF continental distribution in the Americas is located in southern Mexico (Rzedowski 1963, 1978). Despite earlier reports of its presence in the Huasteca region (SE San Luis Potosí and N Veracruz) (Rzedowski 1963, Puig 1976), at present, virtually no fragments of primary vegetation remain in that region (Dirzo & Miranda 1991, Leija-Loredo & Pavón 2017); thus, the northernmost locations of primary TRF in Mexico are currently located in the Los Tuxtlas region of Veracruz (Dirzo & García 1992) and the Chinantla region of northern Oaxaca (Meave et al. 2017).
The floristic knowledge of Mexican TRF has been documented in a fragmentary fashion through several inventories across the Mexican wet tropics (Table 1); despite these efforts, however, we still lack a nationwide comprehensive inventory that represents its entire floristic richness. This knowledge gap is an obstacle to our understanding of the distribution patterns of such richness and, consequently, hinders the possibility of designing a national conservation strategy for this highly threatened vegetation type. For this reason, this study aims to retrieve, collate, and synthesize as much information as possible on the floristic diversity of the Mexican TRF that is currently stored in the literature and in public databases that document collection episodes in TRF localities in the country.
Table 1 Examples of floristic inventories for Mexican sites where Tropical Rainforest is the prevailing vegetation.
| State | Author | Locality |
|---|---|---|
| Campeche | Martínez et al. (2001) | Calakmul region |
| Chiapas | Durán-Fernández et al. (2016) | Nahá Lacandon Community |
| Gómez-Domínguez et al. (2015) | Palenque National Park | |
| Jiménez-López et al. (2023) | Usumacinta River Basin | |
| Martínez et al. (1994) | The Lacandon region | |
| Martínez-Camilo et al. (2019) | Tacaná-Boquerón Priority Terrestrial Region | |
| Meave del Castillo (1990) | Bonampak Natural Monument | |
| Meave et al. (2008) | Yaxchilán Natural Monument | |
| Oaxaca | Meave et al. (2017) | La Chinantla region |
| San Luis Potosí | Alcorn (1984) | La Huasteca region |
| Tabasco | López-Jiménez et al. (2020) | Pantanos de Centla Biosphere Reserve |
| Vázquez-Negrín et al. (2011) | Niños Héroes Ejido, Tenosique | |
| Veracruz | Burgos-Hernández & Castillo-Campos (2018) | North-central Veracruz state |
| Francisco-de la Cruz et al. (2017) | Alamo Temapache Municipio | |
| Márquez et al. (1981) | Uxpanapa river region | |
| Villaseñor et al. (2018) | Los Tuxtlas region |
Integrating information from bibliographic sources with records of specimens kept in herbaria databases has proved highly relevant to other studies (for example, Villaseñor et al. 2018, 2022, 2023, Jiménez-López et al. 2023). The literature documents the presence of a set of species, some of which are absent from the databases; likewise, the databases contain records of species not reported in publications. Therefore, these sources of information supplement each other and are of great value to producing the most complete floristic inventories possible. Once a comprehensive species checklist is integrated, different biogeographic, diversity, or conservation analyses can be performed.
Materials and methods
Tropical rainforest geographic delimitation. Due to the uncertainty in representing the limits between the Tropical Rainforest (TRF) and other related vegetation types, especially the Sub-Evergreen Tropical Forest, three methodological approaches were used to achieve its geographical delimitation.
Tropical Rainforest delimitation based on the vegetation types and land use of INEGI (the Mexican National Institute of Statistics and Geography).- To differentiate the TRF from similar tropical forests (for example, the Sub-Evergreen Tropical Forest), INEGI's Land Use and Vegetation Map, series VII, was first used (INEGI 2021). Most of the 183 land use or vegetation classes differentiated on the map could be associated with Rzedowski’s (1978) 10 vegetation types (Table 2 shows the INEGI classes assigned to the TRF). Some polygons devoid of vegetation, i.e. urban or cultivated areas, could not be directly assigned to any potential vegetation type. Thus, to assign them to their most likely corresponding potential vegetation category, Thiessen polygons (Brassel & Reif 1979) were created for all polygons with potential vegetation. Next, the polygons without vegetation were associated with the vegetation of the Thiessen polygons closest to them (Figure 1A). Thiessen polygons are one of the simplest spatial interpolation methods (Tan & Xu 2014), through which areas of unknown values are assigned the value of the closest known area. In ArcGis v. 10.5 (ESRI 2013), interpolation was carried out using Thiessen polygons of the series VII, previously equated with the vegetation types of Rzedowski (1978), and thus use a single classification system (Figure 1A).
Table 2 Plant communities represented on INEGI's land use and vegetation map (2021) assigned to the Tropical Rainforest vegetation type (sensuRzedowski 1978).
| Plant community |
|---|
| Selva Alta Perennifolia (Evergreen High Forest) |
| Selva Alta Subperennifolia (Semi-evergreen High Forest) |
| Vegetación secundaria arbórea de Selva Alta Perennifolia (Tree-dominated second growth of High Evergreen Forest) |
| Vegetación secundaria arbórea de Selva Alta Subperennifolia (Tree-dominated second growth of High Semi-evergreen Forest) |
| Vegetación secundaria arbustiva de Selva Alta Perennifolia (Shrub-dominated second growth of High Evergreen Forest |
| Vegetación secundaria arbustiva de Selva Alta Subperennifolia (Shrub-dominated second growth of High Semi-Evergreen Forest) |
| Vegetación secundaria herbácea de Selva Alta Perennifolia (Herb-dominated second growth of High Evergreen Forest) |
| Vegetación secundaria herbácea de Selva Alta Subperennifolia (Herb-dominated second growthof High Semi-evergreen Forest) |
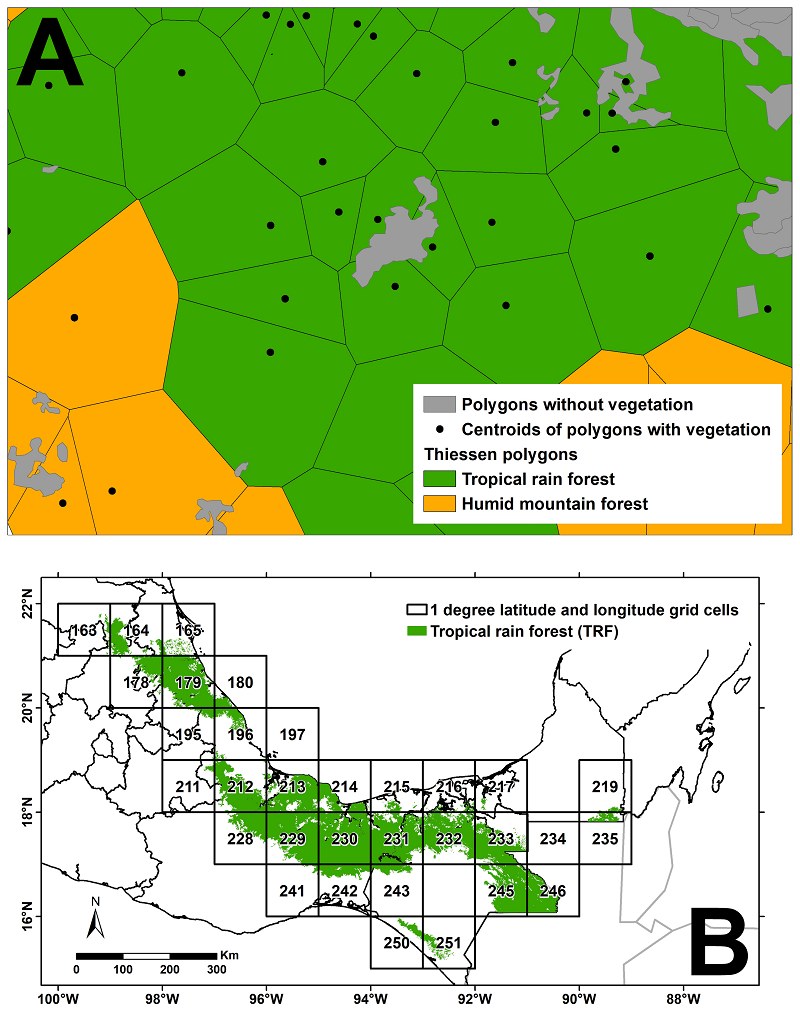
Figure 1 A. Interpolation of vegetation types using Thiessen polygons. The centroids correspond to those polygons on the Land Use and Vegetation map, series VII (INEGI 2021) that could be equated to the vegetation types of Rzedowski (1978). The result of the interpolation are the Thiessen polygons. Those polygons without vegetation in series VII were assigned the corresponding value of their nearest neighboring Thiessen polygon. B. Distribution of Tropical Rainforest in Mexico based on the analytical strategy described in A. The numbering of the grid cells in B corresponds to the numbering used in the diversity analyses described in the text.
Ombrotypes and the Tropical Rainforest (TRF) delimitation.- The climate is one of the main factors influencing plant species distributions and the vegetation types or biomes in which they occur (Gopar-Merino et al. 2022 and references therein). When the climate of a particular region is determined and related to the ecosystems occurring there, the so-called bioclimates are obtained (Rivas-Martínez et al. 2011). Each bioclimate is characterized by an Ombrothermal Index (OI), which relates total annual precipitation and mean annual temperature to establish a relationship between vegetation and climate. Several formulae have been proposed to calculate an OI; in this work, the formula proposed by Rivas-Martínez (1994) was used, which requires data on accumulated monthly precipitation and the mean monthly temperature of a site. This index provides a general idea of the distribution of a vegetation type based on climatic characteristics and produces a bioclimatic classification of the region.
To calculate the OI, the monthly mean temperature and total annual precipitation (Pp) data for Mexico were downloaded from the WorldClim 2 website (Fick & Hijmans 2017) at a resolution of 30 arc seconds (approximately 1 km at the Equator). With the monthly temperature data, the annual positive temperature (Tp) was calculated as the sum of the monthly mean temperatures of those months with temperatures higher than 0° C; its value is expressed in tenths of degrees Celsius (Rivas-Martínez 1994). Subsequently, the OI was calculated with the following equation (Rivas-Martínez 1994):
Ombrotype classification was achieved using OI values according to Chacón-Moreno & Suárez del Moral's classification (2020); Table 3). These calculations were done in ArcGIS 10.5 (ESRI 2013).
Table 3 Ombrotype classification according to their ombrothermal index (OI). The Tropical Rainforest was delimited considering those pixels in Mexico with OI > 6 (Humid, Hyper-humid, and Ultrahyper-humid ombrotypes.
| Ombrothermal Index | Ombrotype |
|---|---|
| 0-0.2 | Ultra-hyperarid |
| 0.2-0.4 | Hyper-arid |
| 0.4-1.0 | Arid |
| 1.0-2.0 | Semiarid |
| 2.0-3.6 | Dry |
| 3.6-6.0 | Subhumid |
| 6.0-12.0 | Humid |
| 12.0-24.0 | Hyper-humid |
| ≥ 24.0 | Ultrahyper-humid |
Altitudinal distribution of the TRF in Mexico.- Multiple sites within the humid ombrotype are in different regions of the country, suggesting the presence of some kind of tropical forest (Figure 2). To determine with greater precision the TRF geographic limits, an analysis of the altitudinal distribution of TRF species in Mexico was conducted using a digital elevation model obtained from the Worldclim 2 website (www.worldclim.org/data/worldclim21.html) at a resolution of 30 arc seconds. All georeferenced records in our database were overlapped with this digital model to determine the elevation for each record; with these data, we used ArcGIS 10.5 (ESRI 2013) to calculate zonal statistics to obtain the mean, minimum, maximum, and standard deviation of the elevation records within the TRF polygon created with the Thiessen polygons (Figure 1B). For each TRF species, the majority method was applied (Murphy et al. 2019), which requires the species to meet two criteria: (1) at least 50 % of their records need to fall within the TRF polygon (Figure 1B), and (2) 50 % of these records should have a maximum elevation of 1,000 m. These criteria corresponded to the mean plus two standard deviations of all records analyzed. For example, Terminalia amazonia (J.G. Gmel.) Exell (Combretaceae) had in the database 115 unique records, 90.6 % of which were located within the TRF polygon and 97.8 % were collected at elevations < 1,000 m; together, these percentages allowed us to confidently classify this as a TRF characteristic species. Conversely, Cascabela thevetia (L.) Lippold had 49 unique records quoting TRF as vegetation type in the collecting site, but only 33 % of them were located within the TRF polygon (although 48 records were collected at elevations < 1,000 m); thus, this species was discarded as a characteristic species of this vegetation type.
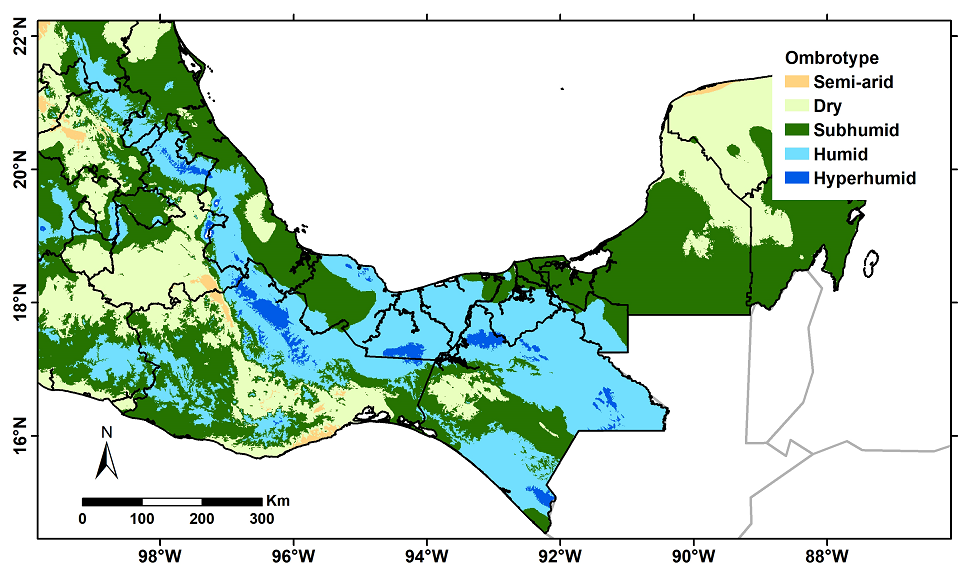
Figure 2 Ombrotypes distribution in Mexico. The Tropical Rainforest (TRF) is constrained to the humid, hyper-humid, and ultra hyper-humid ombrotypes.
Species inventory. To compile the species list occurring in the Mexican TRF, an intense, albeit not exhaustive, literature review was carried out. Numerous ecological studies have examined the structure and composition of TRF fragments, but few of them have attempted to produce a complete inventory of the local flora (e.g.,Meave del Castillo 1990), and thus, most of them were discarded. Table 1 shows a list of selected inventories reviewed to create a literature-derived checklist of TRF species. This literature review allowed us to produce a list of 5,229 species.
The second source of information was the species records from the TRF kept in the two most important online data banks that deal with Mexico’s floristic diversity. The first one is the National Biodiversity Information System (SNIB) of the National Commission for the Knowledge and Use of Biodiversity (CONABIO: www.conabio.gob.mx), and the second one is the database from the scientific collections kept at the Institute of Biology, National Autonomous University of Mexico (UNAM) (IBData; www.ibdata4.ib.unam.mx). The records obtained for species in the TRF from both databases were reorganized into a database built specifically for this study in a relational database management system (Microsoft Access®). Inconsistencies in these data, such as records doubtfully assigned to the TRF, obvious georeferencing errors and georeferencing records lacking coordinates, cases of synonymy, etc., were corrected or updated. The nomenclature used follows the criteria of Villaseñor (2016), updated according to the Plants of the World Online website (POWO: powo.science.kew.org) with some amendments and additions (Villaseñor & Meave 2022, Villaseñor, unpublished data). Based on the review of this database, we produced a list of 8,269 species.
Floristic regions among grid cells with tropical rainforest. Different analytical processes may assess floristic similarities/dissimilarities between regions or geographical units. For example, Kreft & Jetz (2010) proposed one that combines beta diversity, agglomerative clustering analysis, and ordination techniques. Here, the first two were applied to determine the turnover pattern of TRF species and identify a potential regionalization for this vegetation type in Mexico.
A database of 4,936 species, combining literature and database information, was constructed; these characteristic species and their occurrences were recorded in a grid network of 26 1° latitude ( 1º longitude cells. This information was uploaded into Biodiverse 4.3 (Laffan et al. 2010) to perform the cluster analysis, which, in addition to showing a dendrogram of the grid cells, allows spatial visualization of species turnover. A matrix of dissimilarity values was built using Simpson's beta index (βSim) to quantify the turnover between each pair of cells. βSim was used to calculate beta diversity (turnover) because it reduces the imbalance in species richness (Tuomisto 2010). The dissimilarity matrix was used to perform an agglomerative clustering analysis with the WPGMA (weighted pair-group method using arithmetic averages) linkage method in Biodiverse (González-Orozco et al. 2013). This analysis allowed us to identify groups of cells with assemblages of similar species that can be considered potential biogeographic regions for the Mexican TRF.
Results
Species richness and endemism in the tropical rainforest of Mexico. After reviewing the literature and applying the filters described in Materials and Methods to the database records to delimit the Mexican TRF, we were able to confirm the presence of TRF in eight states of the country: Campeche, Chiapas, Hidalgo, Oaxaca, Puebla, Quintana Roo, San Luis Potosí, Tabasco, and Veracruz (Figure 1B). In turn, we recorded the presence of this vegetation type in twenty-six 1° latitude ( 1º longitude grid cells coinciding with the geographical range of TRF in Mexico (Figure 1B).
The structured database allowed us to document the existence of 157,646 records from the consulted databases; all these records reported that the species had been collected in TRF or any of its variations considered to create the potential vegetation map of Figure 1B (Table 2). However, the projection of these records on the TRF polygon revealed some records outside this polygon; these were only used to determine the majority rule described in Materials and Methods (N = 42,776 records, Figure 3).
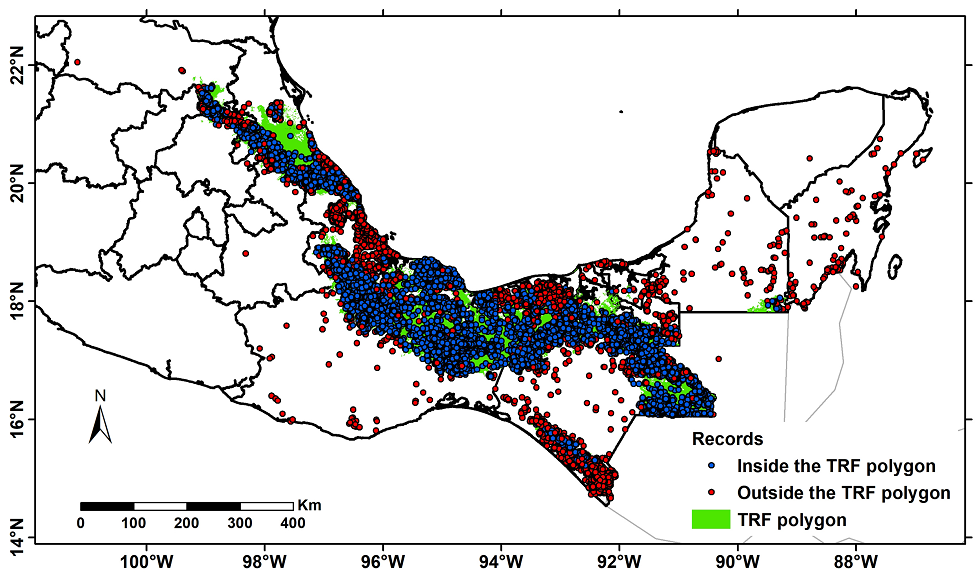
Figure 3 Collection points (N = 157,646) of herbarium specimens that report Tropical Rainforest (TRF) as vegetation type. The blue dots represent sites within the TRF polygon (N = 115,370), and the red dots represent sites outside the TRF polygon (N = 42,276).
Based on the literature review, we produced a list of 5,229 species, while the records in the database represented 8,269 species. The evaluation of the database allowed the detection of 2,629 species with all their records located within the TRF polygon; by contrast, all records for 1,110 species came from areas outside the TRF polygon. Thus, these species were excluded from further analyses. In addition, 4,530 species had records inside and outside the polygon. We calculated a richness of 8,353 species derived from the two sources with these figures. Finally, we applied the majority rule filter to this last number of species (> 50 % of all records inside the TRF polygon) and the altitude filter (records from elevations < 1,000 m), which resulted in a total of 4,936 species characteristic of the Mexican TRF. These species are distributed among 1,505 genera, 239 families, and 69 orders (Table 4, Supplementary Material). Among these characteristic species, 902 (18.2 % of the total) are endemic to Mexico, whereas a smaller number (235) are exotic (introduced).
Table 4 Taxonomic distribution of vascular plant species characteristic of the Mexican Tropical Rainforest. Angiosperms were subdivided into six major phylogenetic groups, according to APG IV (2016).
| Plant Group | Orders | Families | Genera | Species |
|---|---|---|---|---|
| Monilophytes | 13 | 30 | 93 | 398 |
| Gymnosperms | 4 | 5 | 10 | 39 |
| Basal Angiosperms | 2 | 2 | 2 | 2 |
| Magnoliids | 4 | 10 | 31 | 233 |
| Monocots | 9 | 35 | 323 | 1,123 |
| Basal Eudicots | 5 | 10 | 21 | 38 |
| Rosids | 18 | 78 | 481 | 1,558 |
| Asterids | 14 | 67 | 541 | 1,545 |
| Totals | 69 | 237 | 1,502 | 4,936 |
The taxonomic distribution of these species shows that Rosids, Asterids, and Monocots are the major groups that rank highest regarding genus and species richness. Ferns and basal Eudicots also encompass significant numbers of species, although considerably fewer than the other three groups. By contrast, Gymnosperms are poorly represented in the TRF; among these, Zamiaceae is the best-represented family, encompassing 23 out of the 39 Gymnosperm species.
Table 5 shows the families and genera best represented by species richness in the TRF. The TRF flora displays the same richness pattern at the family level observed at the national level (Villaseñor 2016), but the ranking is reversed in some taxa; for example, Asteraceae is the highest-ranking family at the country level but ranks third in the TRF. Together, the important families, according to their species richness, account for a large percentage of the total TRF richness (Table 5); in fact, less than 20 % of the species in Asteraceae, Bromeliaceae, Euphorbiaceae, and Lamiaceae occur inside this vegetation type. Araceae, Lauraceae, and Melastomataceae stand out, with over 40 % of all their species recorded in Mexico occurring in this vegetation type. Likewise, outstanding genera with more than 40 % of their Mexican species in the TRF are Asplenium, Eugenia, Miconia, Palicourea, and Piper.
Table 5 The most speciose families and genera in the Tropical Rainforest of Mexico. The percentage of species relative to the total number of species recorded in Mexico by Villaseñor (2016) is shown in parentheses. N = 4,936.
| Family | Species | Genus | Species |
|---|---|---|---|
| Fabaceae | 410 (20.3) | Miconia | 74 (58.2) |
| Orchidaceae | 353 (28.7) | Piper | 65 (42.7) |
| Asteraceae | 294 (9.2) | Solanum | 45 (32.6) |
| Poaceae | 253 (20.3) | Peperomia | 40 (30.7) |
| Rubiaceae | 226 (33.3) | Ipomoea | 40 (25.6) |
| Malvaceae | 122 (21.9) | Tillandsia | 39 (16.8) |
| Euphorbiaceae | 122 (16.7) | Epidendrum | 39 (32.7) |
| Piperaceae | 105 (37.2) | Asplenium | 32 (37.2) |
| Melastomataceae | 104 (50.2) | Cyperus | 35 (32.4) |
| Cyperaceae | 100 (22.8) | Eugenia | 35 (41.7) |
| Solanaceae | 99 (24.4) | Quercus | 32 (20.2) |
| Acanthaceae | 98 (23.6) | Dioscorea | 30 (38.9) |
| Apocynaceae | 98 (21.8) | Passiflora | 30 (34.4) |
| Bromeliaceae | 80 (17.1) | Euphorbia | 29 (11.1) |
| Araceae | 79 (50.0) | Palicourea | 28 (63.6) |
| Lamiaceae | 72 (11.2) | Selaginella | 28 (35.4) |
| Lauraceae | 65 (44.4) | Mimosa | 28 (26.9) |
The area occupied by TRF in the country is estimated at 93,855 km2, which accounts for 4.8 % of the entire land area (Figure 1B). By number of species, Chiapas and Veracruz stand out as the states having the largest species richness of TRF species. They are also the states encompassing the largest areas of this vegetation type (Table 6). Other states like Campeche and Quintana Roo have smaller areas of TRF and, consequently, a much lower species richness. The number of TRF species recorded for San Luis Potosí, the northernmost state where the presence of TRF has been reported, agrees with its marginal geographical location (Table 6, Figure 1B, Rzedowski 1963).
Table 6 Tropical Rainforest species richness in the Mexican states where this vegetation type is recorded. The column Area indicates the extent of the TRF in each state.
| State | Total species | Endemic to Mexico | Introduced | Area (km2) |
|---|---|---|---|---|
| Campeche | 1,524 | 60 | 108 | 1,223 |
| Chiapas | 4,351 | 526 | 208 | 25,472 |
| Hidalgo | 1,781 | 269 | 100 | 1,410 |
| Oaxaca | 3,883 | 593 | 171 | 16,756 |
| Puebla | 2,531 | 368 | 151 | 2,772 |
| Quintana Roo | 1,442 | 56 | 87 | 2 |
| San Luis Potosí | 1,827 | 271 | 123 | 1,607 |
| Tabasco | 2,579 | 187 | 141 | 8,383 |
| Veracruz | 4,184 | 637 | 212 | 36,228 |
| Totals | 4,936 | 889 | 235 | 93,855 |
Table 7 shows the distribution of species richness across the 26 grid cells coinciding with the TRF polygon (Figure 1B). The five grid cells containing the highest number of species are 213, 230, 231, 232, and 245, located in Chiapas, Oaxaca, Tabasco, and Veracruz states. Only two of them (grid cells 213 and 245) are in a single state (Veracruz and Chiapas, respectively), whereas the remaining three grid cells share territory either between two states (Oaxaca and Veracruz, grid cell 230; Chiapas and Tabasco, grid cell 232), or among three states (Chiapas, Tabasco, and Veracruz; grid cell 231).
Table 7 Tropical Rainforest richness in the 1º latitude × 1º longitude grid cells where this vegetation type was recorded in Mexico. The location of these cells is shown on the map in Figure 1B. The column Area indicates the extent of the TRF in each grid. N = 4,936.
| Grid cell No. | Species | Endemic to Mexico | Introduced | Area (km2) |
|---|---|---|---|---|
| 163 | 252 | 29 | 8 | 325 |
| 164 | 759 | 115 | 33 | 2,298 |
| 165 | 283 | 28 | 8 | 639 |
| 178 | 342 | 32 | 14 | 2,096 |
| 179 | 1,214 | 95 | 95 | 8,334 |
| 195 | 682 | 53 | 33 | 610 |
| 196 | 1,536 | 125 | 120 | 1,534 |
| 211 | 223 | 18 | 17 | 193 |
| 212 | 1,575 | 145 | 117 | 6,131 |
| 213 | 2,077 | 235 | 93 | 5,716 |
| 214 | 1,478 | 128 | 56 | 2,256 |
| 215 | 426 | 8 | 45 | 514 |
| 216 | 204 | 2 | 10 | 453 |
| 217 | 135 | 3 | 3 | 124 |
| 219 | 172 | 1 | 1 | 248 |
| 228 | 56 | 15 | 0 | 3,048 |
| 229 | 620 | 31 | 24 | 9,185 |
| 230 | 1,920 | 220 | 82 | 11,227 |
| 231 | 1,646 | 127 | 83 | 8,976 |
| 232 | 1,804 | 148 | 72 | 7,411 |
| 233 | 1,436 | 65 | 54 | 5,301 |
| 243 | 1,131 | 108 | 22 | 1,213 |
| 245 | 2,085 | 152 | 68 | 6,661 |
| 246 | 1,594 | 64 | 42 | 3,769 |
| 250 | 542 | 39 | 15 | 677 |
| 251 | 1,525 | 91 | 63 | 1,010 |
Tropical rainforest floristic regions. The dissimilarity analysis identified groups of cells with dissimilarity percentages ranging from 8 to 17 % (Supplementary Figure S1), which suggested the existence of four or five floristic regions or phytochoria (Figure 4). In the first case (four regions), the TRF northernmost area identified corresponds mainly to the Huasteca region of San Luis Potosí and Veracruz states. A second region includes TRF locations in the neighboring states of Hidalgo, Puebla, and central Veracruz, reaching as far as the northern portion of Oaxaca. The third region mainly corresponds to the central-southern part of Veracruz, the state of Tabasco, the Calakmul region in Campeche, and the Ocote and Lacandon Forest regions in Chiapas. Finally, the fourth region is the southern tip of Chiapas, in the Soconusco region.
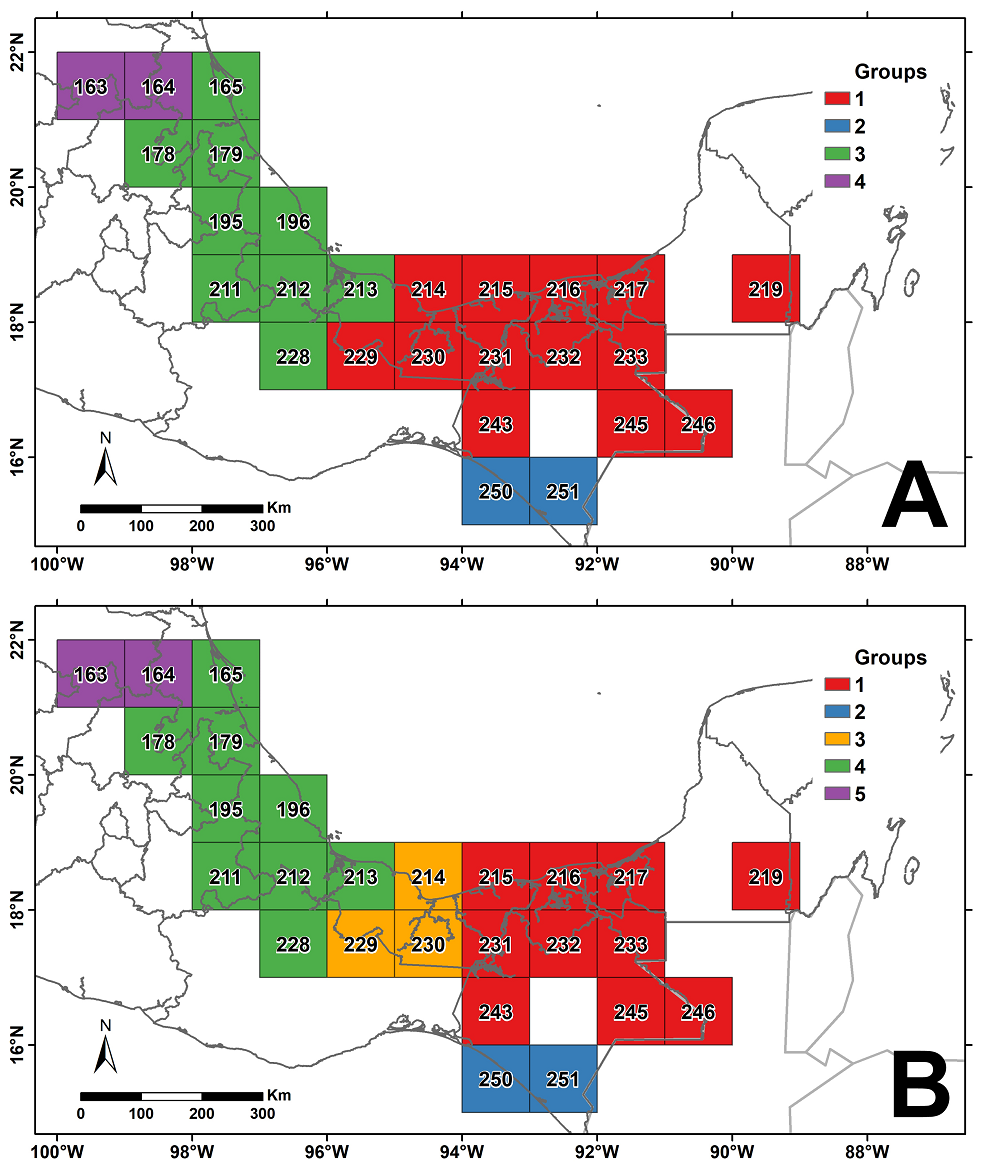
Figure 4 Results of the tropical rainforest species clustering analysis that produced four (A) or five (B) floristic groups (see cluster in Supplementary Figure S1).
The only difference between the four-region and the five-region solutions is that the latter includes an intermediate separate region located in central-southern Veracruz and northern Oaxaca, right in the narrowest part of the country known as the Isthmus of Tehuantepec. The recognition of this extra region serves to better distinguish two major TRF regions, one in the central-northern parts of the Gulf of Mexico watershed and the second in eastern-southeastern Mexico, whose distribution continues to the TRF areas of Belize and Guatemala. Since the five-region scheme seems to better represent the geographical configuration of TRF in Mexico, we used it here to examine their floristic richness hereafter.
Table 8 shows the floristic richness corresponding to each of the five floristic units (considered here as phytochoria) over the TRF region in Mexico. Phytochoria 2 (North-Central Gulf of Mexico) and 4 (Southeastern Mexico) display the highest species richness, while the Huasteca region (phytochorion 1) displays the smallest number. The lowest numbers of introduced (exotic) species were recorded in phytocoria 1 and 5, which is unsurprising given that they also contain the smallest number of species.
Table 8 Tropical rain forest floristic groups (phytochoria) in Mexico. The species recorded exclusively in the phytochorion are indicated in parentheses. N = 4,936.
| Floristic group (Phytochories) | Species | Endemic to Mexico | Introduced |
|---|---|---|---|
| 1 (Huastec region) | 830 (106) | 120 | 36 |
| 2 (North-Central Gulf of Mexico) | 3,133 (516) | 462 | 186 |
| 3 (Central Veracruz and N Oaxaca) | 2,531 (218) | 298 | 111 |
| 4 (Southeastern Mexico) | 3,551 (866) | 404 | 142 |
| 5 (Soconusco region) | 1,646 (86) | 115 | 70 |
The dissimilarity analysis showed that the floristic turnover between the five phytochoria ranges from low to intermediate (Figure 5). Regardless of the focal cell used to evaluate floristic turnover rates, the calculated values imply medium to low between-site dissimilarities over the entire TRF range in Mexico (Figure 5).
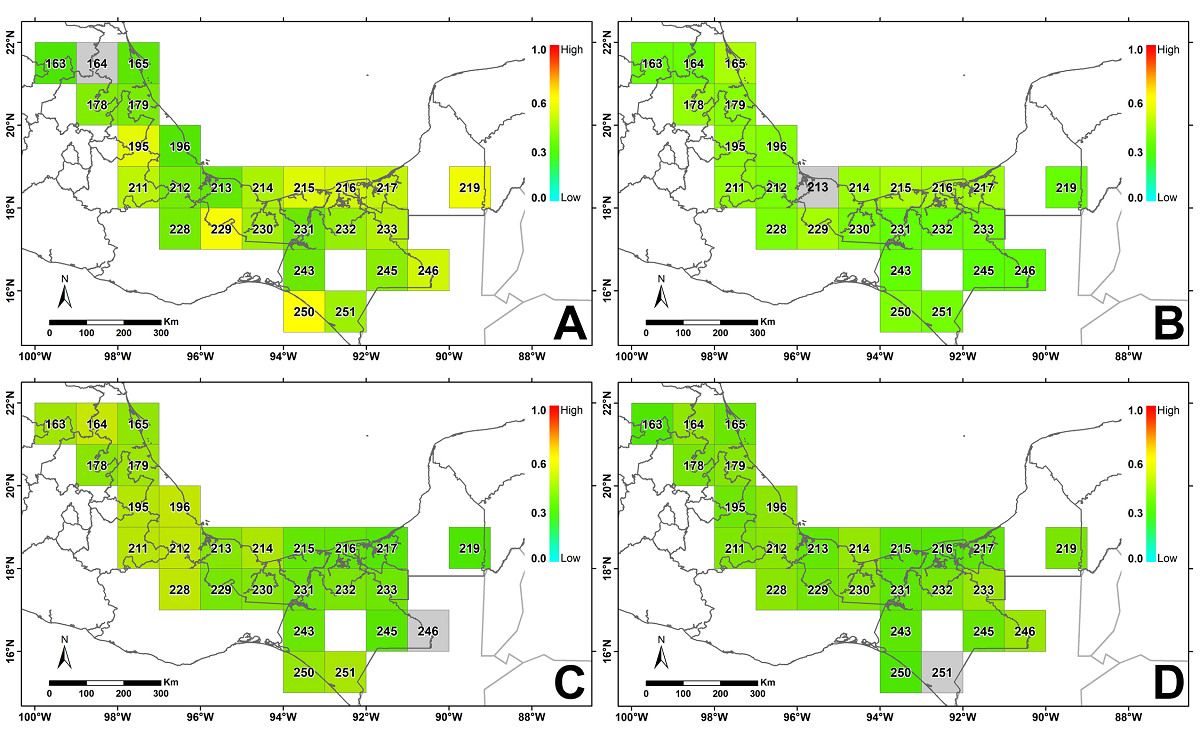
Figure 5 Map showing taxonomic turnover with respect to different focal grid cells (in gray). The scale within the color gradient from orange to red indicates high dissimilarity, whereas the scale from blue to yellow indicates lower dissimilarity. A. Grid cell 164 (Huastec region). B. Grid cell 213 (North-Central Gulf of Mexico). C. Grid cell 246 (Southeastern Mexico). D. Grid cell 251 (Soconusco region).
Discussion
Our results show that in Mexico, the TRF potentially covers an area of 93,855 km2, representing 4.8 % of the country’s entire land area. This estimated area is slightly higher than that reported by Santos-Hernández et al. (2021) (85,930 km2) but considerably higher than that reported by Moreno-Sánchez et al. (2011) (34,872 km2). These differences in the estimated geographical extent of the TRF in Mexico are most likely due to the diverse methods used for its estimation; Santos-Hernández et al. (2021) estimated the total area by adding the areas of 22 potential distribution models of species considered representative of the TRF, while Moreno-Sánchez et al. (2011) evaluated the fragments identified by INEGI in earlier vegetation maps published before the one used in this study (Series II and III versus Series VII). Furthermore, the polygon obtained in this work includes those fragments lacking vegetation but located within the potential TRF geographical range (as estimated by the potential vegetation map). These differences in the estimated extent of Mexico’s TRF highlight the need to continue conducting studies that improve these estimates of area and, accordingly, of the species richness of this vegetation type while developing standardizing criteria to increase the confidence of these estimates. The assessments of TRF extent and its floristic richness reported in this study, like the other two estimates cited above, constitute working hypotheses that will be supported or falsified as more information accumulates. In particular, the results of this study can be evaluated with the map in shape format, as well as the species list included in the Supplementary Material.
Floristic richness and endemism in the Mexican tropical rainforest. Here, we provide an update on the floristic richness of the Mexican TRF. To our knowledge, no previous study had systematically documented such richness for the entire distribution area of this vegetation type. Wendt (1993) analyzed only the canopy trees of the Atlantic slope, reporting 452 species, in addition to the floristic affinities and origins of this flora. Likewise, Villaseñor & Ortiz (2014) had reported the presence of 5,296 species of Magnoliophyta in the humid tropical biome, of which the TRF represents a large proportion. The figures reported here (Table 4) account for 93.4 % of the total flora of the biome, taking as reference the figures of Villaseñor & Ortiz (2014).
Molina-Paniagua et al. (2023) reported a study of karst landforms in Mexico and its floristic diversity. Karst terrain covers around 20 % of Mexico’s territory, and the TRF is mostly located on it (with some notable exceptions, such as the Los Tuxtlas region, where the TRF develops mostly on volcanic soils), covering 4.8 % of the country’s territory, about one-quarter of Mexico’s entire karstic region. These authors report the presence of 11,771 species, although they concentrate on the karst forests placed at higher elevations of mountains, an area largely unsuitable for the occurrence of TRF. In the Mexican lowlands, in addition to TRF, other vegetation types are also present on karstic terrains, such as Tropical Semi-Evergreen and Tropical Sub-Deciduous Forests and even Seasonally Dry Tropical Forests, particularly in the Yucatán Peninsula. In their study, the authors do not segregate the distinct floristic components of each of these units. Although in our study, species filtering was applied (see Methods), the total estimated richness for the TRF (8,353 species) would include 70 % of the species reported by these authors; however, when considering only those species that passed through the filters applied to determine the TRF characteristic species, the resulting figure of 4,936 species only accounts for 42 % of Mexico’s karst flora. According to Wendt (1993) the ancient elements and the endemic elements of the TRF are especially represented in these karst forests.
Comparing the level of endemism in the TRF with other vegetation types is difficult because of the scanty available information on this topic. Wendt (1993) analyzed the canopy trees of the TRF on the Atlantic slope of Mexico and found 13.9 % endemism, which compares approximately with the 18.2 % of the characteristic species endemism of the TRF found in the present study. Villaseñor & Ortiz (2014) reported 1,185 endemic species for the entire humid tropical biome, whereas Molina-Paniagua et al. (2023) recorded 372 endemic species in montane karst terrains. We are unaware of other figures that may help discuss endemicity in the tropical humid forests of Mexico; in this study, however, we report 899 endemic species to Mexico.
Floristic regions in the Mexican tropical rainforest. The five-group regionalization (Figure 4B) only differs from the four-group solution (Figure 4A) in an intermediate region, including three grid cells (214, 229, and 230) in the central portion of the TRF distribution. This intermediate region corresponds to the TRF located in central Veracruz and the Chimalapas-Uxpanapa region, at the limits of Oaxaca, Chiapas, and Veracruz states. The location of this region suggests its transitional character between the communities distributed west and east of the geographical constriction represented by the Isthmus of Tehuantepec. Because the Isthmus region is characterized by low elevations, it has been suggested to act as a barrier for different groups of organisms, especially for animals dwelling in montane habitats (Duellman 1960, Peterson et al. 1999). The assessment of this hypothesis is beyond the objectives of this study, but the data included in the Supplementary Material can be used to examine it.
Within Phytochorion 1 (Figure 4B), Wendt (1989) identified the so-called Arc Region, situated in the limits of Chiapas, Tabasco, and Veracruz, an area of great biogeographic interest due to its richness of tree species that characterize the TRF (Wendt 1989, 1993). Wendt (1989) suggests that due to its high precipitation, this region served as a Tertiary refuge for TRF species. Likewise, Toledo (1982) identified the Los Tuxtlas region as a Tertiary refuge, placed in Phytochorion 3 in Veracruz. Richards (1973) reviewed evidence indicating the great antiquity of TRF, with the oldest fossil records associated with this community dating back as far as 60 My ago and fossil records in Mexico from the early Cenozoic (Wendt 1989). Wolfe (1987) discussed the existence of humid tropical forests in the Paleocene-Eocene epochs up to 50° latitude, which led him to propose a boreo-tropical flora with Laurasian affinity. Thereafter, increasing evidence has accumulated of tropical forests being present in boreal latitudes, further supporting the early existence of TRF as a community (e.g.,Lavin & Luckow 1993, Fritsch 2001). Now that we have more precise information on TRF richness, we expect that future work will help discriminate between TRF elements from Gondwanic lineages and those typically Laurasian.
Floristic group 1 (Huasteca and North-Central Gulf of México regions of Table 8 and Figure 4) is embedded within the physiographic subprovince known as Carso Huasteco (Huastec Karst, INEGI 2001), identified as a phytogeographic district by Villaseñor & Ortiz (2022). The territory occupied by the TRF in this region is not extensive, with montane forests dominating the landscape due to its rugged geomorphology. We documented 835 species for this region, 106 uniquely known from this TRF region.
Floristic group 2 is adjacent to phytochorion 1 and runs from northern Veracruz to the North of Oaxaca and southeastern Veracruz. It comprises TRF areas located in Hidalgo and Puebla states, with its most extensive areas in the La Chinantla region in northern Oaxaca (grid cell 228) and the Los Tuxtlas region (grid cell 213). This phytochorion ranks second by number of species (3,133) and characterizes the TRF of the Gulf Coast floristic province (Rzedowski 1978). This region includes 516 species known only from its territory, most also found in TRF outside Mexico.
Within the TRF polygon in Mexico (Figure 4), virtually any grid cell randomly selected will show low turnover values concerning the other cells (Figure 5). This indicates a high number of widely distributed species, which contrasts with observations from other biomes, such as the Seasonally Dry Tropical Forest, for which Lavin et al. (2004) reported a low number of widely distributed species. On the other hand, in the TRF, each phytochorion is characterized by a set of unique species, only known from its territory (Table 8). For example, for the Southeastern region (phytochorion 4), we identified 866 species restricted to its territory, 195 of these endemic to Mexico. Similarly, in phytochorion 1 (Huasteca region), there are 106 species only known from its territory, 57 of them being endemic to Mexico.
Using databases to perform floristic studies. Strong criticism about using online databases to perform studies such as this one is common. However, we believe such criticism is based on ignorance rather than truthfulness. It is impossible to verify every record in the databases, but neither can taxonomists verify all the specimens in their group deposited in all herbaria. What is usually done is to rely on the available literature, on identifying the herbarium material (many online herbaria disclose in their records the authority that provided the taxonomic determination), and sometimes even on the geographical distribution of the taxa. Undoubtedly, databases contain many errors, but most have been carried over from the primary sources (herbarium specimens); if a herbarium specimen is incorrectly identified, the error is digitized, and only when new literature is available to help correct the error will the record be curated, just as a taxonomist does in the herbarium. Therefore, the inaccuracy should be reduced and eventually eliminated from the databases when taxonomists curate the primary source equally efficiently (often a utopia). If we do not trust these databases, we will continue waiting for years or decades for taxonomists to provide us with more reliable sources of information, which often do not encompass the additional information required to carry out diversity analyses. For databases to become more reliable sources of information, such as herbarium specimens, a significant amount of curatorial work is required, not only for taxonomic identification but also for information on the geographic provenance of the material, which always requires georeferencing.
We believe that information from specimen databases, combined with bibliographic reviews and expert botanical manipulation, can result in extremely useful floristic lists. This study does not pretend to be a flora, even a complete floristic list of Mexican TRF. It is a study of relative numbers and patterns in the Mexican TRF flora. They may not be the "floras" we would all like to see, with each species and specimen carefully considered and studied, but they are what is needed in a world where species are disappearing at a faster rate than they can be studied or protected.
Many plant communities in the Mexican tropical lowlands have been transformed into open land for economic and productive activities (Dirzo & García 1992, Challenger 1998, Maldonado-Sánchez & Maldonado-Mares 2010, Meave et al. 2017). Initially, slash-and-burn agriculture was the leading cause of the TRF decline; however, as the land loses its usefulness for agriculture, it is often transformed into induced grasslands to raise cattle. This has been the fate of much of the territory previously covered by the TRF over a large portion of its original range. The potential vegetation map prepared in this study (Figure 1B, Supplementary Material), along with the floristic information compiled (Supplementary Material), can serve as a basis for future studies aimed at the restoration of sites with degraded forests or for selecting species that should be prioritized in reforestation efforts. We hope that the floristic information synthesized here contributes to advancing our knowledge about this important, albeit threatened, vegetation type and helps design better strategies for its conservation.
Supplementary material
Supplemental data for this article can be accessed here: https://doi.org/10.17129/botsci.3681.

