


 texto en
  Inglés (pdf)
 Artículo en XML
 Referencias del artículo
 Enviar artículo por email
 Citado por SciELO
  Similares en
SciELO
Similares en
SciELO 
 Permalink
Introduction
Starch plays a key role in various industrial applications due to its low production cost, easy obtainability, and versatility. Native starches, from different botanical sources, possess unique and diverse properties, and their structure can be modified to improve their functional properties (Altuna et al., 2018; Khurshida et al., 2021).
Starch is stored as granules inside the plant seed as a reserve carbohydrate and is composed of two glucan polymers: amylose and amylopectin. Amylose is a linear molecule formed by D-glucopyranose units linked by α-(1,4) bonds, with a degree of polymerization (DP) ranging from 500 to 6 000 glucose residues (Bertoft, 2017). In contrast, amylopectin is a highly branched, large chain molecule with a DP of 3 × 10⁵ to 3 × 10⁶ glucose units, composed of D-glucopyranose units linked by α-(1,4) and α-(1,6) bonds (Wang et al., 2017).
Traditionally, the main sources of starch in the world are corn, rice, wheat, potato and cassava. Corn (Zea mays L.) is a cereal of great economic, social and cultural importance in the Mexican territory. Mexico is considered to be the center of origin, genetic diversity, domestication and diversification of corn, with a record of 68 native races (Caballero-García et al., 2019; López-Vásquez et al., 2020). Among them, cacahuacintle corn (CC) stands out, since its grain is characterized by being white, floury in texture and large in size, making it a key ingredient in Mexican cuisine. Several studies have shown that CC contains approximately 70.8 % starch, making it a potential source for obtaining this ingredient (Téllez-Silva et al., 2016).
Most native starches have disadvantages such as their propensity to retrograde, high viscosity, poor thermal stability, low freeze-thaw resistance, limited processing tolerance and gel opacity. These characteristics limit their use in both the food and non-food industries. To address these problems, starches must be modified (Basilio-Cortés et al., 2019; Jayakody & Hoover, 2008) by different techniques that alter their characteristics to improve their functional properties (Bajaj et al., 2019). There are several methods to increase the technological and nutritional properties of starches for use in the food industry. These include physical methods (heat-moisture, annealing and freeze-thawing), chemical methods (esterification, acidification and oxidation) and enzymatic methods (branching and branching hydrolysis) (Obadi et al., 2023).
Esterification with octenyl succinic anhydride (OSA) improves the emulsifying and amphiphilic properties of starches by replacing the hydroxyl groups of starch with hydrophobic components (López-Silva et al., 2020). OSA-modified starch presents a higher fraction of resistant starch, improves emulsion stabilization through the Pickering mechanism, and allows the creation of edible thin films. These properties make it a derivative with applications in the food industry (Altuna et al., 2018; Zhou et al., 2023).
The particular properties of starch are closely linked to its botanical origin and the modification methods applied, resulting in variations in the possible applications for each type of starch. Despite the importance of these factors, there is limited research focused on CC starch, and even fewer studies have delved into its chemical modification process with OSA. Considering the above, this work aimed to evaluate the effects of the modification of native CC starches with octenyl succinic anhydride (CCOSA) on their physicochemical, morphological, structural, rheological and in vitro digestibility properties.
Materials and methods
CC samples of an endogenous variety (GC) were obtained from producers in the community of Santa María Nativitas in the municipality of Calimaya, State of Mexico, Mexico (17° 40’ 00’’ N and 97° 20’ 00’’ W, at 2 680 m a. s. l.). The chemical reagents used for starch modification were hydrochloric acid (HCl), sodium hydroxide (NaOH) and acetone purchased from J.T. Baker®, as well as 2-octenyl-succinic anhydride (OSA) from Sigma-Aldrich®. All chemical reagents were of analytical grade. The water used for the experiments was deionized.
Starch extraction from cacahuacintle corn
CC starch was obtained from GC variety grains using the method proposed by Mir et al. (2017), with some modifications. Two hundred g of corn were immersed in 600 mL of 0.16 % (w/w) sodium metabisulfite for 24 h. Subsequently, the grains were washed with distilled water, ground in a blender (Oster 465-15, Mexico) and sifted to obtain fine flour. Subsequently, a 0.2 % (w/w) NaOH solution was added and the mixture was stirred for 4 h. The sediment was washed five times with distilled water until reaching a pH of 7. The resulting mixture was centrifuged (5810R, Eppendorf, Germany) at 5000 × g for 10 min. The resulting starch was separated and dried in a forced-air oven (HCF-62, Riossa Digital, Mexico) at 40 °C for 24 h.
Chemical modification
CC starch was modified with OSA (CCOSA) using the procedure described by López-Monterrubio et al. (2023), with some modifications. Thirty g of CC was dispersed in 100 mL of deionized water and stirred continuously. The pH of the dispersion was adjusted to 8.75 with a 0.1 N NaOH solution. Subsequently, OSA (equivalent to 3.0 % of the starch dry weight) was carefully added and maintained for 6 h at 25 °C, controlling the pH at 8.75. At the end of the reaction, the pH was neutralized with a 1 N HCl solution. The resulting mixture was centrifuged at 3 410 × g for 5 min, followed by two washes with deionized water and another with acetone. The OSA-modified starch was dried in an oven at 35 °C for 24 h.
Degree of substitution of modified starch
The degree of substitution (DS) of CCOSA starch was determined by the titration method described by López-Silva et al. (2020), with some modifications. First, 1.25 g of CCOSA starch was dispersed in 12.5 mL of a 0.1 M HCl solution with stirring for 30 min. Subsequently, the mixture was centrifuged at 3 000 × g for 10 min. The precipitate was washed successively with 90 % (v/v) ethanol and twice with distilled water, then suspended in 75 mL of distilled water and placed in a water bath at 90 °C for 10 min. The mixture was rapidly cooled to room temperature (using an ice bath) and titrated while stirring with a standard 0.1 M NaOH solution until reaching a pH of 8.3. CC was titrated with the same procedure to obtain the reference value. The volume of NaOH spent was used to calculate the DS using Equation 1:
where A represents the volume of NaOH required in the titration of the sample (mL), M is the molarity of the NaOH solution and W is the dry weight of the modified starch (g).
Apparent amylose
The apparent amylose content was determined by the method proposed by Zhu et al. (2008), with some modifications. First, 0.1 g of each starch sample was weighed and then dispersed in 1 mL of ethanol (96 % w/v) and 10 mL of NaOH (1 M), with constant stirring for 1 h. The dispersed starch was transferred to a volumetric flask and made up to 100 mL with distilled water. A 2 mL aliquot was taken, emptied into a flask, and 50 mL of distilled water, 100 µL phenolphthalein (1 % w/v), 2 mL of HCl (0.1 M), and 2 mL of iodide reagent (2 g of KI and 0.2 g of iodine in 100 mL of distilled water) were added. The volume was diluted to 100 mL, and absorbance was measured at 510 and 620 nm in a spectrophotometer (Spectronic Genesys 2, Thermo Electron Corporation, USA). Measurements were performed in triplicate from a standard curve obtained with amylose and amylopectin samples.
Characterization of starch granules
Size distribution
Starch granule size distribution and Sauter mean diameter (D3,2) were determined using a Mastersizer 3000 laser diffraction particle size analyzer (Malvern Instruments, UK), equipped with a Hydro 2000 module. For this purpose, the starch samples were suspended in distilled water until they reached a shading value of 12 to 17 %. The refractive indices of water and starch were 1.33 and 1.52, respectively. The values of D3,2 and polydispersity index (span) were calculated according to Equations 2 and 3, respectively:
where D i represents the mean diameter of starch granules, n i is the number of starch granules, and d 10 , d 50 and d 90 correspond to the diameters at 10, 50 and 90 % of the accumulated volume, respectively (Cortés-Viguri et al., 2021).
Scanning electron microscopy
The granular morphology of the starches was studied with a scanning electron microscope (JEOL, Japan), operated at 10 kV. Each starch sample was mounted on aluminum stubs with carbon adhesive tape and coated with a gold layer. Magnifications of 250×, 1500×, and 2500× were used (Yang et al., 2019).
Fourier Transform Infrared (FTIR) Spectroscopy
Starch spectrograms were obtained on an FTIR spectrometer (Cary 630, Agilent Technologies, USA), equipped with a universal attenuated total reflectance accessory. Dried starch samples (~0.01 g) were placed on the universal diamond crystal sample accessory. Scanning was carried out in the range of 4 000 to 400 cm-1, with a resolution of 4 cm-1. The spectrograms obtained corresponded to the mean values of thirty scans (Gómez-Luría et al., 2019).
Pasting properties
The pasting properties of the starch suspensions were evaluated with a rheometer (Physica MCR 301, Anton Paar, Germany), equipped with a 50 mm diameter parallel plate geometry. Aqueous dispersions (5 % w/w) of the starches (CC and CCOSA) were placed on a plate, and the geometry was set to a 0.5 mm gap. The edges of the measurement geometry were coated with silicone oil to prevent dehydration. The test protocol included the application of a heating and cooling cycle at 1 Hz and 1 % strain. The temperature cycle consisted of equilibrating starch samples at 25 °C for 5 min, followed by gradual heating from 25 to 90 °C at a heating rate of 6 °C∙min-1. The temperature was held for 5 min; subsequently, it was cooled from 90 to 25 °C at a rate of 6 °C∙min-1 and held at 25 °C for 5 min (Mendez et al., 2011). Values for peak temperature, peak viscosity, final viscosity and breakdown viscosity were obtained from pasting graphs.
Rheological properties
Corn starch gels (CC and CCOSA) were prepared by heating starch dispersions (5 % w/w) with magnetic stirring at 90 °C for 20 min; then, they were cooled to 25 °C (Cortés-Viguri et al., 2021). The rheological properties of the gels were evaluated as mentioned above. All experiments were performed at 25 °C, and the Physica TEK 150P system (Messtechnik, Germany) was used to maintain the temperature.
Viscoelastic properties. To determine the linear viscoelastic region, frequency sweeps were performed in a range from 0.01 to 100 Hz, with a strain of 0.1 %. Additionally, strain sweeps were performed in a range from 0.01 to 10 % at 1 Hz. The storage (G') and loss (G") moduli were obtained using the US200/32 V.50 rheometer software (Carrillo-Navas et al., 2014).
Apparent viscosity. This was determined by varying the shear rate from 10-3 to 103 s-1. The experimental flow profiles are adequately described (R2 > 0.99) by the Herschel-Bulkley model:
where τ is the sheer stress (Pa), τ 0 is the yield point (Pa), K is the consistency coefficient (Pa∙sn), γ̇ is the sheer rate (s-1) and n is the flow behavior index (dimensionless).
In vitro digestibility
The digestibility of starches in their native (CC) and modified (CCOSA) forms was determined using the method proposed by Lee and Chang (2019), with minor modifications. Samples of 0.5 g of the starches were dispersed in 25 mL of deionized water and placed in a water bath at 37 °C with shaking for 30 min. To each sample, 0.75 mL of pancreatic α-amylase solution (30 U∙mL-1) was added and incubated in a water bath at 37 °C with constant shaking. Aliquots were taken at 0, 20, and 120 min to determine glucose content by the dinitrosalicylic acid method. Total starch (TS) content was determined, and starches were classified based on their hydrolysis rate: rapidly digestible starch (RDS; digested within the first 20 min), slowly digestible starch (SDS; digested between 20 and 120 min), and resistant starch (RS; undigested after 120 min).
Where FG is the free glucose content, and G 20 and G 120 represent the glucose content released after 20 and 120 min, respectively.
Statistical analysis
All experiments were performed in triplicate under a completely randomized design. Data were expressed as the mean ± standard deviation. Analysis of variance was performed and, where applicable, Tukey's range test (P ≤ 0.05). Statistical analysis was performed using Statgraphics Plus software (Statistical Graphics Corp., Manugistics, Inc., USA).
Results and discussion
Amylose, amylopectin content and degree of substitution
Table 1 shows the amylose and amylopectin content, and DS. Amylose and amylopectin content varies according to botanical origin, resulting in different amylose/amylopectin ratios (Obadi et al., 2023). A significant decrease in amylose content was observed in CCOSA, in compassion with CC. This behavior is consistent with other studies that have reported a reduction in amylose content after modification with OSA (López-Monterrubio et al., 2023; Yao et al., 2024). Some studies have revealed that esterification occurs mainly in the amorphous region of starch, which is generally composed of amylose (Gao et al., 2021). Moreover, during the starch modification process, the granule surface expands slightly to allow the attachment of octenyl succinate groups, which could lead to the leaching of amylose molecules and, consequently, the reduction of amylose content after modification (Yao et al., 2024). On the other hand, the amylopectin content in CCOSA (77.80 ± 0.01 %) was significantly higher than that presented by CC (72.60 ± 0.02 %). This finding reflects the compensatory relationship between both major starch components.
Table 1 Amylose, amylopectin content and degree of substitution of native (CC) and octenyl succinic anhydride modified (CCOSA) cacahuacintle corn starch.
| Type of starch | Amylose (%) | Amylopectin (%) | Degree of substitution |
|---|---|---|---|
| CC | 27.40 ± 0.38 a | 72.60 ± 0.02 b | - |
| CCOSA | 22.20 ± 0.09 b | 77.80 ± 0.01 a | 0.017 ± 0.005 |
Data are expressed as the mean ± standard deviation. Means with the same letters within each column do not differ statistically (Tukey, P ≤ 0.05).
OSA starches are obtained by the esterification reaction between the hydroxyl groups of starch and OSA. In this context, a commonly used parameter is the DS, which represents the average number of octenyl succinate derivatives per glucose unit (Sweedman et al., 2013). The DS for CCOSA starch was 0.017 ± 0.005, slightly higher than that reported by Lopez-Silva et al. (2020) in normal OSA-modified corn starch (0.0112 ± 0.001). This variation may be due to the higher amylose content in CC. Previous studies revealed that esterification with OSA is a complex process influenced by amylose content, particle size and molecular structure, and whose reaction occurs mainly in the amorphous region of starch (Simsek et al., 2015).
OSA substitution can occur at carbons 2, 3 and 6 of the glucose molecule. When starch is modified with OSA, its normally hydrophilic nature acquires hydrophobic behavior (octenyl groups), resulting in molecules with amphiphilic character. This change is well known because it improves emulsification properties and can be used as an emulsifier in food systems (Sweedman et al., 2013; Zhang et al., 2017).
Starch granule size distribution
Table 2 shows the D3,2 and diameters at 10, 50 and 90 % of the cumulative distribution of starch granules (CC and CCOSA). CCOSA granules showed a significantly higher D3,2 (16.80 ± 0.10 μm) compared to their native counterpart (14.26 ± 0.06 μm). These results are supported by the cumulative volumes d10, d50 and d90, which were higher in the CCOSA starch. The increase in size can be attributed to the reaction with OSA on the surface of the granules, which caused significant changes in their surface structure and, therefore, in their size (Bajaj et al., 2019). Furthermore, this increase could be the result of aggregation effects induced by changes in the amphiphilic nature of the OSA-modified starches, which coincides with the findings reported by Lopez-Silva et al. (2019).
Table 2 Sauter mean diameter (D3,2), and granule diameters at 10, 50 and 90 % of the cumulative distribution.
| Starch | d10 (μm) | d50 (μm) | d90 (μm) | D3,2 (μm) | span |
|---|---|---|---|---|---|
| CC | 9.73 ± 0.01 b | 15.23 ± 0.06 b | 23.43 ± 0.06 b | 14.26 ± 0.06 b | 0.90 ± 0.01 b |
| CCOSA | 10.33 ± 0.06 a | 17.13 ± 0.13 a | 88.43 ± 0.40 a | 16.80 ± 0.10 a | 4.33 ± 0.06 a |
CC: native cacahuacintle corn starches; CCOSA: starches modified with octenyl succinic anhydride; span: polydispersity index. Data are expressed as the mean ± standard deviation. Means with the same letters within each column do not differ statistically (Tukey, P ≤ 0.05).
The span value was significantly higher in CCOSA, being 4.8 times larger than that of CC. This finding is related to a broader particle size distribution, which could be explained by the greater tendency of starch granules to agglomerate (Domene-López et al., 2019). CC granules showed a unimodal distribution (Figure 1A(1)), with the highest peak at 14.39 ± 0.03 µm. CCOSA granules, on the other hand, showed a bimodal distribution (Figure 1B(1)), with a large peak at 15.02 ± 0.01 µm and a small one at 158.73 ± 0.03 µm.
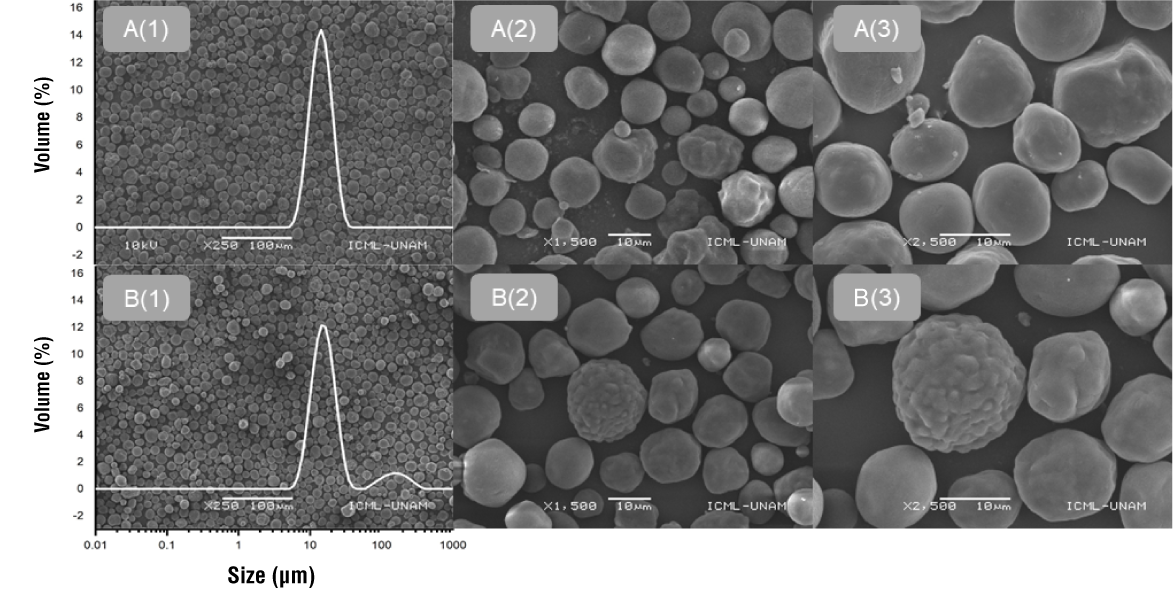
Starch granule morphology
Figure 1 shows the micrographs of starch granules (CC and CCOSA). According to the images, modification with OSA produced significant changes in starch shape and surface. CC granules exhibited mainly spherical shapes, although some had more oval or cylindrical shapes. Morphological variations are influenced by the corn genotype and by a less rigid protein matrix in the floury endosperm, such as that of CC (Timm et al., 2020).
The surface of CC granules was mostly smooth, although some were slightly rough (Figure 1A(3)). However, OSA modification significantly altered the morphology of the starch granules, exhibiting rougher surfaces with more pronounced depressions and less defined edges (Figure 1B(3)). This is possibly the result of esterification reactions or mild hydrolysis during preliminary NaOH treatment. The protrusions presented by the CCOSA granules are probably related to the aggregation of OSA-esterified amylose chains concentrated on the granule surface (Lopez-Silva et al., 2019). This suggests that the reaction occurred mainly on the surface and not inside the granules (Xu et al., 2023).
FTIR analysis
The infrared spectra of the starches (CC and CCOSA) are presented in Figure 2. The formation of carboxylate groups was confirmed by this technique. It can be seen that native and modified starch have similar profiles. A broad peak is detected in the range of 3 500 to 3 000 cm-1, which is related to the presence of starch hydroxyl groups (O-H). The peaks at 2 930 and 2 880 cm-1 are attributed to the antisymmetric and symmetric stretching vibration of aliphatic groups CH2 and CH3, and be attributed to free fatty acids (Wei et al., 2020). The band in the range of 1 700 to 1 600 cm-1 is related to the amide I group, suggesting the presence of protein on the surface of starch granules. The fingerprint of starches is presented in the most prominent peak between 1 100 and 920 cm -1, where a stretching of the C-O bond was observed (Lu et al., 2019).
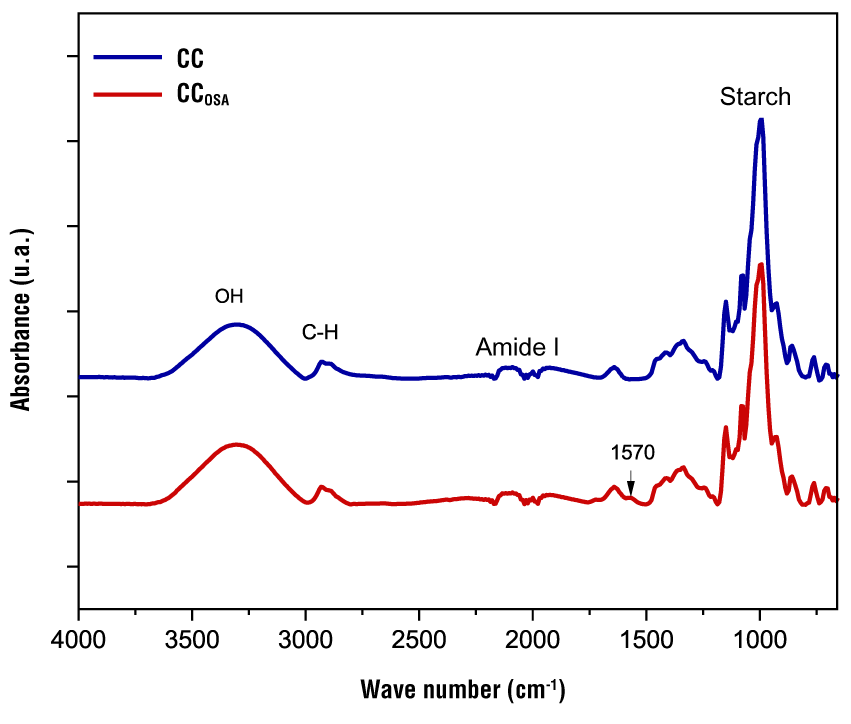
Figure 2 FTIR spectrum of native (CC) and octenyl succinic anhydride modified (CCOSA) cacahuacintle corn starch.
Compared to native starch, modified starch showed an absorption band at 1 570 cm-1, attributed to the asymmetric stretching vibration of the carboxyl group (COOH) or the carboxylate group (COO-), due to the formation of sodium octenyl succinate starch in alkaline reaction systems. FTIR spectra confirmed the modification and evidenced the ability of the succinyl group to esterify the starch chains (Romero-Hernández et al., 2021). They also support the efficacy of the OSA modification process in altering starch properties, suggesting its potential application in various areas of the food industry.
Pasting properties
The paste profiles of the starches (CC and CCOSA) are shown in Figure 3, and the parameter values are presented in Table 3. It can also be seen that chemical modification alters the pasting characteristics and functional properties of starch due to structural changes.
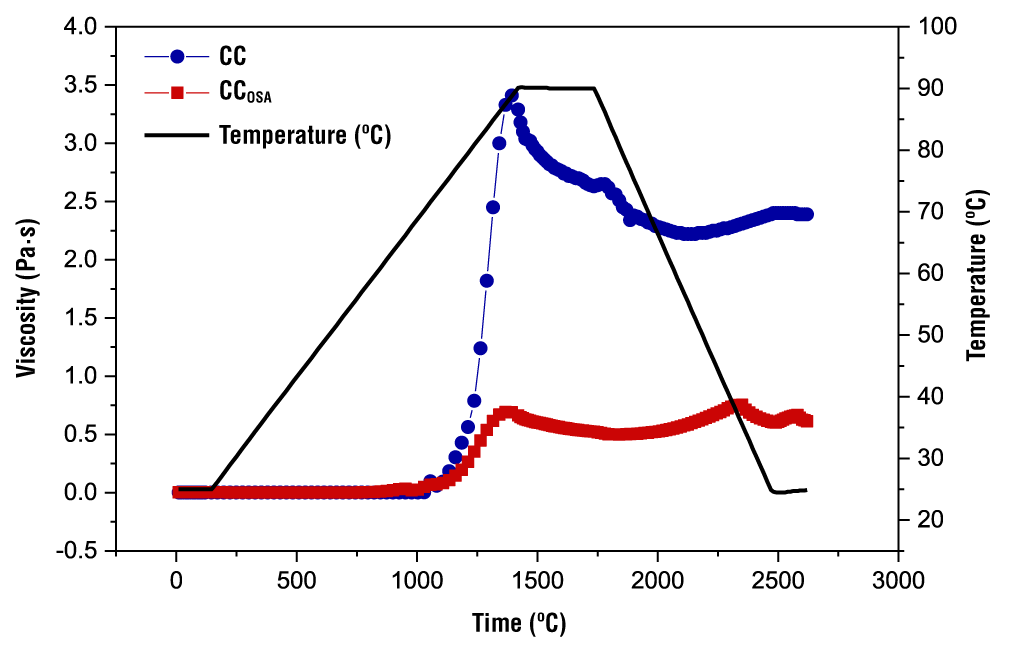
Figure 3 Profile of native (CC) and octenyl succinic anhydride modified (CCOSA) cacahuacintle corn starch paste.
Table 3 Property parameters of native (CC) and octenyl succinic anhydride modified (CCOSA) cacahuacintle corn starch paste.
| Type of starch | Pasting temperature (°C) | Peak viscosity (Pa∙s) | Breakdown viscosity (Pa∙s) | Final viscosity (Pa∙s) | Setback viscosity (Pa∙s) |
|---|---|---|---|---|---|
| CC | 66.50 ± 1.13 a | 3.41 ± 0.09 a | 1.18 ± 0.13 a | 2.54 ± 0.21 a | 0.31 ± 0.02 a |
| CCOSA | 60.90 ± 0.99 b | 0.50 ± 0.01 b | 0.19 ± 0.11 b | 0.61 ± 0.17 b | 0.11 ± 0.01 b |
Data are expressed as the mean ± standard deviation. Means with the same letters within each column do not differ statistically (Tukey, P ≤ 0.05).
The temperature at which viscosity begins to increase is called the pasting temperature (PT). The PTs of CC and CCOSA coincided with the gelatinization temperatures (data not shown). It can be seen that CCOSA presented a lower PT (60.90 °C) than CC (66.50 °C) (Table 3). This indicates that the incorporation of the octenyl succinate group alters the ordered structure of the modified starch, which facilitates water penetration and swelling of the granules at lower temperatures (López-Monterrubio et al., 2023). This is in accordance with the reports of Bello-Flores et al. (2014), where they establish that chemical modification with OSA of Musa paradisiaca starch increases paste viscosity and produces a decrease in PT.
The magnitude of the peak viscosity of CC starch was much higher than that of CCOSA. The chemical modification revealed in FTIR and structural changes limited the amorphous region of the granules to trap water and, consequently, a lower peak viscosity was presented (Salazar-Irrazabal et al., 2023). The breakdown viscosity of the starches varied between 0.19 and 1.18 Pa∙s, where the highest value was presented by CC, indicating that this starch had greater stability than those modified with OSA. Núñez-Bretón et al. (2024) point out that this behavior is due to a restructuring of its fractions and a greater rearrangement of the polymeric matrix. Likewise, the final viscosity of CCOSA was significantly lower than that of CC. Won et al. (2017) found a similar trend in OSA-modified potato starch when compared to its native counterpart.
Apparent viscosity
Figure 4 shows typical apparent viscosity curves as a function of shear rate for 5 % starch gels. A similar shear thinning behavior is observed for both gels (CC and CCOSA); that is, the viscosity decreases as the shear rate increases. This behavior is associated with an alignment of the biopolymer molecules at the applied shear rate, which modifies their original conformation and the biopolymer-biopolymer interactions are disrupted, thereby decreasing the interaction strength between the flow layers (Cortés-Viguri et al., 2021). It can be seen that CC presented the highest viscosity values throughout the shear rate range.
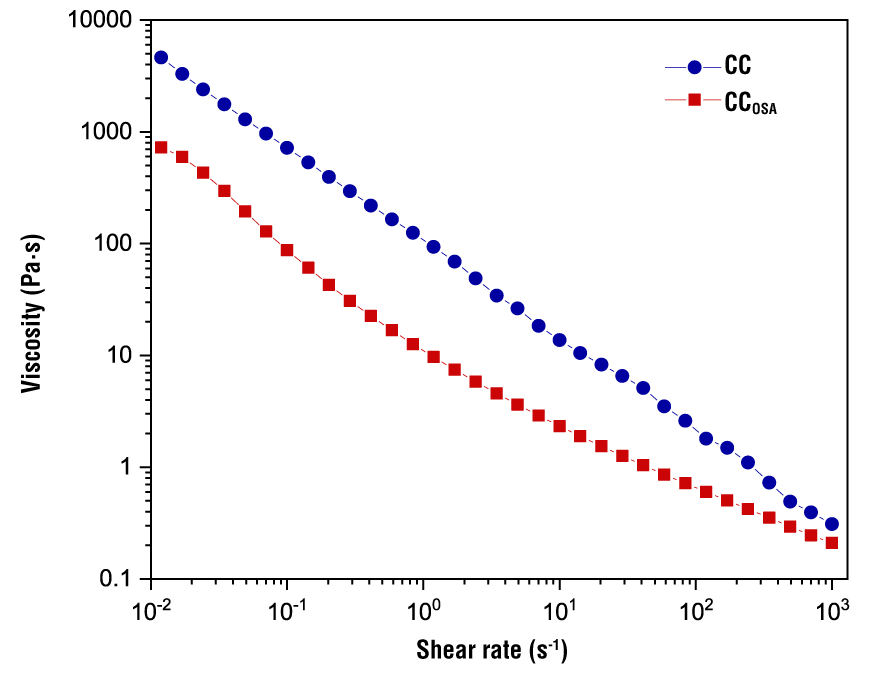
Figure 4 Flow curves of native (CC) and octenyl succinic anhydride modified (CCOSA) cacahuacintle corn starch gels.
The experimental flow profiles showed an adequate correlation (R2 > 0.98) with the Herschel-Bulkley model (Table 4). The n values obtained for the starches were between 0.16 and 0.59, indicating that both presented pseudoplastic behavior (n < 1), although it was significantly lower with the CC. The magnitude of K of the CC was significantly higher (99.19) than that of CCOSA (3.66); that is, the CC was more structured in the dispersed phase and presented higher vi/scosities in the shear rate range studied (Marboh & Mahanta, 2023).
Table 4 Rheological parameters of the Herschel-Bulkley model.
| Type of starch |
|
K (Pa∙s n) | n |
|---|---|---|---|
| CC | 3.85 ± 0.25 b | 99.19 ± 0.71 a | 0.16 ± 0.01 b |
| CCOSA | 8.12 ± 0.28 a | 3.66 ± 0.19 b | 0.59 ± 0.02 a |
CC: native cacahuacintle corn starches; CCOSA: octenyl succinic anhydride modified starches. Data are expressed as the mean ± standard deviation. Means with the same letters within each column do not differ statistically (Tukey, P ≤ 0.05).
Mechanical spectrum
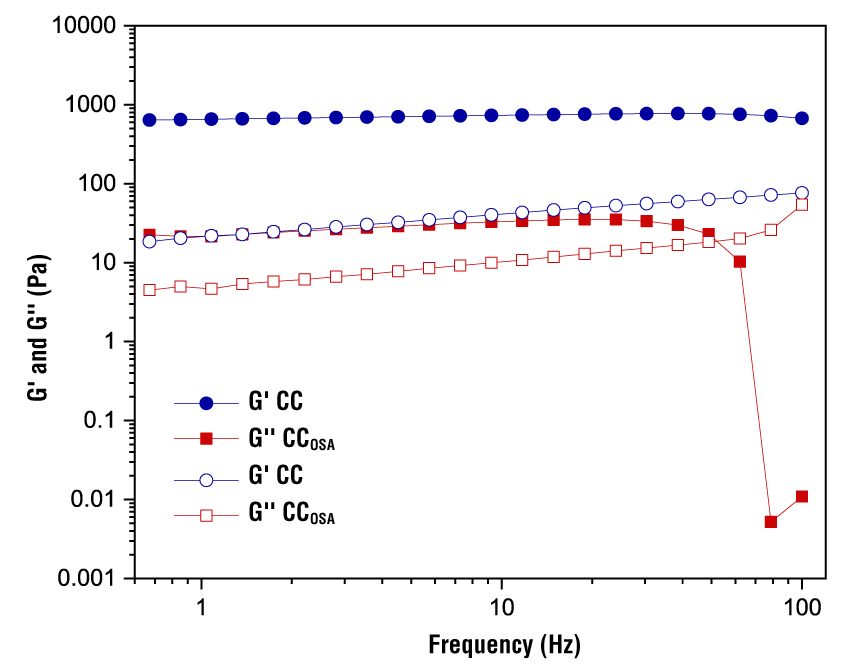
Changes in storage (G’) and loss (G’’) moduli as a function of frequency for CC and CCOSA gels are shown in Figure 5. The magnitudes of G’ of CC were relatively higher than those of G’’, suggesting that the gels exhibited more elastic than viscous behavior. The storage modulus of CC increased over the entire frequency range, indicating the formation of interconnected networks resembling elastic gels. However, CCOSA gels exhibited regular increases in G’ and G’’ at frequency values below 25 Hz, while at higher values there was a gradual decrease up to 65 Hz, a frequency at which G’ decreased dramatically, accompanied by a change from elastic to viscous character. OSA modification of starch had a significant effect on the consistency of the gels. Zhang et al. (2021) point out that octenyl succinate groups in starch can modify its hydrophobicity by weakening intramolecular hydrogen bonds, as more hydroxyl groups interact with water molecules, which limits interactions in the amylose chain and reduces gel strength. This is more evident as the DS increases.
In vitro digestibility
Table 5 shows the digestibility percentage of the starches (CC and CCOSA). As can be seen, the ARD fraction decreased significantly in CCOSA (45.65 ± 0.50 %) compared to CC (66.7 ± 0.59 %). This reduction is mainly due to the substitution of OH groups by bulky octenyl succinate groups in the starch structure, which limits the accessibility of digestive enzymes, such as amylase, to the interior of the starch granule. Yao et al. (2020) obtained similar results and reported that modification with OSA has a positive effect by decreasing the ARD fraction.
Table 5 In vitro digestibility of native (CC) and octenyl succinic anhydride modified (CCOSA) cacahuacintle corn starch.
| Type of starch | RDS (%) | SDS (%) | RS (%) |
|---|---|---|---|
| CC | 66.74 ± 0.59 a | 14.85 ± 0.37 b | 21.74 ± 0.02 b |
| CCOSA | 45.65 ± 0.50 b | 25.86 ± 0.09 a | 28.49 ± 0.05 a |
RDS: rapidly digestible starch; SDS: slowly digestible starch; RS: resistant starch. Data are expressed as the mean ± standard deviation. Means with the same letters within each column do not differ statistically (Tukey, P ≤ 0.05).
In contrast to CC, CCOSA starch exhibited a significant increase in its SDS content. This variation in the digestibility profile is attributed to the structural rearrangement of the starch granule, since the octenyl succinate groups formed act as steric barriers, which hinders the access of the enzymes amyloglucosidase and pancreatic alpha amylase to the glycosidic bonds, and, consequently, the digestion rate decreases (Zhang et al., 2017). Likewise, a significant increase in RS content in MCOSA was observed, compared to CC. This increase in RS is nutritionally relevant, since this component acts as dietary fiber by modulating the postprandial glycemic response. Modification with OSA has proven to be an effective strategy to increase RS content, which opens new perspectives for the development of functional foods with metabolic health benefits (Zhang et al., 2017).
Due to its low digestibility, CCOSA starch is suitable for applications in specialty food systems, such as slow-digesting baked foods and controlled release systems for bioactive compounds (Cortés-Viguri et al., 2021; Shi et al., 2022).
Conclusions
Cacahuacintle corn starch, both in its native form and modified with OSA, exhibits distinct physicochemical, structural and rheological characteristics. Modification with OSA significantly decreased amylose content and increased amylopectin content. In addition, it affected the morphological and structural properties of starch granules by increasing granule size, presenting a bimodal particle size distribution and showing significant changes in starch granule surface morphology. In vitro digestibility showed a reduction in rapidly digestible starch, as well as an increase in slowly digestible starch and resistant starch in CCOSA, compared to its native form.

