


 texto en
  Inglés (pdf)
 Artículo en XML
 Referencias del artículo
 Enviar artículo por email
 Citado por SciELO
  Similares en
SciELO
Similares en
SciELO 
 Permalink
Introduction
The architecture and morphometry of plants play an essential role in their growth and adaptation to diverse environments (Perreta & Vegetti, 2005). Understanding these parameters in disturbed areas is essential for comprehending how plants interact with their surroundings and how they can contribute to social well-being through urban and peri-urban forest planning and management. In Mexico, such information is scarce and primarily focused on agroecosystems (Camacho Moreno et al., 2017), tropical forests (Beltrán-Rodríguez et al., 2017; Interián-Ku et al., 2009), and evergreen forests (Pineda-Herrera et al., 2011). However, to date, there are no records of studies on tree architecture in urban and peri-urban environments. In this context, the Australian oak (Grevillea robusta A. Cunn. ex R. Br.) emerges as a widely utilized tree species in Mexico for reforestation in these environments (Mancilla Morales et al., 2024; Saavedra-Romero et al., 2019), owing to its rapid growth (Martiarena et al., 2013) and appearance of the species (Giambra et al., 2019).
The uniqueness and beauty of G. robusta make it a popular tree for landscaping in urban areas (Giambra et al., 2019; Ramos Palacios, 2019), a characteristic that has prompted research interest. For instance, Guigues Atoche (2019) analyzed tree measurement characteristics in G. robusta seedlings to assess the effect of different substrates to produce plants intended for urban reforestation in Lima, Peru. Similarly, Singh et al. (2020) evaluated the use of G. robusta for mitigating the impact of vehicular emissions along roadsides and medians in Uttarakhand, India, finding that the species has potential for urban greening with air quality benefits. Another study by MacGregor-Fors (2008) in urban areas of Guadalajara, Mexico, revealed that the Australian oak supports higher bird diversity than other tree species. However, despite the abundance of information on the species, there is no evidence of studies describing its architecture and morphometry. This represents a challenge for urban planners aiming to integrate the species effectively into these environments.
G. robusta was taxonomically described in 1830 by Allan Cunningham and Robert Brown, who classified it within the order Proteales, family Proteaceae, subfamily Grevilleoideae, and tribe Grevilleeae (Brown, 1830). Its natural distribution is in western Australia, and it is generally a large tree (reaching heights of up to 45 m in natural forests), semi-deciduous, with pyramid-shaped crown, thick branches, and a pronounced tendency for bifurcation. Its stem is straight with abundant branching. The bark is light gray, thick, and deeply furrowed; internally, it is fibrous, bitter, and whitish (Chudnoff, 1984). The tree develops a deep root system, leaves are partially bipinnate, alternate, with divided leaflets and lighter and silkier on the underside; the upper side is smooth dark green, and the underside is ashy and silky (Rojas-Rodríguez & Torres-Córdoba, 2020). Australian oak is commonly used as an ornamental plant for landscaping and roadside plantings or as a shade tree (El-Khateeb et al., 2023), as well as in coffee plantations to provide shade (Schuster et al., 2023); in some countries, it has been used as a forest species due to its rapid growth and potential as a timber tree (Begazo Curie & Jave Nakayo, 2018).
In this study, G. robusta, belonging to the group of heliophyte plants (Begazo Curie & Jave Nakayo, 2018), was considered because of its importance as a species commonly used in urban and peri-urban reforestations in Mexico (Alanís-Rodríguez et al., 2022; Velasco Bautista et al., 2013). The objective of this study was to describe the architecture and analyze the morphometry of G. robusta in five diameter categories under the following hypotheses: a) the architectural model is the same among diameter categories and b) tree biomass correlates positively with diameter at breast height, maintaining constant tree measurement characteristics despite variations in their increase.
Materials and Methods
The study was conducted at the Universidad Autónoma Chapingo and Colegio de Postgraduados Campus Montecillo in the municipality of Texcoco, Estado de México, Mexico, between the coordinates 19° 29' 43.68" - 19° 27' 16.01" N and 98° 53' 2.98" - 98° 53' 25.63" W, at an elevation of 2 250 m, average annual temperature of 17.2°C and total annual precipitation of 598.6 mm (Servicio Meteorológico Nacional, 2023). Field surveys identified two areas with the presence of G. robusta (Figure 1), where only 31 trees were recorded due to the limited number of individuals in the study area. These trees exhibited various morphological characteristics and were free from pests and diseases. The 31 trees were categorized into five diameter classes (DC) with a 5 cm range (Pineda-Herrera et al., 2019): DC 10 = 7.5-12.49 cm (three trees), DC 15 = 12.5-17.49 cm (five trees), DC 20 = 17.5-22.49 cm (14 trees), DC 25 = 22.5-27.49 cm (six trees), and DC 30 = 27.5-32.49 cm (three trees). These trees were planted in a peri-urban environment and grow in green areas (road medians and gardens) with an Antrosol soil type, which originates from modifications due to human urbanization activity (Castellanos Vargas et al., 2017). Most of the individuals grow in open fields, with no significant interference from light or wind. Although the planting distances vary, the smallest recorded distance between individuals is 3 m. There is some overlap in the crowns, suggesting moderate but not predominant intraspecific competition. Conditions favor growth without physical obstacles.
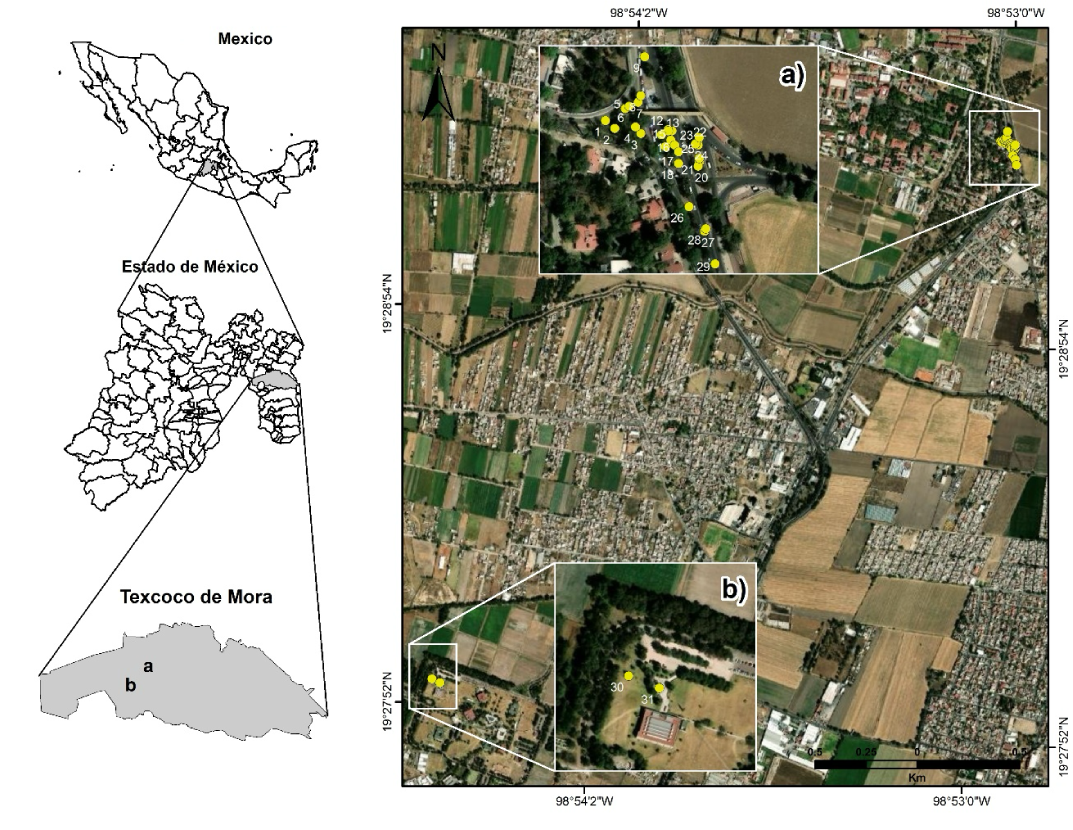
Figure 1 The data collection area was located in Texcoco, Mexico, with two specific sites: a) Universidad Autónoma Chapingo, where individuals 1 to 29 of Grevillea robusta were recorded, and b) Colegio de Postgraduados Montecillo Campus, where individuals 30 and 31 of G. robusta were documented.
Table 1 shows the variables commonly used to describe tree morphology to determine the architecture that best describes G. robusta. To complement this information, photographs were taken of the individuals that best represent the identified models; additionally, the species and its structures (branches, leaves, flowers, and fruits) were schematized. The morphological terminology described in Table 1 has been classically established by experts in the field, such as Tomlinson (1983) and Hallé et al. (1978), and supported by more recent research, including that of Chomicki et al. (2017) and Interián-Ku et al. (2009).
Table 1 Morphological variables used to determine the architectural model of Grevillea robusta.
| Variable | Categories |
|---|---|
| Growth main stem | Pattern: monopodial or sympodial |
| Shape: determinate or indeterminate | |
| Activity: proleptic or sylleptic | |
| Branching | Pattern: monocasial, dicacial, polycasial |
| Orientation and symmetry | Orthotropic, plagiotropic, combined |
| Order | First order, second order, third order main stem, etc. |
| Branch insertion angle | Ascending (16° to 45°), diffuse (46° to 75°) |
| Branch length | Long, short |
| Internode length | Long (macroblasts), short (brachyblasts) |
| Reproductive structures | Axillary or apical position |
| Inflorescence type: complex monopodial (panicles) or sympodial cymoid | |
| Reiterations | Total or partial, adaptive or traumatic, proleptic or sylleptic |
The variables were measured based on the studies of Interián-Ku et al. (2009) and Camacho Moreno et al. (2017): diameter at breast height (DBH) at 1.30 m, total height (TH), crown height, first branch height, first, second, and third order branches length, stem internodes length, crown cover, first, second and third order branch insertion angle, leaf blade length, and leaf base length (petiole); for the last two variables, five samples per individual were taken. The data were subjected to normality and homogeneity tests; for those variables that were not in compliance with these assumptions, a logarithmic transformation was applied. An analysis of variance for unbalanced samples (ANOVA; Zavaleta et al., 2023) was performed to mitigate the negative impact of the disproportion in sample sizes by diameter class, thereby providing results that more accurately reflect the true differences between the studied variables. Post hoc multiple comparison tests using the Tukey-Kramer method were also conducted, with a 95 % confidence level (García-Osorio et al., 2020). These tests aimed to identify significant differences between diameter classes for all measured variables. To evaluate differences between architectural models, a Student's t-test was applied with a 95 % confidence level (Beltrán-Rodríguez et al., 2022). All statistical analyses were performed using R software version 3.2.5. (R Core Team, 2023).
In urban and peri-urban areas, it is essential to understand the maximum height and cover that trees can reach under specific conditions. In this study, to model dominant height growth, the total height of each individual was considered according to diameter at breast height. Table 2 indicates the three growth models with nonlinear structure that were applied to fit the tree height data: Schumacher (Schumacher, 1939; Guzmán-Santiago et al., 2023), Chapman-Richards (Richards, 1959; García-Cuevas et al., 2024) and Hossfeld IV (Hossfeld, 1822; García-Espinoza et al., 2023).
Table 2 Nonlinear equations fitted to estimate dominant height of Grevillea robusta trees in peri-urban areas of Texcoco.
| Equation | Model |
|---|---|
|
|
Schumacher |
|
|
Chapman-Richards |
|
|
Hossfeld IV |
HDom = dominant height, DBH = diameter at breast height (cm) at 1.3 m height, exp = exponential function, ln = natural logarithm and β0, β1, β2 = model fitting parameters.
To determine the dominant crown coverage (CCdom), crown coverage was analyzed in relation to diameter at breast height, following the methodology adopted by Báez-Hernández et al. (2016) and Hernández-Ramos et al. (2022a, 2022b). Crown coverage was estimated using the approach proposed by Zavaleta et al. (2023), which involves perpendicular measurements of the crown’s major and minor diameters. The estimation of dominant crown coverage was achieved by modeling the data through a simple linear regression (Bautista Cruz et al., 2022): CCDom = β 0 + β 1 DN; where, DBH represents diameter at breast height and β 0 and β 1 are the model fitting parameters.
Results
The smaller diameter categories (10 and 15) are characterized by stems exhibiting a sympodial growth pattern, with minimal differentiation between the main stem and first-order branches. Their growth form is indeterminate, with proleptic activity. Branching follows a polytomic pattern with orthotropic growth orientation. First- and second-order branches are abundant, while third-order branches are scarce, with ascending insertion angles. Branches and internodes show extended growth between segments, with preferential allocation toward the apex (acrotony). Reproductive structures are absent, and reiterations are partial. These characteristics align with the Stone model (Figure 2).
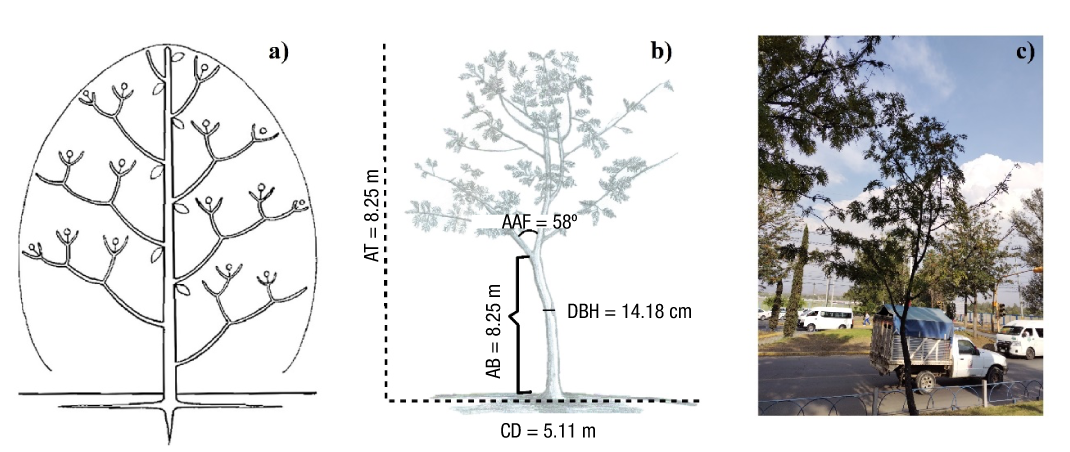
Figure 2 Architectural model of Grevillea robusta for diameter categories 10 and 15. a) Architectural structure idealized from the Stone model (Chomicki et al., 2017; Hallé et al., 1978). b) Schematic representation of G. robusta architecture for the Stone model; where AT: average total height, AAF: Average angle of first-order branch insertion, AB: Average height of the first branch, CD: Average crown diameter, DBH: Average diameter at breast height. c) Image of the sampled individual that most closely represents the Stone model.
The largest diameter categories (20, 25 and 30) are characterized by a differentiated stem and branches with a monopoidal stem growth pattern, determinate shape and proleptic activity. The branching pattern is polycassic with a combined growth tendency. First, second and third order branches are abundant, including higher order branches; the angle of insertion is diffuse in the first and second order branches and ascending in higher order branches. Branching is lateral (axial) and the architecture is monopoidal with immediate branch growth since the apical and axillary meristems branch at the same time. Branches have long growth between segments and preferential distribution towards the apex (acrotony); horizontal branches have lateral position with an ascending insertion angle. Inflorescences are Complex sympodial axillary (Figure 3a) with partial reiteration and fruits in the form of small woody capsules (Figure 3b); leaves are bipinnate (Figure 3c). All the characteristics described fit the Attims model (Figure 4).
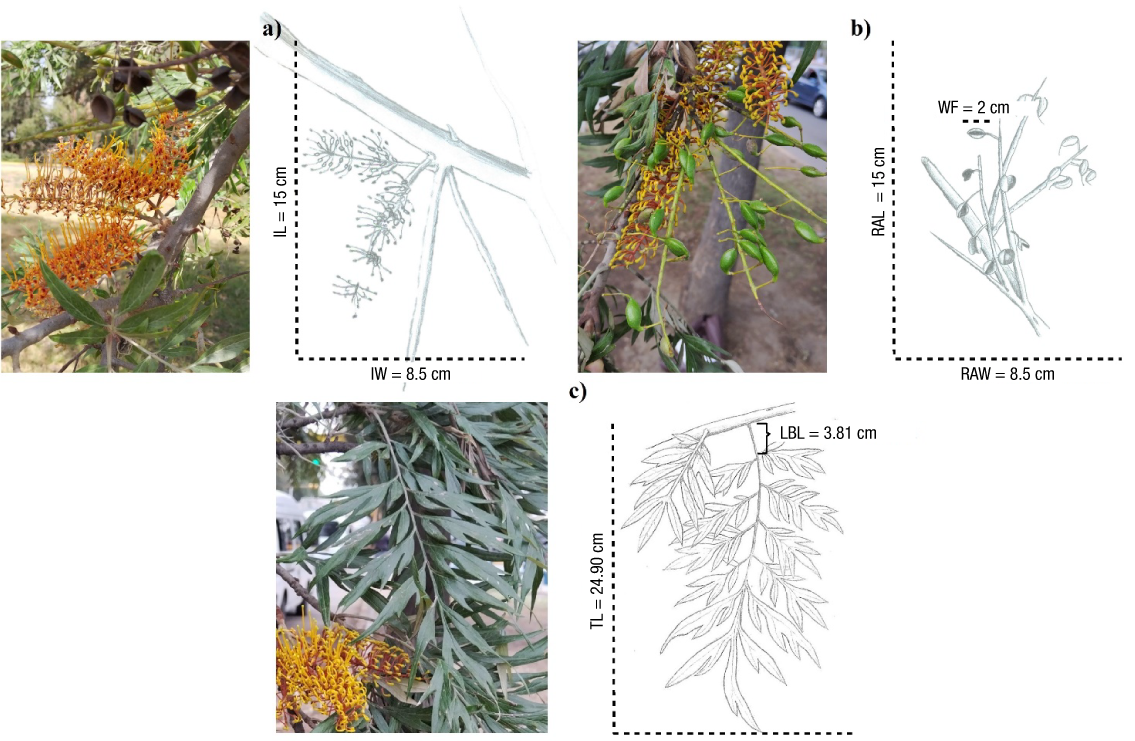
Figure 3 Average values of reproductive and foliar structures of Grevillea robusta: a) inflorescence (IL: Inflorescence length; IW: inflorescence width), b) fruits (RAL: raceme length; RAW: raceme width; WF: width of fruit) and c) compound leaf (TL: total length of leaf blade, LBL: leaf base length).
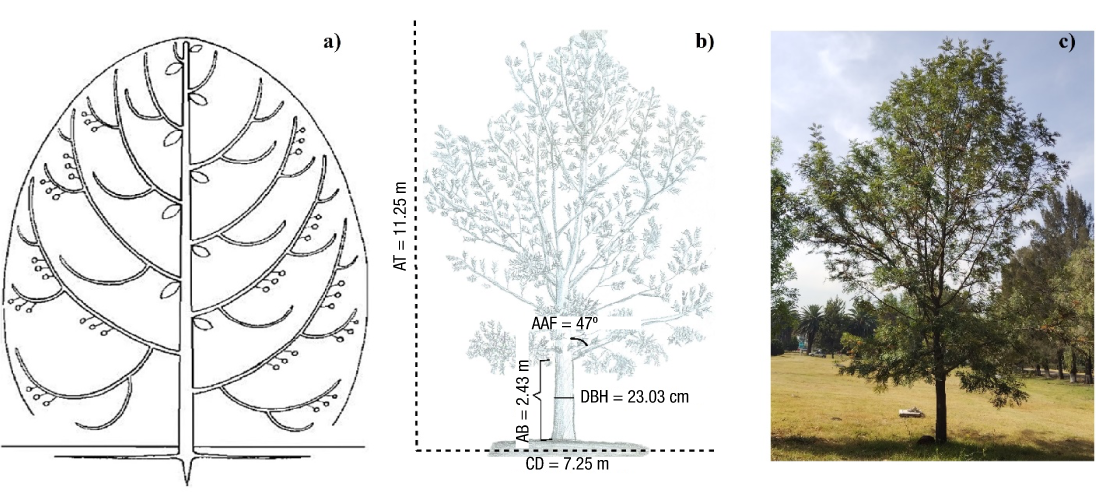
Figure 4 Architectural model of Grevillea robusta in diameter categories 20, 25, and 30 cm. a) Architectural structure idealized from the Attims model (Chomicki et al., 2017; Hallé et al. 1978). b) Schematic representation of the G. robusta architecture for the Attims model, where AT: average total height, AAF: Average angle of first-order branch insertion, AB: Average height of the first branch, CD: Average crown diameter, DBH: Average diameter at breast height. c) Image of the sampled individual best identified with the Attims model.
According to Table 3, analysis of variance between diameter categories showed highly significant differences (p ≤ 0.001) for diameter at breast height, total height, crown height and leaf blade length; highly significant (p ≤ 0.001) for leaf base length; and significant (p ≤ 0.001) for third-order branch length.
Table 3 Mean squares from the ANOVA for tree measurement characteristics of Grevillea robusta in peri-urban areas of Texcoco, Estado de México.
| Source of variation | df | DBH (cm) | TH (m) | CH (m) | HB (m) | FBL (cm) | SBL (cm) | TBL (cm) |
|---|---|---|---|---|---|---|---|---|
| DC | 4 | 0.701*** | 0.302*** | 0.498*** | 0.027 ns | 1.711 ns | 0.666 ns | 1.552* |
| Error | 0.004 | 0.023 | 0.025 | 0.079 | 0.709 | 0.746 | 0.464 | |
| Source of variation | gl | IL (cm) | LL (cm) | LBL (cm) | CC (m2) | AAF (°) | AAS (°) | AAT (°) |
| DC | 4 | 0.039 ns | 0.057*** | 2.756** | 0.447 ns | 613.40 ns | 0.08 ns | 142.23 ns |
| Error | 0.177 | 0.006 | 0.663 | 0.183 | 346.70 | 0.14 | 240.67 |
DC = diameter category; df = degrees of freedom. Variables: DBH = diameter at breast height at 1.3 m height, TH = total height; CH = crown height; HB = height to first branch; FBL, SBL and TBL = first, second and third order branch length,; IL = internode length; LL= leaf blade length; LBL = leaf base length; CC = crown cover; AAF, AAS and AAT = first, second and third order branch insertion angle. *** Highly significant differences (p ≤ 0.001); ** very significant differences (p ≤ 0.01); * significant differences (p ≤ 0.05); ns = no significant differences (p > 0.05).
In relation to tree measurement characteristics according to diameter category, significant differences (Tukey-Kramer, p ≤ 0.05) were observed in six of the 14 attributes shown in Table 4. Individuals in the largest categories (DC 30) were prominent in diameter at breast height, total height and leaf blade length. In contrast, intermediate diameter categories (DC 20 and 25) showed different behavior in total height, crown height, third order branch length and leaf blade length compared to the largest (DC 30) and smallest (DC 10) diameter categories. The lowest diameter categories had the lowest average values for diameter at breast height, total height, crown height, leaf blade length and leaf base length. These results highlight variations in tree-measurement characteristics in relation to diameter category, showing distinctive patterns of growth and development in different segments of G. robusta population.
Table 4 Average values of tree measurement characteristics for Grevillea robusta in peri-urban areas of Texcoco.
| Diameter category (cm) | N | DBH (cm) | TH (m) | CH (m) | HB (m) | FBL (cm) | SBL (cm) | TBL (cm) |
|---|---|---|---|---|---|---|---|---|
| DC 10 | 3 | 10.03 a | 5.90 a | 3.86 a | 2.04 a | 30.00 a | 25.00 a | 17.67 ab |
| DC 15 | 5 | 16.66 b | 9.66 b | 7.07 b | 2.60 a | 65.80 a | 46.00 a | 13.80 b |
| DC 20 | 14 | 19.75 c | 10.78 bc | 8.29 bc | 2.49 a | 86.50 a | 51.71 a | 47.07 a |
| DC 25 | 6 | 24.58 d | 11.53 bc | 9.20 cd | 2.33 a | 62.83 a | 29.00 a | 38.83 a |
| DC 30 | 3 | 35.27 e | 12.78 c | 10.40 d | 2.38 a | 100.00 a | 39.00 a | 36.00 a |
| LSD | 0.136 | 0.296 | 0.311 | 0.548 | 1.712 | 1.678 | 1.327 | |
| Diameter category (cm) | N | IL (cm) | LL (cm) | LBL (cm) | CC (m2) | AAF (°) | AAS (°) | AAT (°) |
| DC 10 | 3 | 43.00 a | 23.03 a | 3.15 a | 35.55 a | 55.33 a | 40.67 a | 31.00 a |
| DC 15 | 5 | 54.80 a | 24.05 a | 3.78 b | 32.89 a | 43.80 a | 31.20 a | 37.60 a |
| DC 20 | 14 | 50.00 a | 25.20 b | 3.86 b | 29.25 a | 55.00 a | 41.71 a | 42.07 a |
| DC 25 | 6 | 52.83 a | 25.50 b | 3.99 b | 50.67 a | 42.00 a | 41.33 a | 46.33 a |
| DC 30 | 3 | 41.33 a | 26.73 c | 4.29 b | 56.20 a | 73.33 a | 10.00 a | 38.00 a |
| LSD | 0.817 | 1.589 | 0.661 | 0.831 | 36.247 | 0.728 | 30.200 |
N = number of trees. LSD = Least significant difference. Values followed by equal letters are not statistically different among diameter categories according to the Tukey-Kramer test (p = 0.05). DBH = diameter at breast height at 1.3 m height, TH = total height; CH = crown height; HB = height to first branch; FBL, SBL and TBL = first, second and third-order branch length; IL = internode length; LL= leaf blade length; LBL = leaf base length; CC = crown cover; AAF, AAS and AAT = first, second and third order branch insertion angle.
Table 5 shows the results of the Student's t-test for the comparison of tree measurement characteristics, according to the models identified for G. robusta. Differences are highly significant (p ≤ 0.001) for diameter at breast height, total height, crown height and leaf blade length; moreover, significant differences (p ≤ 0.05) were observed in leaf base length and third-order branch length.
Table 5 T-student’s values of tree measurement characteristics of Grevillea robusta between the identified architectural models (Attims vs. Stone) in peri-urban areas of Texcoco, Estado de México.
| Variable | T1-T2 | Lower limit | Upper limit | T value | Degrees of freedom | Probability (p ≤ 0.05) |
|---|---|---|---|---|---|---|
| Diameter at breast height (1.3 m) | 8.86 | 4.53 | 13.18 | 4.19 | 29 | 0.0002*** |
| Total height | 2.98 | 1.35 | 4.62 | 3.72 | 29 | 0.0008*** |
| Crown height | 2.94 | 1.55 | 4.33 | 4.32 | 29 | 0.0002*** |
| Height to first branch | 0.03 | -0.20 | 0.26 | 0.24 | 29 | 0.8147 ns |
| First order branch length | 0.52 | -0.30 | 1.33 | 1.30 | 29 | 0.2031 ns |
| Second order branch length | 0.44 | -0.27 | 1.16 | 1.27 | 29 | 0.2133 ns |
| Third order branch length | 0.99 | 0.44 | 1.54 | 3.67 | 29 | 0.0010** |
| Internode length | 0.01 | -0.33 | 0.35 | 0.08 | 29 | 0.9359 ns |
| Leaf blade length | 1.81 | 1.08 | 2.54 | 4.93 | 153 | <0.0001*** |
| Leaf base length | 0.41 | 0.11 | 0.71 | 2.68 | 153 | 0.0082** |
| Canopy cover | 0.02 | -0.38 | 0.42 | 0.09 | 29 | 0.9288 ns |
| AAF | 5.88 | -10.67 | 22.42 | 0.73 | 29 | 0.4735 ns |
| AAS | 0.15 | -0.16 | 0.46 | 1.00 | 29 | 0.32.51 ns |
| AAT | 7.53 | -5.03 | 20.09 | 1.23 | 29 | 0.2301 ns |
T1 = Attims model average; T2 = Stone model average. AAF, AAS and AAT = first, second and third-order branch insertion angle. ***highly significant differences (p ≤ 0.001); **very significant differences (p ≤ 0.01); ns = no significant differences (p > 0.05).
Regarding the modeling of dominant height, it is observed that, except for the β2 parameter in the Chapman-Richards model (Table 6), all other fit parameters are significantly different from zero. This indicates that the Schumacher and Hossfeld IV models effectively capture the significant relationships among the variables considered in the fitting process. This suggests that these models effectively and accurately represent the significant relationships among the variables involved in the modeling of dominant height.
Table 6 Regression parameters of nonlinear models for total height of Grevillea robusta trees in peri-urban areas of Texcoco, Estado de México.
| Model | β0 | Significance | β1 | Significance | β2 | Significance |
|---|---|---|---|---|---|---|
| Schumacher | 17.8640 | 1.22E-11*** | 10.369 | 5.38E-06*** | --- | --- |
| Chapman-Richards | 13.1370 | 7.67E-12*** | 0.1300 | 0.0218 ** | 2.5424 | 0.1436 |
| Hossfeld IV | 13.8294 | 1.61E-08*** | 5.5828 | 0.00566 ** | 2.2863 | 0.0084** |
*** Highly significant differences (p ≤ 0.001) y ** very significant differences (p ≤ 0.01).
The Hossfeld IV model (Figure 5a) provided the best fit to the data distribution. It is notable for its strong statistical significance in all estimated parameters, with a recorded dominant height of 13.82 m, determined by the asymptotic limit defined by the β0 parameter (Figure 5b).
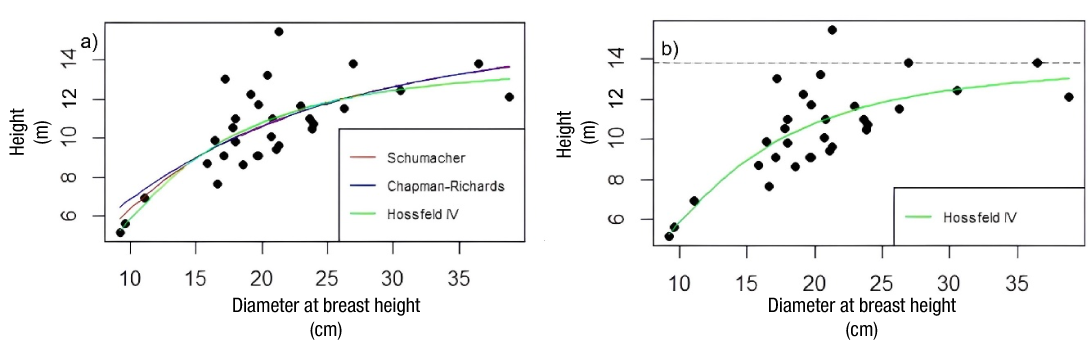
Figure 5 Graph of total height-diameter with the selected nonlinear models: a) Schumacher, Chapman-Richards, and Hossfeld IV; b) asymptote in the Hossfeld IV model.
For the dominant crown cover, a simple linear regression model was fitted (Figure 6), and its parameters were highly significant (Table 7), with an adjusted coefficient of determination (R²) of 0.821. This value is considered acceptable based on the volume of sampled data and indicates the model's reasonable ability to explain the variability in crown cover. The negative intercept is attributed to the scarcity of trees with small diameters in the sample. The parameter associated with diameter at breast height is positive and highly significant (p ≤ 0.001), showing the positive relationship with crown cover, at a rate of 2.76 m2 of crown cover per additional cm in tree diameter (Table 7).
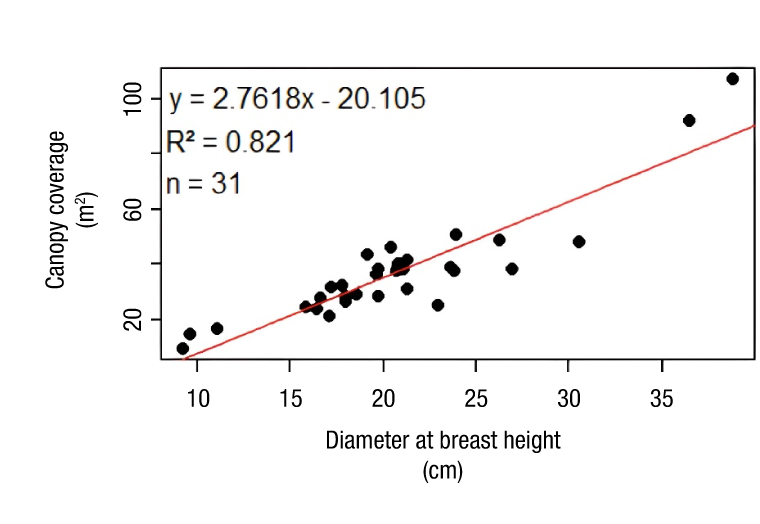
Figure 6 Simple linear regression for crown cover-diameter at breast height of Grevillea robusta in peri-urban areas of Texcoco, Estado de México.
Discussion
The analyses reveal that G. robusta undergoes ontogenetic changes (metamorphosis) according to the diameter class; that is, it shows changes in its architectural model in response to modifications in the development stage. Perreta and Vegetti (2005) reported similar findings and emphasize the need for a comprehensive diagnosis of the morphological and functional aspects of all the axis categories (branching) recognizable at each growth stage. Meanwhile, Chomicki et al. (2017) state that architecture is a consistent characteristic determined by genetics, but they also acknowledge that it is not a unidirectional process, rather a balance between the endogenous development of plants and the spatiotemporal factors in which they develop.
The results of this study provide consistent evidence to refute the first hypothesis, which suggested the absence of variations in the architectural model of the species among diameter classes. This study also highlights that both total height and crown height are reliable indicators for classification into height classes, thus corroborating the work of Beltrán-Rodríguez et al. (2017). Furthermore, the results show the presence of significant differences in tree measurement characteristics among diameter classes. Consequently, the hypothesis suggesting that an increase in tree biomass has no effect on tree measurement values is dismissed. However, it is important to consider that morphometry and architecture depend not only on the aboveground structure but also on the characteristics of the root system and the soil in which the trees develop, as described by Vennetier et al. (2015). Although the study focused on the aboveground part of the species, it is crucial to establish that root development is essential for the growth and shape of the aboveground structure. Particularly, in the study area, individuals grow in Antrosol soils, and their development is influenced by constant factors that alter their natural growth, such as those related to human activities.
Among the anthropogenic factors are pruning practices that focus exclusively on the lower branches, which do not alter the shape of the rest of the crown but do affect growth by reducing the leaf area. Valverde et al. (2020) demonstrated that defoliation in Gmelina arborea Roxb. individuals affects diameter growth and height by 39.0 % and 64.3 %, respectively. On the other hand, irrigation undoubtedly benefits tree functioning and growth, but soil compaction, resulting from vehicle and pedestrian traffic, negatively influences variables such as height and diameter (Jourgholami, 2018; Wang et al., 2019). Since the individuals in this study are located between 1 to 4 meters from the vehicle stream, it is expected that various factors are affecting growth. In this regard, Singh et al. (2020) compared G. robusta trees along the sides of roads with those in natural conditions and observed negative effects on physiological variables such as carbon assimilation rate, transpiration rate, and stomatal efficiency. This indicates that peri-urban conditions influence tree development; therefore, different growth processes can be expected.
It is important to note that adult trees, classified in the larger diameter categories, showed a strong alignment with the Attims model, characterized by more developed crowns, which provide greater shade and height, optimizing the use of vertical space. In contrast, younger individuals, belonging to the smaller categories, align with the Stone model, which requires more expansive spaces and exhibits less crown and height development compared to the Attims model. However, this characteristic facilitates light penetration, the regeneration of plant species in the surrounding area, pruning, and management, all of which are crucial for maintenance in urban environments (Chomicki et al., 2017; Hallé et al., 1978).
Changes in the architectural model may be influenced by the developmental stage of individuals, a situation that has already been documented by Camacho Moreno et al. (2017). In that study, the authors identified distinct growth patterns between larger and smaller diameter categories. Similarly, Forrester (2019) observed that trees with larger diameters exhibited higher values in total height and crown height compared to their smaller diameter counterparts. It is important to note that, in general, growth and development of species do not follow a linear pattern, but rather a logistic pattern, characterized by increasing and decreasing yields, as demonstrated by Salas-Eljatib (2020). This study also confirms that total height, crown height, third-order branch length, leaf blade length, and leaf base length tend to stabilize or show slower growth in two or more diameter categories, reinforcing their fit to the logistic model, a situation also reported by Zhu et al. (2021). This phenomenon could be related to both the developmental stage of the trees and the environmental pressures that individuals are exposed to.
The results reject the second hypothesis, since it was found that differences in diameter categories are linked to variations in growth characteristics. This aspect is crucial, especially because G. robusta is widely used in urban and peri-urban reforestations, as indicated by Mancilla Morales et al. (2024) and Saavedra-Romero et al. (2019). Due to the rapid growth rate of G. robusta in urban environments (Martiarena et al., 2013) it is essential to consider that changes in morphometry can occur in relatively short periods of time, which, in turn, can influence its aesthetic appearance regarding its diameter category (Giambra et al., 2019; Ramos Palacios, 2019).
Interián-Ku et al. (2009) also identified that diameter at breast height, total height, and crown height were significantly different (p ≤ 0.001) among poles saplings and seedlings of Caesalpinia gaumeri Greenm. and Gymnopodium floribundum Rolfe in a tropical forest in southern Yucatán. This additional evidence supports the idea that the developmental stages of trees have a significant influence on their morphological characteristics. Therefore, these studies validate the results and emphasize the importance of taking diameter class into account when analyzing the architecture and growth of tree species.
A detailed analysis of the morphometry and architecture of G. robusta contributes to the planning and management of urban and peri-urban plantations, an area that remains underexplored. However, the lack of information on environmental characteristics and management practices, such as pruning, irrigation, density management, and fertilization, may influence the morphometry of G. robusta and, consequently, its architecture. Including these factors in future research would provide a more comprehensive understanding of its adaptations and management in urban environments, optimizing the use of this species in limited spaces and enhancing reforestation strategies, as well as the planning of green areas in relation to the surrounding urban infrastructure.
The Hossfeld IV model stands out for its ability to represent the growth asymptote, as reflected in its parameter β0 (García-Cuevas et al., 2022). This stabilization is observed at a specific dominant height of 13.82 m in the growth of G. robusta under the conditions studied. However, this value differs significantly from those reported by Barth (2018), who noted heights of up to 40 m in plantations in Argentina, and by Katembo Kasekete et al. (2022), who reported heights of 25-35 m in the Republic of Congo. These discrepancies can be attributed to the development locations of the populations, as the cited studies focused on plantations for commercial purposes, in contrast to the highly modified peri-urban and urban areas examined in the present study.
Information on architecture, morphometry and tree structure is fundamental for urban infrastructure planning. According to Garcia Garcia et al. (2023), it is preferable to avoid locating trees under power lines or to ensure that the maximum height of trees is lower than that of the wiring. Furthermore, Lyytimäki (2017) indicates that the architecture and morphometry of urban trees can cause damage to the surrounding urban infrastructure, depending on their location, diameter category, and crown size; therefore, it is important to consider these parameters in the choice of species for urban planning.
The fitted canopy cover model does not show asymptotic stabilization to help identify a dominant canopy cover. This is attributed to the lack of data from trees in the 30 cm diameter category (DC 30) in the present study, which have a canopy cover ranging from 9 to 106 m2, so it would be desirable to expand the study area in future research. When comparing these results with those obtained in the urban park of Bosque de Chapultepec, Mexico City, with average crown cover between 24.9 and 31.7 m2 (Benavides Meza & Fernández Grandizo, 2012), a narrower cover interval is observed, probably due to a mature population with well-developed individuals; however, the model fit shows R2 = 0.43 regarding basal area, considerably lower than 0.82 obtained in the present study. This disparity can be attributed to the variability of species in Bosque de Chapultepec, in contrast to the single species approach (G. robusta). On the other hand, in the urban woodland of Montemorelos, Nuevo León, Mexico, canopy cover ranges from 5 to 107 m2 (Canizales Velázquez et al., 2020), a range very similar to that examined in this study, suggesting that variability in canopy cover may be influenced by common factors in diverse urban environments.
Conclusions
The morphological characteristics and branching patterns observed confirm the alignment of G. robusta with the Stone model for smaller diameter categories and the Attims model for larger diameter categories. This indicates that tree diameter category and growth model can affect tree measurement and morphometric attributes of the species. Although the sampling design was unbalanced due to the limited number of individuals in the study area, advanced statistical techniques were applied to mitigate these effects, strengthening the validity of the results. Understanding the dominant height of the species can support its management in urban and peri-urban spaces. These findings are relevant for planning and utilizing the species as a widely used ornamental forest element, facilitating the identification of the most suitable diameter categories, heights, and growth models for diverse urban and peri-urban reforestation scenarios.

