


 nueva página del texto (beta)
 Inglés (pdf)
 Artículo en XML
 Referencias del artículo
 Enviar artículo por email
 Citado por SciELO
  Similares en
SciELO
Similares en
SciELO 
 Permalink
Introduction
Worldwide, 5 million 522 thousand 993 ha of mango are cultivated with an annual production of 54.83 million tons (Food and Agriculture Organization of the United Nations - Statistics Division [FAOSTAT], 2022). According to the Mexican agri-food authorities, the varieties Haden, Tommy Atkins, and to a lesser extent Ataulfo, Kent, Keith, Ori, and Manila, among others, have been grown in Mexico (SADER-SIAP, 2022). There is an established area of approximately 207,000 hectares, and the top five producing states are Chiapas with 38,775 ha; Sinaloa 34,560 ha; Nayarit 28,329 ha; Guerrero 27,001 ha; and Michoacán 26,224 ha. The latter state represents 12.66 % of the national area, with an approximate annual production of 180,000 tons, generating an economic impact of 55.47 million dollars per year.
In Michoacán, the Lombardía municipality has the largest established mango area with 4,597 hectares and an average annual yield of 6.03 t ha-1. It is important to highlight that most of the families living in this municipality depend mainly on the US$5.54 million income generated annually by this crop. Additionally, over the last decade, the established area in the municipality has remained constant within a range of 4,300 to 4,500 hectares (SADER-SIAP, 2022). It is also remarkable that in 2021, fertilizer prices increased by up to 100 %, such as urea, which currently costs around MXN 24,000 per ton.
Similarly, the majority of the established area in the municipality corresponds to the Haden variety with 2,973 hectares (SADER-SIAP, 2022). Producers assert that the majority of production costs are related to fertilization during the production process and are approximately 60 %. Generally, the type of production is conventional, which has resulted in an imbalance in the nutritional status of the soil and a crop dependent on fertilizers. Undoubtedly, this is a complex issue; on the one hand, price increases in fertilizers represent a constraint for the development of agriculture in the region, as producers have experienced a decline in their profit margins. Additionally, there is a lack of knowledge about the current status of the soil, resulting in a poor response to the application of fertilizers, economic waste, and environmental deterioration.
The nutritional aspect in mango production plays a very important role in productivity. Galán-Sauco (2009) points out that there are few studies carried out on crop extractions in mangoes and that they show different results according to cultivars and locations. In the Lombardía region, growers use foliar applications of fertilizers such as potassium nitrate, phosphonitrate, and urea in combination with mono ammonium phosphate (MAP) for flowering induction in an empirical way, and also perform fertiliser applications to the soil. This is a technology that has been in use for approximately 40 years and that today should be valued due to the high operating costs generated and the damage caused to the environment and specifically to the soil. García-Galindo et al. (2020) refer that chemical synthesis fertilizers are currently dosed and applied to soils incorrectly, using high quantities with low efficiency, causing salinity problems and soil pollution. Arce-Quesada (2020) reports that products obtained conventionally have higher total production costs than organic products, due to the demand and purchase of inputs, while organic production proposes low dependence on the purchase of external inputs. It is important to look at other more sustainable production technologies to solve the need for crop nutrition, such as the use of biofertilizers.
Regarding crop yield, some producers in the Lombardía region of Michoacán report yields of approximately 8 t ha-1 per year of the Haden variety, under a more sustainable production scheme and without excessive applications of chemical insecticides, only with induction to flowering by applying potassium nitrate via foliar application at 1 %. In the same area, yields of 5.80 t ha-1 per year are also reported, produced organically (SADER-SIAP, 2022), without using cutting-edge technologies during the production process, simply with the application of cow manure without pre-composting in doses of 30 kg tree-1, around the canopy and with minimal application of insect repellents to control some pests, mainly thrips.
There are interesting studies about fertilization assessments in mango cultivation in different locations, such as Ordaz-Gallegos et al. (2020) who conducted an investigation in Michoacán, Mexico on soil quality in three Kent and Haden mango orchards with trees between 11 and 30 years old: 1) organo-mineral (low doses of fertilizer and some organic amendments), 2) organic (soil and foliar biofertilization, compost, ashes, diatomaceous earth, and agroecological corridors with more than three species), and 3) conventional (mainly incorporated through chemical fertilization, pesticide application, without organic amendments); they reported for the organic orchard high productivity (20 t ha-1 ) with soil values of 3.5 % of OM; 1.13 % of N; 9.81 g kg-1 of P; in the organo-mineral 4.66 % of OM; 1.59 % of N; 16.48 g kg-1 of P and conventional 2.82 % of OM; 0.95 % N; 8.54 g kg-1 of P these last two with medium productivity.
In Veracruz, Mexico, Peralta-Antonio et al. (2015) evaluated the organic fertilizers vermicompost, bokashi, and poultry manure at 10 and 5 t ha-1 and doses 230-0-300 and 230-0-0-0 g NPK per tree on foliar nutrition of mango Manila Cotaxtla 2, Tommy Atkins, and Ataulfo varieties. They measured foliar concentrations of N, K, Ca, Mg, Zn, Fe, Mn, and Cu. Before flowering in g 100g-1 dry weight, Tommy Atkins showed the highest concentration of N at 1.36, Manila Cotaxtla 2 had the highest concentration of K at 1.20, and Mg at 0.09, while Ataulfo exhibited the highest concentration of Ca at 0.71. Before harvest in the same units, Manila Cotaxtla 2 displayed the highest concentration of N at 1.48, Tommy Atkins had the highest concentration of K at 2.19, and Ataulfo showed the highest concentration of Ca at 0.83 and Mg at 0.10. Regarding fertilization sources and prior to flowering in g 100 g-1 dry weight, N only showed differences in vermicompost and bokashi at 10 t ha-1 with numerical values of 1.39 and 1.28 respectively, which were higher than vermicompost 5 t ha-1 with 1.27. For K the treatments of bokashi 10 t ha-1, 230-0-0 g N-P-K per tree, poultry manure, and bokashi 5 t ha-1 and control were different. For Ca and Mg all treatments were the same. Before harvest in g 100g-1 dry weight, for with N for the treatments gallinaza 10 t ha-1, 230-0-300 g N-P-K per tree, 230-0-0 g N-P-K per tree, poultry manure 5 t ha-1, bokashi 5 t ha-1 and control, were equal. For K and P, there were no differences, and for Mg, the treatments of vermicompost, bokashi and chicken manure 10 t ha-1, 230-0-300 g N-P-K per tree, vermicompost, bokashi and poultry manure 5 t ha-1 were different with 0.09, 0.10, 0.08, 0.09, 0.08, 0.10, and 0.10, respectively. Finally, they concluded that the differences in N and K concentrations among cultivars could be related to the nutrient extraction capacity of each cultivar and cultivation conditions.
Corrales-Garriga et al. (2003) conducted an experiment where they studied doses of earthworm humus [HL] at 0, 10, 20, and 30 kg per plant; all combined with 0, 50, and 100 % of mineral fertilizer [FM], on mango yield and fruit quality, in a low-density alitic soil, planted with the ten-year-old Super-Haden variety and under rainfed conditions in the province of Camagüey, Cuba. They reported the highest yields for the treatments with interaction [HL + FM], were HL (10 % kg plant) + FM at 100 % (508-90-330 g plant) with 190 fruits with an average fruit weight of 1.30 kg; HL (10 % kg plant) + FM at 50 % (254-45-165 g plant) with 180.7 fruits with an average fruit weight of 1.30 kg. The treatments with HL (30 kg plant) without FM obtained a value of 53.3 fruits and 1.05 kg of average fruit weight, while the control had 63.3 fruits and 0.81 kg of average fruit weight. The treatments with the highest TSS content were HL (10 kg plant) + FM at 100 % (508-90-330 g plant) with 16.2 % TSS and HL (10 % kg plant) + FM at 50 % (254-45-165 g plant) with 15.4 % TSS. The treatments that had the greatest effect on soil OM content were HL (30 kg plant) +(508-90-330 g plant) with 3.61 % and (30 kg plant) + FM at 50 % (254-45-165 g plant) with 3.53 %.
The objective of this study was to evaluate in the field different types of biofertilizers for the production of Haden mango in the Lombardía municipality, Michoacan, Mexico.
Material and Methods
Experiment site
The study was established at 19° 08' 20.5" N latitude, 102° 02' 35.1" W longitude and altitude 597 masl (Google Earth, 2022), in the municipality of Lombardía, Michoacán. The location corresponds to a tropical depression between the mountainous axes, which limit it to the north and south with the Neovolcanic axis and the Sierra Madre del Sur del Pacífico, Mexico (García, 1987). The soil type is pelic-clay vertisol, with a dry BS1 climate type, warm semi-dry (Instituto Nacional de Estadística y Geografía [INEGI], 2022), and average annual temperature of 28 °C and 1,000 mm of annual precipitation (Comisión Nacional del Agua [CONAGUA], 2022).
Orchard characterization
The experimental orchard was characterized by having mango trees of the Haden variety, 22 years old, with a tall growth habit of approximately 14 m in height, gravity irrigation, soil covered with endemic vegetation of the region and cultivation practices with traditional agricultural machinery and equipment. The planting frame was 10 x 10 m, resulting in a population density of 100 trees per hectare, covering a total area of 10 ha.
Agronomic management of the orchard
As a reference point, a soil fertility analysis was conducted before the experiment and sent to a certified laboratory. Based on this, the nutrient dynamics of the crop were determined, and the treatments were prepared by hand, manually applied to the soil in the drip zone of the trees.
The plantation underwent water stress for eight weeks in October and November 2022 to induce flowering. Subsequently, treatments were applied, and irrigation commenced. Irrigation rates were determined based on crop water needs, climate, and soil conditions, with intervals of every 15 days, and irrigation rates ranging from 11 to 15 cm from December to June. Water consumption was calculated using the practical method, incorporating data from Irrigation District 097 "Lázaro Cárdenas" of the Mexican Environmental Authority (SEMARNAT), considering reference evapotranspiration and crop coefficient.
Phytosanitary management was carried out according to the program of the grower. Wettable sulfur powder 98.5 % was applied via foliar at a dose of 5 g L-1 to prevent the powdery mildew (Oidium mangifere) even though no fungal diseases were observed. Regarding pests, only thrips (Frankinella occidentalis) were present, and garlic extract was applied at a dose of 5 mL L-1 to the foliage.
Experimental design
The experimental design used was completely randomized with an equal number of experimental units per treatment. Each treatment consisted of ten trees, forming a row. Each tree was an experimental unit, with six treatments, totaling 60 sampled trees.
Treatments
The following fertilizer sources were evaluated:
T1) Vermicompost mineralized at 20 % with rock phosphate fertilizer, in doses of 50 kg tree-1 and foliar application of liquid vermicompost humus at 2 % (artisanally produced leachate). The chemical composition was: pH 7.8, NH4 28 ppm, NO3 620 ppm, total N 728 ppm, P 46 ppm, K 400 ppm, SO4 2 160 ppm, Ca 119 ppm, and Mg 30 ppm + Glutamic-Green 99% from Green Smport Solutions (99 % glutamic acid), in doses of 0.5 g L-1 + Inex-A® adjuvant from Cosmocel (ethoxylated fatty alcohol 20.2 %, polydimethylsiloxane 1.0 %) 1 mL L-1.
T2) Non-mineralized vermicompost at a dose of 25 kg tree-1 + phosphonitrate fertilizer (NH4 15.5 %, NO3 15.5 %, and P2O5 4.0 %) from Tepeyac®, 2 kg tree-1 and foliar application of 1 % liquid vermicompost humus (artisanally produced leachate). The chemical composition of the leachate was: pH 7.8, NH4 28 ppm, NO3 620 ppm, total N 728 ppm, P 46 ppm, K 400 ppm, SO4 2 160 ppm, Ca 119 ppm and Mg 30 ppm + Floramin de Química SAGAL, S.A de C.V (liquid foliar fertilizer based on amino acids 30 %, P 15 %, K 16 %, Fe 420 mg L-1, Zn 2,490 mg L-1, Mn 590 mg L-1, Cu 550 mg L-1, Mg 510 mg L-1, Mo 53 mg L-1, B 367 mg L-1, vitamins 40 mg L-1) in doses of 2 mL L-1 + Inex-A® adjuvant from Cosmocel (ethoxylated fatty alcohol 20.2 %, polydimethylsiloxane 1.0 %) 1 mL L-1 .
T3) Phosphonitrate fertilizer (NH4 15.5 %, NO3 15.5 %, and P2O5 4.0 %), 4 kg tree-1 + foliar application of Floramin de Química SAGAL, S.A de C.V (liquid foliar fertilizer based on amino acids 30 %, P 15 %, K 16 %, Fe 420 mg L-1, Zn 2,490 mg L-1, Mn 590 mg L-1, Cu 550 mg L-1, Mg 510 mg L-1, Mo 53 mg L-1, B 367 mg L-1, vitamins 40 mg L-1) in doses of 4 mL L-1 + Inex-A® adjuvant from Cosmocel (ethoxylated fatty alcohol 20.2 %, polydimethylsiloxane 1.0 %) 1 mL L-1.
T4) Improved Supermagro SMR (liquid fertilizer prepared by hand based on whey, water, molasses, and minor elements Fe, Zn, B, Mg, Mn, CoCl2, Na2 MoO4 through an anaerobic fermentation process) 20 L tree-1 + foliar application of SMR at 2 % + Inex-A® adjuvant from Cosmocel (ethoxylated fatty alcohol 20.2 %, polydimethylsiloxane 1.0 %) 1 mL L-1.
T5) Bocashi biofertilizer (artisanally prepared biofertilizer based on clay soil, rice husk and polish, molasses, yeast, and beef manure), 20 kg tree-1 + foliar application of humic acids at 60 % and fulvic acids 4 mL L-1 + Inex-A® adjuvant from Cosmocel (ethoxylated fatty alcohol 20.2 %, polydimethylsiloxane 1.0 %) 1 mL L-1.
T6) Control, water + Inex-A® adjuvant from Cosmocel (ethoxylated fatty alcohol 20.2 %, polydimethylsiloxane 1.0 %) 1 mL L-1.
The biofertilizers were applied to the soil manually around the drip zone of the banded trees at a depth of 20 cm and at a distance of 1.8 m from the trunk where most of the roots are located. The chemical fertilizer was applied in four wells at the same depth and distance.
Study variables
The variables recorded were as follows:
1) Inflorescences (No m2). The number of inflorescences (panicles) per square meter of tree canopy was manually quantified.
2) Polar diameter (cm). Fruits from a square meter of tree canopy were cut and quantified. Subsequently, the fruit size was measured vertically with a 3-meter-long tape measure when the fruit reached physiological maturity.
3) Equatorial diameter (cm). Similar to the previous variable, the same procedure was followed, measuring the fruit size horizontally.
4) Length/width ratio (1:1). The average values of the polar diameter between the equatorial diameter were used to calculate this ratio.
5) Fruit weight (kg). The number of fruits obtained for polar and equatorial diameter variables was weighed on a Truper BASE-5EP digital scale with a capacity of 5 kg.
6) Fruits per tree (no.). All manually harvested fruits were counted.
7) Total Soluble Solids (°Brix). Measured using refractometry with a digital Atago® Model PR-100 refractometer on fruits that reached physiological maturity (°Brix).
Yield and fruiting index variables were determined by means of equations:
8) Yield (kg ha-1). The average values of the variables fruit weight and fruit per tree were used (Equation 1). [Fruit weight kg * fruits per tree] * [Trees ha⁻¹] = Yield (kg ha⁻¹).
9) Fruiting index (F m2). Assuming that the tree canopy is similar to
the geometric shape of a truncated cone, the Lateral Surface (Avilán-Rovira & Mazzi, 1973) was first
calculated (Equation 2):
It is possible to associate the shape of the tree canopy with geometric figures to calculate or estimate the production area, and therefore, per unit of production area. This relationship is called the "Fruiting Index" (Figure 1) (Avilán-Rovira, 1980; Arroyo-Pozos et al., 2013).
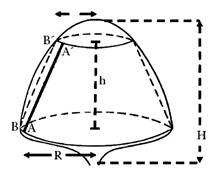
Figure 1 Lateral surface of the useful tree canopy in the shape of a truncated cone (Avilán & Mazzi, 1973; Aguilar-Ávila & Santoyo-Cortés, 2013).
Data collection was carried out after the application of the treatments, at 30 days for variable 1) Inflorescences and at 95 days (harvest date) for the other variables.
Statistical analysis
The statistical analysis began with the normality and homoscedasticity tests for data variances, followed by analysis of variance, and finally, the comparison of variable means (Tukey, p ≤ 0.05). All of this was conducted using the statistical package STATISTICA version 13.3.
Results and Discussion
The soil analysis results (Table 1) showed a basic pH (Pérez-López 2013; Garrido-Valero, 1994), a high content of organic matter (Castellanos et al., 2000), very low levels of N and P (Villarroel, 1988), and Zn, moderately low content of K (Castellanos et al., 2000), B, and S (Molina, 2007), moderately high content of Ca (Castellanos et al., 2000), very high content of Mg, Mn, and Cu (Viets & Lindsay, 1973), high content of Fe (Castellanos, et al., 2000), very low content of Na (Castellanos et al., 2000), medium level in Cation Exchange Capacity [CEC] (Garrido-Valero, 1994; NOM-021-RECNAT-2000, 2002), very low Electrical Conductivity [EC] (Etchevers-Barra & Padilla-Cuevas, 2000), and clay loam texture (Villarroel, 1988).
Table 1 Chemical and physical characterization of the soil (0 to 30 cm depth) of the mango orchard.
| Determination | Unit | Result | Source |
|---|---|---|---|
| pH (1:2 H2O) | 7.92 | Jackson (1964) | |
| M.O. [Organic carbon] (Walkley and Black) | % | 3.34 | Jackson (1964) |
| N (NO3 , NH4 ) (Cadmium Column) | mg kg-1 | 5.30 | Cabrera-Molina et al. (2003) |
| P (P-Bray) | mg kg-1 | 16.90 | López-Aguilar et al. (2002), Álvarez-Sánchez & Marín-Campos (2011). |
| K [Extraction with ammonium acetate (by ICP Plasma] | mg kg-1 | 230 | López-Aguilar et al. (2002) |
| Ca [Extraction with ammonium acetate by ICP Plasma] | mg kg-1 | 2,700 | López-Aguilar et al. (2002) |
| Mg [Extraction with ammonium acetate by ICP Plasma] | mg kg-1 | 1,200 | López-Aguilar et al. (2002) |
| Na [Extraction with ammonium acetate by ICP Plasma] | mg kg-1 | 160 | López-Aguilar et al. (2002) |
| Fe (Extraction with DTPA by ICP Plasma) | mg kg-1 | 48 | Álvarez-Sánchez & Marín-Campos (2011) |
| Zn (Extraction with DTPA by ICP Plasma) | mg kg-1 | < LOQ† | Álvarez-Sánchez & Marín-Campos (2011) |
| Mn (Extraction with DTPA by ICP Plasma) | mg kg-1 | 41 | Álvarez-Sánchez & Marín-Campos (2011) |
| Cu (Extraction with DTPA by ICP Plasma) | mg kg-1 | 4.3 | Álvarez-Sánchez & Marín-Campos (2011) |
| B (Extraction with CaCl2) | mg kg-1 | 0.46 | Enriquez (1989) |
| S [Extraction with Ca(H2PO4) 2 *H2O] | mg kg-1 | 11.07 | Guerrero-Peña et al. (2001) |
| CEC | cmol(+) kg-1 | 24.63 | McKean (1993), NOM- 021-RECNAT-2000 (2002) |
| CE | dS m-1 | 0.404 | NOM- 021-RECNAT-2000 (2002) |
| Texture (sand-clay-silt) | % | 32-38-30 | Bouyoucos (1936) |
†Lower than the Practical Quantification Limit (8.00 mg kg-1) and it was not possible to perform the calculation; CEC: Cation Exchange Capacity; CE: Electrical Conductivity.
The results of the normality and homoscedasticity tests for data variances showed a normal distribution of the data along the straight line for all variables, confirming the reliability of the experiment.
The analysis of variance (P ≤ 0.05) indicated a statistically significant difference among the treatments for the Polar Diameter variable. However, for the other variables, no significant differences were observed (Table 2).
Table 2 Analysis of variance for each of the variables (p ≤ 0.05).
| Condition | MS Efect | MS Error | Degrees of freedom | F calculated | p-value |
|---|---|---|---|---|---|
| I (No m2) | 8.9268 | 11.7538 | 5.54 | 0.759483 | 0.583850 |
| PD (cm) | 0.7921 | 0.2184 | 5.54 | 3.627378 | 0.007810 |
| ED (cm) | 0.1852 | 0.0904 | 5.54 | 2.049554 | 0.090139 |
| (L/W) Re | 0.0017 | 0.0014 | 5.54 | 1.191738 | 0.328798 |
| FW (g) | 0.0027 | 0.0026 | 5.54 | 1.037526 | 0.407711 |
| FT (no.) | 457.1119 | 220.9658 | 5.54 | 2.068699 | 0.087492 |
| TSS (oBrix) | 3.2280 | 1.8591 | 5.54 | 1.736366 | 0.146269 |
| P (t ha-1) | 1.2004 | 0.5656 | 5.54 | 2.122093 | 0.080510 |
| FI (F/m2) | 0.0515 | 0.0249 | 5.54 | 2.068699 | 0.087492 |
CV = 68.35 %. I) Inflorescences; PD) Polar Diameter; ED) Equatorial Diameter; (L/W) Re) Length/Width Ratio; PW) Fruit weight; FT) Fruits per Tree; TSS) Total Soluble Solids; P) Performance; FI) Fruiting index.
The results of the Tukey mean comparison test (p ≤ 0.05), showed significant statistical difference in T2 for the variables Fruit per tree, Yield and Fruiting index, in T3 for the variables Inflorescence, Fruit per tree, Yield and Fruiting index (Table 3).
Table 3 Effect of treatments for all Tukey variables (p ≤ 0.05).
| Condition | T1 | T2 | T3 | T4 | T5 | T6 |
|---|---|---|---|---|---|---|
| I (No m2) | 12.30 b | 3.42 a | 5.66 ab* | 5.10 a | 4.20 a | 3.80 a |
| PD (cm) | 11.04 a | 10.54 a | 11.10 a | 11.20 a | 11.26 b | 10.66 a |
| ED (cm) | 8.89 a | 8.20 a | 8.08 a | 8.56 a | 8.67 a | 8.39 a |
| (L/W) Re | 1.24 a | 1.28 a | 1.37 a | 1.30 a | 1.29 a | 1.26 a |
| FW (g) | 515.40 a | 424.00 a | 452.33 a | 487.50 a | 502.60 a | 436.10 a |
| FT (no.) | 41.70 b | 13.42 ab* | 4.00 ab* | 9.80 a | 13.20 a | 4.00 a |
| TSS (oBrix) | 14.81 a | 14.14 a | 11.13 a | 14.55 a | 15.02 a | 14.11 a |
| P (t ha-1) | 2.16 b | 0.66 ab* | 0.19 ab* | 0.49 a | 0.66 a | 0.18 a |
| FI (F/m2) | 0.44 b | 0.14 ab* | 0.04 ab* | 0.10 a | 0.14 a | 0.04 a |
T1) Lombricompost mineralizada al 20 %, en dosis de 50 kg por árbol y aplicación foliar de humus líquido de lombriz al 2 % + ácido glutáminico al 99 % 0.5 g L-1; T2) Lombricompost sin mineralizar en dosis de 25 kg árbol-1 + fertilizante fosfonitrato (NH4 15.5 %, NO3 15.5 % y P2O5 4.0 %), 2 kg árbol-1 y aplicación foliar de humus líquido de lombriz al 1 % (lixiviado producido artesanalmente) pH 7.8, NH4 28 ppm, NO3 620 ppm, N total 728 ppm, P 46 ppm, K 400 ppm, SO4 2 160 ppm, Ca 119 ppm y Mg 30 ppm + fertilizante foliar líquido a base de aminoácidos 30 %, P 15 %, K 16 %, Fe 420 mg L-1, Zn 2,490 mg L-1, Mn 590 mg L-1, Cu 550 mg L-1, Mg 510 mg L-1, Mo 53 mg L-1, B 367 mg L-1, vitaminas 40 mg L-1 en dosis de 2 mL L-1 + adherente alcohol graso etoxilado 1 mL L-1; T3) Fertilizante fosfonitrato (NH4 15.5 %, NO3 15.5 % y P2O5 4.0 %), 4 kg árbol-1 + aplicación foliar de fertilizante foliar líquido a base de aminoácidos 30 %, P 15 %, K 16 %, Fe 420 mg L-1, Zn 2,490 mg L-1, Mn 590 mg L-1, Cu 550 mg L-1, Mg 510 mg L-1, Mo 53 mg L-1, B 367 mg L-1, vitaminas 40 mg L-1 en dosis de 4 mL L-1 + adherente alcohol graso etoxilado 1 mL L-1; T4) Super magro mejorado (SMM) 20 L árbol-1 + aplicación foliar de SMM al 2 %; T5) Biofertilizante bocashi 20 kg árbol-1 + aplicación foliar de ácidos húmicos al 60 % y fúlvicos 4 mL L-1; T6) Testigo (sin aplicación). I) Inflorescencias; PD) Diámetro Polar; ED) Diámetro Ecuatorial; (L/W) Re) Relación Longitud/Anchura; FW) Peso de fruto; FT) Frutos por Árbol; TSS) Sólidos Solubles Totales; P) Rendimiento; FI) Índice de fructificación. *Medias con una letra diferente son significativamente diferentes (p ≤ 0.05).
Inflorescences
The highest numerical value for this variable was observed for T1 with 12.30 No m2 of inflorescences or the equivalent of 231 inflorescences (panicles) per tree-1. In contrast, T6, the Control (without application), obtained a value of only 3.80 No m2 or 72 inflorescences per tree-1, and T3 with 5.66 No m2 of inflorescences or 107 inflorescences per tree-1 which presented a significant statistical difference (Table 3). Overall, the results for this variable reflected very distinct values when compared to those reported by Quijada (1999) for Haden mango, with 687 inflorescences (panicles) per tree under chemical fertilization with 9 % potassium nitrate. In another study, Miranda (2001) reported, for the same cultivar, 2.3 and 6.6 inflorescences per tree in the control (water application) through foliar and soil application, respectively. With 2 % potassium nitrate application through foliar and soil, 0.5 and 12 inflorescences per tree-1, with no significant statistical difference in both treatments. However, these values obtained in this research may attributed to the excessive height of the trees, which could have influenced the scarcity of inflorescences. In this regard, Avilán et al. (2005) described that the excessive vegetative development characterizes monoembryonic cultivars in the tropics, negatively affecting the flowering process and, consequently, plant productivity.
Polar Diameter, Equatorial Diameter, and Length/Width Ratio
These variables did not show significant statistical differences for any treatment. The polar diameter variable presented two numerical groups and the equatorial diameter and length-width ratio variables showed only one group.
T5 is distinguished by presenting the highest numerical values with 11.26 cm for polar diameter (length) and 8.89 cm for equatorial diameter (width), with a length/width ratio of 1.28. However, T2 was the lowest with 10.54 cm in equatorial diameter (width) and 8.39 cm for equatorial diameter (width), with a length/width ratio of 1.28. This aligns with Coello-Torres et al. (1997), who reported for Haden mango an average fruit length of 9.5 to 11.5 cm, average fruit width of 7 to 9 cm, with a length/width ratio ranging from 1.1 to 1.3, indicating an ovoid oblong fruit shape. This is also consistent with Nolasco-González & Osuna-García (2017), who reported very similar values for Kent mango (ovoid oblong fruit), with a polar diameter of 10.39 cm, equatorial diameter of 7.67 cm, and a length/width ratio of 1.35 for the control (without fertilizer application).
Fruit Weight
This variable presented only numerical values that formed a single statistical group in all treatments. The highest value was recorded for T1 with 515 g, and the lowest was for T2 with 424 g (Table 3). In this regard, Coello-Torres et al. (1997) indicate an average fruit weight ranging from 300 to 450 g for Haden mango. These results align with those reported by Chávez-Contreras et al. (2001), ranging from 200 to 430 g for Haden mangoes in the production area of Valle de Apatzingán, Michoacán, Mexico. However, Avilán et al. (2008) reported a fruit weight of 0.147 kg for the control group of Haden mango (free growth, without pruning at 2.5 m above ground level, and without the application of the growth regulator Paclobutrazol PBZ), a value much lower than the previously mentioned weights.
Fruit per Tree
Significant effects were detected in T2 and T3 with 13.42 and 4.00 fruits per tree, respectively. The highest numerical value was reflected in T1 (20 % mineralized vermicompost, 50 kg tree) with 41.7, which translates into a production of 21.49 kg tree-1, a value far from that reported by Chávez-Contreras et al. (2001) in the cultivar Haden of 100 to 200 kg tree-1 for Michoacán, Mexico. However, Romero-Gomezcaña et al. (2006) reported a production of 37.79 kg tree-1 for the control and 80.07 kg tree-1 for the treatment with 5 g L-1 of foliar-applied Ca in Haden mango in the growing region of San Lucas Michoacán, Mexico in conditions with a significant prevalence of the "witches' broom" disease.
Total Soluble Solids
In this variable, there was no significant statistical difference, and T1, T4, and T5 showed numerical values of 14.81, 14.55, and 15.02 °Brix, respectively. These biofertilizer treatments were characterized by having a microbial transformation origin. T6 (control) showed a lower value of 14.11 °Brix compared to the other treatments and reflected a relatively good amount of sugars. These averages are very close to those reported by Ramírez-Méndez et al. (2010) for this variety, 14.9 °Brix. CODEX (2005) states that mango for industry requires a minimum value of 13.5 °Brix, a value lower than those obtained except for T3 of 11.3 °Brix. Total soluble solids in mango are used as a harvest indicator and show differences between the same variety and between locations (Carrera et al., 2008).
Yield and fruiting index
Statistically significant differences were observed in T2 and T3 for both variables (Table 3). The highest values were recorded in T1, with a yield of 2.15 t ha-1 and a fructification index of 0.44 F m2, and T5 with 0.66 t ha-1 and 0.14 F m2, respectively. These results can be compared with the national average yield in Mexico for organic Haden mango, which is 5.93 t ha-1 (SADER-SIAP, 2022), still significantly distant from being matched.
For this same 22-year-old cultivar, Avilán et al. (1981) reported a fruiting index of 3.5 F m2 and a number of harvested fruits of 790 per tree-1, indicating that at this age the tree is in a period of decreasing production, which, compared to the value obtained in this experiment, was very low.
Therefore, it can be deduced that these low values obtained for both variables in all treatments are probably due to the minimum monthly temperatures recorded during the months of January, February, March, April and May, 14, 15, 16, 18, and 21 °C, respectively (Weather Spark, 2023). These temperatures influenced the late and scarce flowering induction (inflorescences), along with the presence of the witches-broom disease, even though it was not evaluated. In this regard, Galán-Sauco (2009) points out that the optimal temperature for floral induction is 10-15 °C, with winter minimums at 10 °C and spring minimums above 15 °C, with slight variations during the day and night.
Conclusions
T2 based on vermicompost 25 kg tree-1 + chemical fertilization (phosphonitrate 2 kg tree-1 + leached worm humus 2 % foliar) and T3 chemical fertilization (phosphonitrate 2 kg tree-1 + amino acids and vitamins 2 mL L-1 foliar) proved to be statistically different from all treatments in the variables fruits per tree, yield, and fructification index.
T4 based on improved supermagro (SMM) 20 liters per tree + foliar application of SMM at 2 %; T5 based on bokashi 20 kg per tree + foliar application of humic acids at 60 % and fulvic acids 4 mL L-1 and T6 Control were statistically equal. The difference was only in the numerical values.
T1 based on 20 % mineralized vermicompost, at a dose of 50 kg tree-1 and foliar application of 2 % liquid earthworm humus + 99 % glutamic acid 0.5 gr L-1 showed a higher numerical value in the number of inflorescences (panicles) 12.30 per m2, equatorial diameter (width) 8.89 cm, fruit weight 0.51 kg, fruit tree-1 41.70, yield 2.15 t ha-1 and fruiting index of 0.44 F m2. T5 evidenced to have the highest TSS concentration with 15.02 oBrix with a yield of 0.64 t ha-1.
The selection criteria for using any biofertilizer are based on the availability of raw materials for its preparation and the time required for its fermentation.
It is recommended to conduct an economic study on the costs of the three biofertilizers used to increase the doses and calculate the percentage of the investment in the mango production process, in addition to determining its profitability.

