nueva página del texto (beta)
 Inglés (pdf)
 Artículo en XML
 Referencias del artículo
 Enviar artículo por email
 Citado por SciELO
  Similares en
SciELO
Similares en
SciELO 
 Permalink
Introduction
Zoonotic diseases are responsible for three-quarters of emerging infectious disease (EIDs) in humans, posing a significant threat to human health (Taylor et al. 2001; Jones et al. 2008). Over the last century, there has been an increase in the incidence of EIDs spilling over from animals (Taylor et al. 2001; Jones et al. 2008), with most of these originating from wildlife (Jones et al. 2008). The rise of zoonotic EIDs has been linked to changes in demographic and anthropogenic variables including human population growth and density as well as climate change (Patz et al. 2000, 2004; Wolfe et al. 2007; Jones et al. 2008). Changes to land use to support growing human populations can modify animal-human interactions and change transmission pathways of pathogens (Patz et al. 2000, 2004; Wolfe et al. 2007; Jones et al. 2008). EID events are predicted to continue to pose a significant threat to human health due to the ongoing growth of the human population and subsequent disturbance of natural ecosystems through further expansion of anthropogenic activities into previously unoccupied, intact, biodiverse habitats. The modification of biodiverse ecosystems alters the distributions and behaviour of parasites, their hosts and their vectors, which can increase disease spillover from animal to human populations (Patz et al. 2000, 2004; Wolfe et al. 2007; Jones et al. 2008, 2013; Karesh et al. 2012; Hassell et al. 2017; Wilkinson et al. 2018; Johnson et al. 2020).
Current wildlife disease surveillance studies are largely focused on urban to rural habitats, where human and wildlife interactions are greatest (e. g.Bell et al. 2018; Bird and Mazet 2018; Munyua et al. 2019; Nelson et al. 2019; Lushasi et al. 2020; Blasdell et al. 2022). However, most species diversity and associated zoonotic diseases are confined to intact and remote habitats away from major human activities (Keesing et al. 2010; Lawrence et al. 2018; Glidden et al. 2021). While bat diversity in tropical systems is highest in low elevations, even with human disturbance (Patterson et al. 1996; McCain 2007; Bogoni et al. 2021), other mammalian host species, such as small terrestrial mammals, reach peak diversity at mid- to high elevations, which are often farthest from human occupation and impacts (Brown 2001; Heaney et al. 2001; Rickart et al. 2001, 2011; McCain 2005). Increasing human encroachment on the dwindling remnants of intact, biodiverse ecosystems, particularly in the tropics, are likely to reveal numerous novel infections, some of which are pathogenic and cause diseases of significance to human and animal health (Jones et al. 2008; Keesing et al. 2010; Chan et al. 2013; Morand et al. 2019). The spread of pathogens both regionally and globally due to human activities is also leading to unique pathogen communities with novel disease interactions (Kreuder Johnson et al. 2015). Due to limitations in detecting pathogens within wild species, we have almost no understanding of those dynamics (Johnson et al. 2020) including in intact ecosystems where most host diversity lies. Further research is required to assess the risk of EIDs from within these ecosystems.
The genus Trypanosoma (Euglenozoa: Kinetoplastea) comprises a diverse range of protozoan blood parasites, including zoonotic species, with a wide host range in all vertebrate classes. Despite their ubiquity, there is substantial variation in their geographic range sizes (locally endemic to cosmopolitan), host specificity (specific to generalist), morbidity (benign to lethal), and association with humans (intact to disturbed habitats; Simpson et al. 2006; Hamilton et al. 2007; Smith et al. 2008; Thompson et al. 2014a; Cooper et al. 2017; Yazaki et al. 2017). For example, some trypanosome species have a long natural association with their host species with limited evidence of morbidity (Hoare 1972; Smith et al. 2005; Averis et al. 2009). Other species have been spread globally by recent human-mediated dispersal activities, resulting in disease impacts on wildlife or humans (Joshi et al. 2005; Hamilton et al. 2007; Verma et al. 2011; Truc et al. 2013; Thompson et al. 2014b; Pumhom et al. 2015). Novel host interactions and co-infection with non-native species can lead to increased host morbidity by trypanosomes which are normally considered benign and which can cause atypical infections in humans (Smith et al. 2008; Wyatt et al. 2008; Botero et al. 2013; Desquesnes et al. 2013; MacPhee and Greenwood 2013; Milocco et al. 2013; Truc et al. 2013; Pumhom et al. 2014; Cooper et al. 2017). These novel interactions of native and introduced trypanosomes provide an opportunity for investigating how human encroachment, both through introducing parasites and encountering native parasites, influences the prevalence of zoonotic infections in intact ecosystems (Wood et al. 2014; Salzer et al. 2016; Faust et al. 2018; Morand et al. 2019).
Trypanosomes are readily detected by molecular DNA screening of tissues or blood from host animals (Clausen et al. 1998; Noyes et al. 1999; Desquesnes and Dávila 2002; Cummings and Tarleton 2003). While most species are defined by morphology and other phenotypes inferred through microscopy, trypanosomes that infect mammals are broadly classifiable into 4 clades inferred from 18S rRNA (Hamilton et al. 2007). The clades, which include numerous species yet to be formally described, are named after the most widespread and significant trypanosome species (Hoare 1972; Simpson et al. 2006; Hamilton et al. 2007; Milocco et al. 2013; Thompson et al. 2014b; Pumhom et al. 2015; Cooper et al. 2017). The Theileri clade contains trypanosome species infecting a wide range of mammalian hosts and is named for the cosmopolitan bovid-infecting T. theileri (Hoare 1972; Hamilton et al. 2005a; Rodríguez et al. 2010). While trypanosomes in the Theileri clade are typically considered non-pathogenic, pathogenic cases have been reported in animals (e.g.Amato et al. 2019). The Lewisi clade contains trypanosome species that typically infect rodents, and is named for T. lewisi, which has been spread globally with the introduction of black rats, Rattus rattus (Hoare 1972; Hamilton et al. 2005b, 2007). While normally infecting rodents and non-pathogenic, T. lewisi infections of humans have been reported with clinical implications (e. g.Truc et al. 2013). The Cruzi clade contains trypanosomes primarily from bats, but with several trypanosomes switching to other terrestrial mammalian hosts particularly in South America and Australia (Hamilton et al. 2012). These widespread trypanosomes are largely host-specific with some pathogenic species such as T. cruzi, which causes Chagas disease in humans (Hamilton et al. 2007, 2012; Botero et al. 2016; Cooper et al. 2017). The Brucei clade contains pathogenic trypanosomes, including T. brucei, which causes African sleeping sickness. Originating from African mammals, these trypanosomes now infect a broad range of mammalian host species on most continents (Hamilton et al. 2005, 2007; Rodrigues et al. 2006; Desquesnes et al. 2013).
The oceanic island of Sulawesi, Indonesia is a biogeographic crossroads between Asia and Australia that has not been connected to either for at least 50 million years. The single island of Sulawesi formed from several smaller islands over the last 2 to 5 million years (Whitten et al. 1987; Hall 2013; Nugraha and Hall 2018; Rowe et al. 2019). It is the largest landmass in the vast archipelago that spans > 1,000 kms between the Asian and Australian continental shelves. Most of Sulawesi’s fauna are endemic (i. e. native only to the island), with distributions often restricted to specific areas on the island (e. g. Bunomys coelestis). These faunal communities are composed of a globally unique assemblage of Asian- and Australian-derived lineages (Michaux 2010; Lohman et al. 2011; Stelbrink et al. 2012). Sulawesi is also home to more than 20 million people (> 100 per km2) and most of its intact pristine forests are found at higher elevations on its many rugged mountains that reach as high as 3,478 m. The vast majority of Sulawesi’s human population and domestic livestock live at elevations below 1,500 m, resulting in < 20 % of lowland forests being in good condition (Supriatna et al. 2020). In contrast, 70 % of forests above 1,500 m are considered in good condition (Cannon et al. 2007).
Sulawesi is also home to both native and introduced species of trypanosomes including species from the Theileri, Lewisi and Brucei clades (Luckins 1998; Winterhoff et al. 2020; Setiawan et al. 2021). Trypanosome species from the Theileri clade that are closely related to T. cyclops have been detected infecting a wide range of mammalian hosts on the island, including rodents, bats, and shrews, often with high prevalence and are therefore presumed native (Weinman 1972; Winterhoff et al. 2020; Mursyid et al. 2023). Lewisi-clade trypanosomes, introduced with rodents brought by humans, have been detected infecting both native and introduced rodent species on Sulawesi (Winterhoff et al. 2020). Trypanosoma evansi, of the Brucei clade and responsible for the major disease known as surra in animals, originated from Africa and has been detected infecting livestock such as cattle, buffaloes and horses on Sulawesi (Luckins 1998; Desquesnes et al. 2001, 2013; Setiawan et al. 2021). Sulawesi’s position between the Asian and Australian continents, suggests that it is an important link in the biogeography of trypanosomes including within the Theileri clade (Stelbrink et al. 2012; Winterhoff et al. 2020). Nearly identical sequences to the named species T. cyclops, described from an infection in a Malaysian primate (Weinman 1972), have been detected from Asia to Australia in rodents and marsupials (Thompson et al. 2014b; Cooper et al. 2017; Winterhoff et al. 2020). These may represent a widespread species or one or more undescribed species. Sulawesi therefore offers an opportunity to undertake wildlife disease surveillance from disturbed through to intact habitats using trypanosomes as disease indicators.
In this study, we screened blood samples from 2,335 mammalian specimens collected over 10 years from 11 mountainous areas of Sulawesi spanning 220 to 2,800 masl. Our sampling starts from the last human settlement and extends into the most intact habitats on each mountain, most of which occur at higher elevations. Here, we present trypanosomes as a model to examine how infections by introduced and native parasites are distributed among disturbed and intact habitats along elevational gradients on a human-dominated tropical island. We predicted that invasive Lewisi clade trypanosomes would occur more frequently at lower elevations coinciding with more disturbed habitats, whereas native trypanosomes of the Theileri clade (T. cyclops) would occur more frequently at higher elevations coinciding with less disturbed habitats, mirroring the patterns among native and introduced mammals. We also predicted that the co-occurrence of introduced and native trypanosomes would be most common at the interface of disturbed and intact habitats. The samples used in this study are accompanied by numerous additional specimens lodged in Indonesian, American and Australian natural history collections that highlight the vast value of natural history collections for surveillance of wildlife disease in the most remote and biodiverse regions of our planet (Dunnum et al. 2017; Colella et al. 2021; Thompson et al. 2021).
Materials and methods
Sample collection. From 2010 to 2019, we surveyed rodents (families Muridae and Sciuridae) and shrews (family Soricidae) at 11 localities across Sulawesi, Indonesia (Figure 1; Table 1; Supplementary Material S1). The localities sampled spanned 5.3 ºS to 1.06 ºN extending from the southern end of the southwest peninsula to the eastern end of the northern peninsula. At each locality, we surveyed as wide a range of elevations as possible with a mean elevation range spanning 1,267 m per locality (Table 1). The lowest elevation sampled at each locality, typically near the edge of the last human settlement, ranged from 220 to 1,660 m (mean 632 m) and the highest elevation sampled ranged from 450 to 2,804 m (mean 1,899 m). Intact habitats comprised primary forest with mixed species and mixed age stands without evidence of ongoing or past extractive forest practices. Disturbed habitats comprised secondary or degraded forest resulting from human modifications including agriculture, plantations, timber clearing, and/or mining activities. Lowland habitats (< 1,000 m) were once dominated by lowland rainforest that when surveyed was in different degrees of conversion to plantations or villages, and/or recovering from disturbance as secondary growth. Only four localities contained intact forest below 1,000 m and only one locality, Mt. Bonggolosapi within Bogani Nani Wartabone National Park, contained intact forest below 500 m. Highland habitats (> 1,000 m) were dominated by intact forest. Disturbed habitat above 1,000 m was only sampled at two localities, including the highest elevations on Mt. Bawakaraeng where a popular camping area was heavily disturbed.
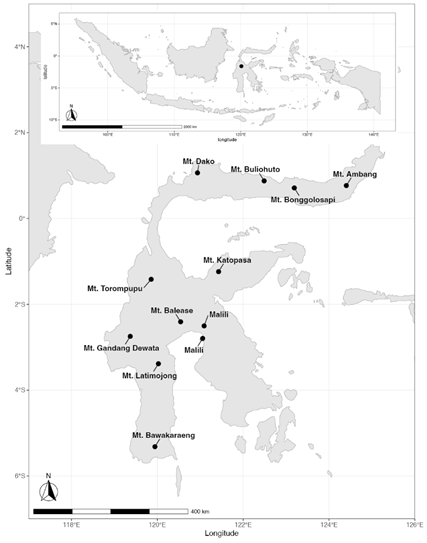
Figure 1 Sampling took place on the Indonesian island of Sulawesi (inset). The 11 surveyed localities are labelled by the nearest mountain. Surveys near the town of Malili sampled 2 nearby lowland locations, the results of which were combined for analyses.
Surveys at each locality lasted an average of 21 days (4 to 38 days) and employed a mix of live traps, snap traps, and 20 to 30 L pitfall buckets. Surveys were led by Museum Zoologicum Bogoriense (MZB), Bogor, Indonesia where most specimens were deposited. Remaining specimens were deposited in Museums Victoria (NMV), Melbourne, Australia; Museum of Vertebrate Zoology (MVZ), Berkeley, USA; Field Museum of Natural History (FMNH), Chicago, USA; and Louisiana State University Museum of Natural Science (LSUMZ), Baton Rouge, USA. Survey methods were approved by institutional animal care and use committees at US institutions, the animal ethics committee at Museums Victoria and complied with all Indonesian laws and regulations. Specimens were prepared as vouchers including skins, skeletal material, and fluid-preserved (formalin or ethanol) whole animals. In addition, a series of biological samples were preserved in ethanol, RNA later, and/or liquid nitrogen for each specimen, including liver, kidney, spleen, lung, heart, muscle, blood, adrenal gland, preputial gland, gastrointestinal contents, and faeces. Blood films were collected from specimens starting from 2016.
Table 1 Sampling information and PCR screening results of Kinetoplastea infections in rodents and shrews for each locality surveyed on Sulawesi.
| Locality | Year(s) sampled | Latitude (Centroid) | Longitude (Centroid) | Elevation range of surveys (masl) | Survey Days | Samples screened | Screened host genera (species) | Theileri Clade (T.cyclops) | Lewisi Clade | Cruzi Clade | Other Kinet. |
|---|---|---|---|---|---|---|---|---|---|---|---|
| Malili | 2010 | (a) -2.79438 (b) -2.50368 | (a) 121.05643 (b) 121.09012 | 450 | 4 | 47 | 4 (6) | 6 | 0 | 0 | 0 |
| Balease | 2010 | -2.40689 | 120.54211 | 900 - 1150 | 15 | 71 | 6 (11) | 5 | 1 | 0 | 1 |
| Gandang Dewata | 2011; 2012 | -2.74695 | 119.36802 | 220 - 2670 | 44 | 212 | 17 (26) | 46 | 21 | 4 | 1 |
| Latimojong | 2011; 2016 | -3.38414 | 120.02442 | 683 - 2535 | 27 | 319 | 11 (21) | 141 | 26 | 0 | 1 |
| Dako | 2013; 2018 | 1.06213 | 120.93513 | 310 - 2230 | 38 | 516 | 10 (23) | 111 | 12 | 0 | 1 |
| Buliohuto | 2014 | 0.87505 | 122.48904 | 400 - 1390 | 16 | 72 | 6 (9) | 0 | 6 | 0 | 5 |
| Bawakaraeng | 2016 | -5.31685 | 119.94390 | 1660 - 2804 | 15 | 349 | 9 (17) | 38 | 11 | 0 | 7 |
| Ambang | 2016 | 0.76675 | 124.40372 | 1472 - 1655 | 21 | 90 | 7 (12) | 6 | 0 | 0 | 1 |
| Katopasa | 2017 | -1.23955 | 121.42607 | 220 - 2575 | 20 | 232 | 5 (20) | 75 | 5 | 2 | 1 |
| Torompupu | 2017 | -1.41764 | 119.85558 | 410 - 2210 | 19 | 173 | 8 (21) | 13 | 3 | 0 | 1 |
| Bonggolosapi | 2019 | 0.71088 | 123.19154 | 228 - 1216 | 15 | 254 | 9 (18) | 1 | 5 | 6 | 2 |
| Total | 2,335 | 23 (65) | 442 | 90 | 12 | 21 |
DNA extraction and sequencing. Total genomic DNA was extracted mainly from liver tissue (n = 2,085) but also from spleen (n = 79), muscle (n = 6), kidney (n = 1), or from an unknown tissue type (n = 164; Supplementary Material S1). Extractions were performed using a salting method, a QIAGEN DNeasy blood and tissue kit (QIAGEN Inc, Valencia, CA, USA), a Wizard SV 96 Genomic DNA Purification System kit (Promega Corporation, Madison, WI, USA), or a QIAextractor (DX reagents and plasticware) following the manufacturer’s protocols.
DNA samples were screened for Kinetoplastea infections at the 18S subunit of the rRNA locus using a set of nested trypanosome-generic primers: SLF/S762R and S823F/S662R following the previously described PCR protocol (Winterhoff et al. 2020; Supplementary Material S2). Conditions for both primary and nested PCR reactions included: a 95°C initial pre-amplification step for 5 min, followed by 35 cycles of 94°C for 30 s, 52°C for 30 s, and 72°C for 2 min and 20 s; and a final extension step at 72°C for 7 min. A known positive control was used in each PCR reaction to determine successful amplification. All reactions were performed in an Eppendorf Mastercycler Nexus GSX1. PCR amplicons were visualised on a 1.2 % agarose gel, stained with SYBR safe (Invitrogen, USA). Each PCR-positive sample was purified using ExoSAP (USB Corporation, Cleaveland, Ohio, USA) and both strands were sequenced via automated DNA Sanger sequencing on an ABI 3730xl DNA Analyzer at Macrogen Inc (Seoul, Korea). Sequences were edited and aligned in CodonCode v.5.1.5 (CodonCode Corporation, Dedham, MA, USA) and manually inspected in Aliview v.1.23 (Larsson 2014). All sequences were identified to genus and species where possible using the nucleotide BLAST tool within the NCBI GenBank database. DNA sequences are available in GenBank (Supplementary Material S1). Due to the sensitivity of PCR methods, detection of a Kinetoplastea infection does not necessarily indicate an active replicating infection. Rather prevalence reflects the percentage of individuals that have signs of being or have previously been infected, including transient infections.
Microscope analysis. Microscopic observation of parasite morphology is a valuable tool assisting the taxonomic resolution and identification of trypanosome taxa. We collected and prepared blood smears in the field from already deceased animals which can decrease the quality of the prepared smear (i. e. thick, coagulated smears) from mid-2016 onwards. Slides were stored in a box with silica desiccant for up to four weeks without fixation. Upon return to the laboratory, smears were fixed with 100 % methanol and stained with a 10 % Giemsa solution.
We compared the efficiency between PCR protocols and microscopy at detecting trypanosome infections, as well as confirming circulation of trypanosome infections in the blood by screening a random sub-set of blood smears (n = 120 PCR-positive, 40 PCR-negative) collected between 2017 and 2018 using light microscopy at x400 and x1,000 magnification for 15 minutes. All blood smears are registered in the Museums Victoria collection and linked to specimens registered at Museum Zoologicum Bogoriense.
Trypanosome prevalence. We tested the null hypotheses that prevalence for each trypanosome clade did not differ between habitat types (intact or disturbed) or among elevation bins. Because forest types and elevation bins are not independent, with disturbed forest dominating lower elevation and intact forest dominating higher elevation, we are not able to disentangle their respective effects on prevalence. We present both to reveal if prevalence appears higher in disturbed/low elevation habitats closer to human impacts as predicted or in intact/high elevation habitats farther from human interactions. We defined ‘intact’ forest as those exhibiting mixed species and mixed age stands without ongoing extractive forest practices and ‘disturbed’ as those showing signs of extractive forestry, including timber harvest, clearing and other signs of human impacts. Samples were categorised into 6 elevation bins: I) < 500 masl, II) 501 to 1,000 masl, III) 1,001 to 1,500 masl; IV) 1,501 to 2,000 masl, V) 2,001 to 2,500 masl, and VI) > 2,500 masl. These bins best represent the transitions between village and forest (I and II) and transitions among habitat with increasing elevation.
Testing each clade, we used Chi-square tests to compare prevalence. All Chi-square tests were conducted using the ‘chisq.test’ function in the base package of the R programming language (v. 4.3.1, R Core Team 2023). If our null hypotheses for forest types or elevation bins were rejected, we investigated which categories were significantly different by performing post-hoc analyses on the residuals using the ‘chisq.posthoc.test’ function in the same named package (v. 0.1.2, Ebbert 2019). We used the Bonferroni correction for multiple comparisons to control for the family-wise error rate.
Results
Sample collection. We collected a total of 3,307 rodent and shrew specimens from Sulawesi, of which we screened 2,335 for the presence of Kinetoplastea parasite infections. Our sampling of rats (family Muridae) included 44 endemic and two introduced species comprising 18 genera. Our sampling included all but seven endemic species of murids known from the island. Our sampling of squirrels (family Sciuridae) included all three genera endemic to the island, but included only three of the ten species (Musser et al. 2010). Our sampling of shrews (family Soricidae) included 17 of the 21 species in the genus Crocidura that are native to Sulawesi (Esselstyn et al. 2021) and one introduced species, Suncus murinus. We sampled and screened a mean of 16.8 rodent and shrew species (6 to 26 species) per locality (Table 2). From disturbed habitats we collected and screened a mean of 7.1 species per locality (2 to 16 species) whereas we collected and screened a mean of 16.6 species from intact habitats (9 to 23 species). Per elevation bin we collected and screened a mean of 8.6 species (7.3 to 11 species) with the highest number of rodents and shrew species collected from bins IV (1,501 to 2,000 masl) and V (2,001-2,500 masl). Screened specimens included 18 genera from Muridae (1,779 specimens), three genera from Sciuridae (38 specimens) and two genera from Soricidae (519 specimens; Table 3).
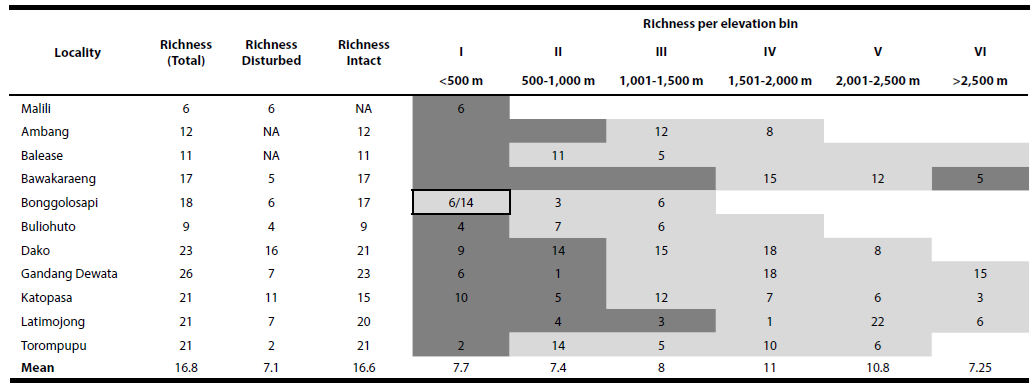
Table 2 Observed richness of host species (rodents and shrews) across localities, habitat types and elevation bins. Elevation bins for each locality are shaded to indicate disturbed habitat (dark grey), intact habitat (light grey), mixed habitat (light grey with black box). For mixed habitat bin, richness is separated for disturbed (left of forward slash) and intact (right of forward slash) based on individual traplines. Available but unsampled elevation bins at each locality are shaded without numbers.
Table 3 Sample sizes of PCR-screened rodent and shrew host species of Sulawesi. Number and percents of samples with PCR positives and detections of Theileri clade (T. cyclops) or Lewisi clade infections.
| Order | Family | Genus | Species | Sample size | Theileri clade | Lewisi | |
|---|---|---|---|---|---|---|---|
| Screened | PCR positive n (%) | (T. cyclops) | clade | ||||
| n (%) | n (%) | ||||||
| Rodentia | Muridae | Bunomys | andrewsi | 131 | 54 (41.2%) | 41 (31.3%) | 11 (8.4%) |
| Rodentia | Muridae | Bunomys | chrysocomus | 116 | 21 (18.1%) | 14 (12.1%) | 6 (5.2%) |
| Rodentia | Muridae | Bunomys | coelestis | 64 | 21 (32.8%) | 17 (26.6%) | 4 (6.3%) |
| Rodentia | Muridae | Bunomys | penitus | 121 | 84 (69.4%) | 63 (52.1%) | 20 (16.5%) |
| Rodentia | Muridae | Bunomys | prolatus | 10 | 10 (100%) | 10 (100%) | 0 (0%) |
| Rodentia | Muridae | Bunomys | sp. unidentified | 16 | 3 (18.3%) | 2 (12.5%) | 1 (6.3%) |
| Rodentia | Muridae | Bunomys | torajae | 68 | 57 (83.8%) | 49 (72.1%) | 8 (11.8%) |
| Rodentia | Muridae | Crunomys | celebensis | 2 | 0 (0%) | 0 (0%) | 0 (0%) |
| Rodentia | Muridae | Echiothrix | leucura | 2 | 1 (50.0%) | 1 (50.0%) | 0 (0%) |
| Rodentia | Muridae | Eropeplus | canus | 18 | 4 (22.2%) | 3 (16.7%) | 1 (5.6%) |
| Rodentia | Muridae | Frateromys | fratrorum | 112 | 27 (24.1%) | 23 (20.5%) | 1 (0.9%) |
| Rodentia | Muridae | Genus | sp. nov. | 11 | 0 (0%) | 0 (0%) | 0 (0%) |
| Rodentia | Muridae | Gracilimus | radix | 4 | 0 (0%) | 0 (0%) | 0 (0%) |
| Rodentia | Muridae | Haeromys | minahassae | 11 | 5 (45.5%) | 1 (9.1%) | 4 (36.4%) |
| Rodentia | Muridae | Hyorhinomys | stuempkei | 3 | 0 (0%) | 0 (0%) | 0 (0%) |
| Rodentia | Muridae | Lenomys | meyeri | 6 | 0 (0%) | 0 (0%) | 0 (0%) |
| Rodentia | Muridae | Margaretamys | beccarii | 1 | 0 (0%) | 0 (0%) | 0 (0%) |
| Rodentia | Muridae | Margaretamys | elegans | 2 | 0 (0%) | 0 (0%) | 0 (0%) |
| Rodentia | Muridae | Margaretamys | parvus | 5 | 1 (20%) | 0 (0%) | 1 (20%) |
| Rodentia | Muridae | Margaretamys | sp. nov. 1 | 1 | 0 (0%) | 0 (0%) | 0 (0%) |
| Rodentia | Muridae | Margaretamys | sp. nov. 2 | 1 | 0 (0%) | 0 (0%) | 0 (0%) |
| Rodentia | Muridae | Crunomys | dollmani | 10 | 0 (0%) | 0 (0%) | 0 (0%) |
| Rodentia | Muridae | Crunomys | hellwaldii | 95 | 14 (14.7%) | 3 (3.2%) | 0 (0%) |
| Rodentia | Muridae | Crunomys | musschenbroekii | 317 | 50 (15.8%) | 45 (14.2%) | 2 (0.6%) |
| Rodentia | Muridae | Crunomys | wattsi | 27 | 14 (51.9%) | 14 (51.9%) | 0 (0%) |
| Rodentia | Muridae | Melasmothrix | naso | 3 | 1 (33.3%) | 0 (0%) | 1 (33.3%) |
| Rodentia | Muridae | Paucidentomys | vermidax | 2 | 1 (50%) | 1 (50%) | 0 (0%) |
| Rodentia | Muridae | Rattus | bontanus | 36 | 4 (11.1%) | 3 (8.3%) | 1 (2.8%) |
| Rodentia | Muridae | Rattus | exulans | 31 | 2 (6.5%) | 0 (0%) | 2 (6.5%) |
| Rodentia | Muridae | Rattus | facetus | 49 | 4 (8.2%) | 1 (2.0%) | 2 (4.1%) |
| Rodentia | Muridae | Rattus | hoffmanni | 163 | 26 (16.0%) | 5 (3.1%) | 20 (12.3%) |
| Rodentia | Muridae | Rattus | marmosurus | 9 | 0 (0%) | 0 (0%) | 0 (0%) |
| Rodentia | Muridae | Rattus | mollicomulus | 51 | 7 (13.7%) | 0 (0%) | 4 (7.8%) |
| Rodentia | Muridae | Rattus | tanezumi | 1 | 0 (0%) | 0 (0%) | 0 (0%) |
| Rodentia | Muridae | Rattus | xanthurus | 7 | 0 (0%) | 0 (0%) | 0 (0%) |
| Rodentia | Muridae | Sommeromys | macrorhinos | 6 | 0 (0%) | 0 (0%) | 0 (0%) |
| Rodentia | Muridae | Taeromys | callitrichus | 7 | 0 (0%) | 0 (0%) | 0 (0%) |
| Rodentia | Muridae | Taeromys | celebensis | 20 | 1 (5%) | 0 (0%) | 0 (0%) |
| Rodentia | Muridae | Taeromys | dominator | 149 | 12 (8.1%) | 11 (7.4%) | 0 (0%) |
| Rodentia | Muridae | Taeromys | hamatus | 1 | 0 (0%) | 0 (0%) | 0 (0%) |
| Rodentia | Muridae | Taeromys | punicans | 1 | 1 (100%) | 1 (100%) | 0 (0%) |
| Rodentia | Muridae | Taeromys | sp. nov. 1 | 29 | 11 (37.9%) | 11 (37.9%) | 0 (0%) |
| Rodentia | Muridae | Taeromys | sp. nov. 2 | 4 | 1 (25%) | 1 (25%) | 0 (0%) |
| Rodentia | Muridae | Taeromys | taerae | 41 | 15 (36.6%) | 15 (36.6%) | 0 (0%) |
| Rodentia | Muridae | Tateomys | macrocercus | 7 | 2 (28.6%) | 1 (14.3%) | 1 (14.3%) |
| Rodentia | Muridae | Tateomys | rhinogradoides | 8 | 1 (12.5%) | 1 (12.5%) | 0 (0%) |
| Rodentia | Sciuridae | Hyosciurus | heinrichi | 4 | 1 (25.0%) | 1 (25.0%) | 0 (0%) |
| Rodentia | Sciuridae | Prosciurillus | murinus | 33 | 1 (3.0%) | 1 (3.0%) | 0 (0%) |
| Rodentia | Sciuridae | Rubrisciurus | rubriventer | 1 | 0 (0%) | 0 (0%) | 0 (0%) |
| Eulipotyphla | Soricidae | Crocidura | australis | 5 | 2 (40.0%) | 1 (20.0%) | 0 (0%) |
| Eulipotyphla | Soricidae | Crocidura | balete | 4 | 1 (25.0%) | 1 (25.0%) | 0 (0%) |
| Eulipotyphla | Soricidae | Crocidura | brevicauda | 10 | 5 (50.0%) | 5 (50.0%) | 0 (0%) |
| Eulipotyphla | Soricidae | Crocidura | caudipilosa | 45 | 7 (15.6%) | 7 (15.6%) | 0 (0%) |
| Eulipotyphla | Soricidae | Crocidura | elongata | 33 | 9 (27.3%) | 9 (27.3%) | 0 (0%) |
| Eulipotyphla | Soricidae | Crocidura | lea | 13 | 8 (61.5%) | 8 (61.5%) | 0 (0%) |
| Eulipotyphla | Soricidae | Crocidura | levicula | 19 | 1 (5.3%) | 1 (5.3%) | 0 (0%) |
| Eulipotyphla | Soricidae | Crocidura | mediocris | 21 | 0 (0%) | 0 (0%) | 0 (0%) |
| Eulipotyphla | Soricidae | Crocidura | microelongata | 16 | 6 (37.5%) | 6 (37.5%) | 0 (0%) |
| Eulipotyphla | Soricidae | Crocidura | nigripes | 44 | 8 (18.2%) | 8 (18.2%) | 0 (0%) |
| Eulipotyphla | Soricidae | Crocidura | normalis | 5 | 0 (0%) | 0 (0%) | 0 (0%) |
| Eulipotyphla | Soricidae | Crocidura | ordinaria | 8 | 1 (12.5%) | 1 (12.5%) | 0 (0%) |
| Eulipotyphla | Soricidae | Crocidura | pallida | 28 | 6 (21.4%) | 6 (21.4%) | 0 (0%) |
| Eulipotyphla | Soricidae | Crocidura | parva | 84 | 4 (4.8%) | 2 (2.4%) | 0 (0%) |
| Eulipotyphla | Soricidae | Crocidura | pseudorhoditis | 66 | 21 (31.8%) | 21 (31.8%) | 0 (0%) |
| Eulipotyphla | Soricidae | Crocidura | quasielongata | 55 | 2 (3.6%) | 1 (1.8%) | 0 (0%) |
| Eulipotyphla | Soricidae | Crocidura | solita | 42 | 23 (54.8%) | 23 (54.8%) | 0 (0%) |
| Eulipotyphla | Soricidae | Crocidura | sp. unidentified | 19 | 4 (21.1%) | 3 (15.8%) | 0 (0%) |
| Eulipotyphla | Soricidae | Suncus | murinus | 1 | 0 (0%) | 0 (0%) | 0 (0%) |
DNA extraction and sequencing. We detected DNA from 3 Kinetoplastea orders in 24.2 % of our samples (n = 565, Table 4). Trypanosomes (Trypanosoma: Trypanosomatidae: Trypanosomatida) comprised > 96 % of detections and were detected in 23.3 % of our samples including 65.2 % of the genera and 69.8 % of the species sampled. These comprised 29 species of murid rodents, 15 shrew species, and 2 squirrel species (n = 544; 439 rats, 103 shrews, 2 squirrels; Tables 1, 3, 4). Trypanosomes were detected in 513 liver (24.6 %), 4 spleen (5.1 %), and 27 unknown tissue (16.5 %) samples. In all but 2 species without PCR-positive detections (n = 20), the sample sizes were small (n = 1-11; x̄ = 4.5).
Based on the 18S rDNA gene sequences, we identified infections by trypanosomes from three of the four clades that infect mammals (Cooper et al. 2017); the Theileri, Lewisi and Cruzi clades (Tables 3, 4). All sequences within the Theileri clade matched closely (> 97 % sequence similarity) to T. cyclops, described from Malaysian macaques, and which have previously been detected in rodents, marsupials, frogs and terrestrial leeches from Australia, Sulawesi and Asia (Cooper et al. 2017; Winterhoff et al. 2020). Sequences within the Lewisi clade were nearly all identical and had a > 98 % sequence similarity with several named species of Trypanosoma but which cannot be distinguished solely by 18S rDNA sequences. Species included T. lewisi, T. otospermophili, T. microti, T. musculi, and T. rabinowitschae (see phylogeny in Winterhoff et al. 2020). One recovered sequence shared 100% similarity to T. lewisi previously detected in rodents from the Philippines and Sulawesi (Mafie et al. 2019). One sequence within the Cruzi clade matched closely with the rodent-infecting T. conorhini (99 % sequence similarity). The remaining sequences within the Cruzi clade had a 97 to 98 % sequence similarity with T. terrestris which has been detected infecting tapirs (Table 4).
Several other either free-living or exclusively arthropod-infecting kinetoplastid genera were also detected by PCR in our rodent and shrew samples but were not detected with blood smears (free-living genera: Parabodo, Neobodo, Dimastigella; monoxenous arthropod-infecting genera: Blechomonas, Blastocrithidia, Herpetomonas, Kentomonas; Table 4). The low detection rates, including several single infections, of these free-living or non-mammalian infecting genera probably does not reflect an infection in the mammalian specimens screened. The extremely low incidence of these genera suggests that our PCR protocols were mostly detecting the targeted mammalian-infecting Kinetoplastea species.
Table 4 Orders of Kinetoplastea detected in rodents and shrews of Sulawesi with details of their infections.
| Order | Clade, Genus or species | Number infections | % of all infections | BLAST similarity | Rodent hosts (n) | Shrew hosts (n) | Number localities | Elevation bin range (masl) |
|---|---|---|---|---|---|---|---|---|
| Neobodonida | 7 | 1.2% | ||||||
| Neobodo curvifilus | 1 | 0.2% | 100% | Bunomys chrysocomus | 1 | 501-1,000 | ||
| Neobodo cf. designis | 1 | 0.2% | 88% | Crocidura parva | 1 | 1,501-2,000 | ||
| Dimastigella sp. | 4 | 0.7% | 96-98% | Frateromys fratrorum (2), Crunomys musschenbroekii (1) | Crocidura parva | 3 | 1,001-2,000 | |
| Genus unidentified | 1 | 0.2% | 84-86% | Frateromys fratrorum | 1 | 1,001-1,500 | ||
| Eubodonida | 9 | 1.6% | ||||||
| Parabodo cf. caudatus | 9 | 1.6% | 91-99% | Rattus mollicomulus (2), B. penitus (1), Crunomys hellwaldii (1), C. musschenbroekii (2), Rattus facetus (1) | Crocidura australis (1), C. lea (1) | 4 | 501-3,000 | |
| Trypanosomatida | 549 | 97.0% | ||||||
| Blastocrithidia sp. | 1 | 0.2% | 100% | Crocidura sp. | 1 | < 500 | ||
| Blechomonas sp. | 1 | 0.2% | 98% | Rattus mollicomulus | 1 | 1,501-2,000 | ||
| Herpetomonas sp. | 1 | 0.2% | 99% | Rattus hoffmanni | 1 | 501-1,000 | ||
| Kentomonas sp. | 1 | 0.2% | 97% | Bunomys andrewsi | 1 | < 500 | ||
| Genus unidentified | 1 | 0.2% | 98-99% | Taeromys dominator | 1 | < 500 | ||
| Trypanosoma | 544 | 96.3% | ||||||
| Trypanosoma conorhini | 1 | 0.2% | 99% | Bunomys andrewsi | 1 | < 500 | ||
| Cruzi clade (terrestris-like) | 11 | 1.9% | 97-98% | Crunomys hellwaldii (10), Taeromys celebensis (1) | 3 | < 500 | ||
| Lewisi Clade sp. | 90 | 15.9% | 98-100% | 17 species (see Table 3) | 9 | < 500-3,000 | ||
| Theileri clade (T. cyclops) | 442 | 78.2% | 97-99% | 26 species (see Table 3) | 15 species (see Table 3) | 10 | < 500-3,000 |
Microscopy screening. Trypanosomes were detected in 27 (16.9 %) of the blood smear slides from PCR-positive specimens (1 Cruzi clade, 3 Lewisi clade and 23 Theileri clade (T. cyclops) trypanosomes; Figure 2; see Supplementary Material S3). This may indicate false negatives in microscopy due to the lower sensitivity of this method at detecting active infections, especially at low parasitaemia levels (Setiawan et al. 2021), or false positives in PCRs where evidence of past infections can be detected due to the higher sensitivity of this method and therefore trypanosomes would not be observed in a blood film. False positives derived from past infections are irrelevant to our inference as our aim was to determine if an animal has been exposed to infection. Our low detection rates in microscopy may also be related to the difficulties in producing high-quality blood smears under challenging field conditions. Despite the often-poor quality of blood smears and low detection rates compared to PCR, trypanosome detections with microscopy confirm active infections in hosts and provide morphological references of PCR detections. Trypanosomes were not detected in the blood smears of PCR-negative blood specimens with false negatives less likely to occur from PCR than in microscopy (Valkiunas et al. 2008).
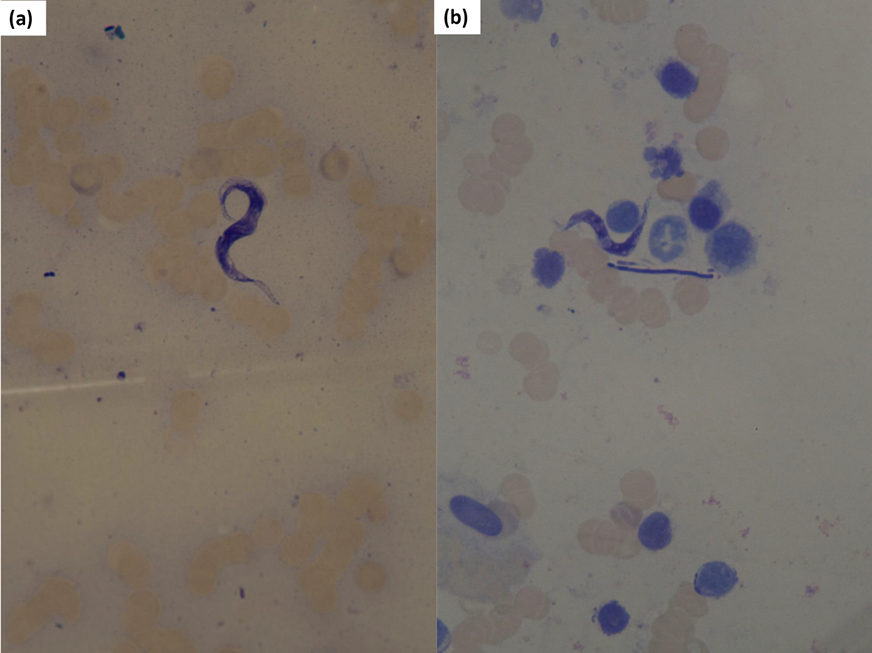
Figure 2 Blood from 2 Bunomys chrysocomus specimens illustrating examples of (A) Theileri clade (T. cyclops) and (B) Lewisi clade parasites among erythrocytes stained using 10% Giemsa stain under x1,000 magnification.
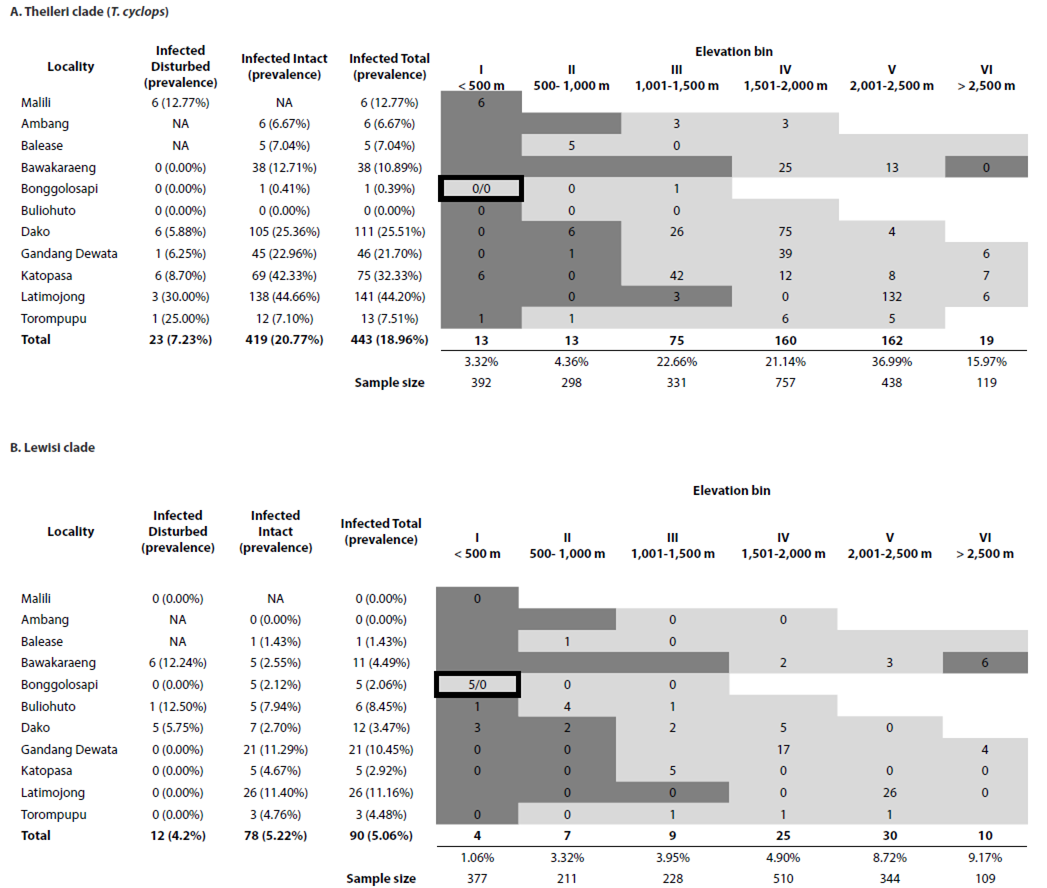
Trypanosome prevalence. Of the three clades of trypanosomes detected in this study the Theileri Clade was detected in 19.0 % of samples, Lewisi clade in 5.1% of samples and Cruzi clade in 0.5 % of samples. Theileri clade (T. cyclops) detections had a significantly higher prevalence than either Lewisi clade infections (χ2 = 171.3, d.f. = 1, p < 0.001) or Cruzi clade infections (χ2 = 449.0, d.f. = 1, p < 0.001). In relation to forest types, Theileri clade (T. cyclops) infections were significantly higher in intact forests (20.8 %) than in disturbed forest (7.3 %; χ2 = 31.9, d.f. = 1, p < 0.001; Figure 3a), whereas infection prevalences were similar between forest types for Lewisi clade infections of murids (intact = 5.2 %, disturbed = 4.2 %; χ2 = 0.34, d.f. = 1, p = 0.562; Figure 3b; see Appendix I). Cruzi clade (Terrestris-like) infections were significantly higher in disturbed forest (1.8 %) than in intact forests (0.3 %; CI: 1.71-24.2, d.f. = 1, p = 0.003).
Theileri clade (T. cyclops) infections were detected in 442 individuals representing 24 endemic murid, two squirrel, and 15 shrew host species and were detected from 10 of 11 localities sampled (Table 3; Figure 3a). No Theileri clade (T. cyclops) trypanosomes were detected in introduced species. Prevalence varied among taxa (range 2 % to 100%) and varied significantly among localities (χ2 = 187.33, d.f. = 10, p < 0.001; Figure 3a; see Appendix I). Prevalence was highest on Mount Latimojong (44.2 %, residuals = 9.46, p < 0.001) and infections were also significantly higher than average on Mount Katopasa (32.3 %, residuals = 4.32, p < 0.001). However, infections were significantly lower on Mount Bawakaraeng (10.9 %, residuals = -3.53, p = 0.009), Mount Torompupu (7.5 %, residuals = -3.45, p = 0.013) and Mount Bonggolosapi (0.4 %, residuals = -7.11, p < 0.001). No Theileri clade (T. cyclops) infections were detected on Mount Buliohuto (0 %, residuals = 3.74, p = 0.004). There were no significant differences from the average prevalence of all sites for Malili (12.8%, residuals = -0.92, p = 1.00), Mount Ambang (6.7 %, residuals = -2.63, p = 0.19), Mount Balease (7.0 %, residuals = -2.26, p = 0.53), Mount Dako (21.5 %, residuals = 1.39, p = 1.00), and Mount Gandang Dewata (21.7 %, residuals = 0.88, p = 1.00).
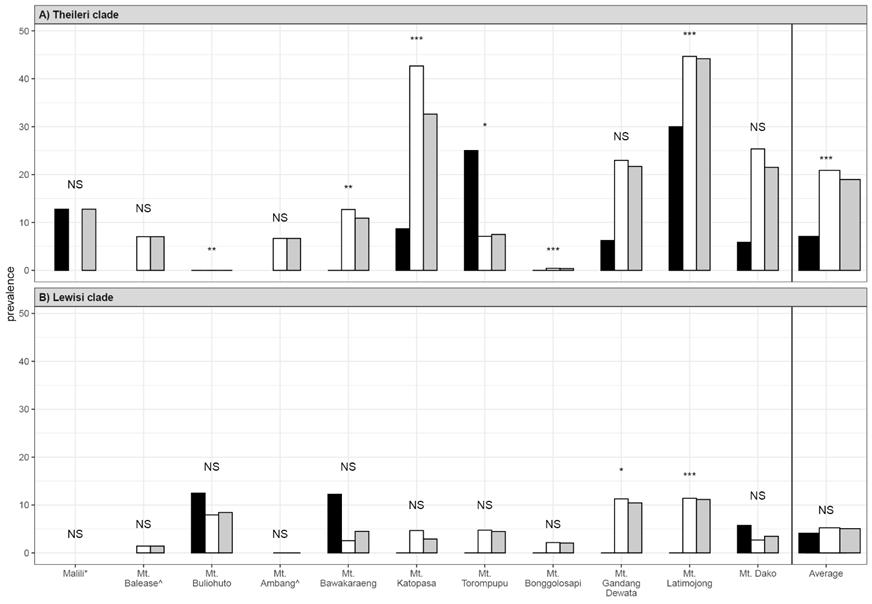
Figure 3 Prevalence of (A) Theileri clade (T. cyclops) and (B) Lewisi clade infections as detected by PCR in rodents and shrews by localities and habitat types on Sulawesi. Black and white bars represent prevalence in intact and disturbed habitats, respectively with overall prevalence in grey. Average prevalence by habitat type for all localities is included on the right. Localities where only disturbed (*) or intact (^) habitats were sampled are indicated. Symbols above the bars indicate significance (p value) of prevalence by locality and the average for that clade (‘NS’ = not significant, ‘*’ = p = 0.01 - 0.05, ‘**’ = p = 0.001 - 0.01, ‘***’ = < 0.001).
For Theileri clade (T. cyclops) infections, prevalence varied significantly among elevation bins (χ2 = 202.62, d.f. = 5, p < 0.001; Figure 4a; see Appendix I), with prevalence significantly higher than average in bin V (2,001 to 2,500 m; 37.0 %, residuals = 10.70, p < 0.001). Prevalence was significantly lower for the two lowest bins (bin I: < 500 m, 3.3 %, residuals = -8.65, p < 0.001; bin II: 501-1,000 m, 4.4 %, residuals = -6.87, p < 0.001). There were no significant differences from the average prevalence in bin III (1,001-1,500 m, 22.7 %, residuals = 1.87, p = 0.739) or bin IV (1,501-2,000 m, 21.1 %, residuals = 1.89, p = 0.713).
Lewisi clade infections were detected in 90 murid samples (5.1 %) representing 16 endemic and 1 introduced host species and were detected from 9 of 11 localities (Figure 3b; see Appendix I). Prevalence varied among taxa (range 0.6 % to 36.4 %) and localities (χ2 = 43.43, d.f. = 10, p < 0.001). Prevalence was significantly higher than average on Mount Latimojong (11.2 %, residuals = 4.23, p = 0.0005) and Mount Gandang Dewata (10.5 %, residuals = 3.44, p = 0.012). Infections were not significantly different than average for Malili (0.0 %, residuals = -1.56, p = 1.00), Mount Ambang (0.0 %, residuals = -2.12, p = 0.74), Mount Balease (1.4 %, residuals = -1.37, p = 1.00), Mount Bawakaraeng (4.5 %, residuals = -0.42, p = 1.00), Mount Bonggolosapi (2.1 %, residuals = -2.21, p = 0.595), Mount Buliohuto (8.5 %, residuals = 1.25, p = 1.00), Mount Dako (3.5 %, residuals = -1.44, p = 1.00), Mount Katopasa (2.9 %, residuals = -1.29, p = 1.00) or Mount Torompupu (4.5 %, residuals = -0.21, p = 1.00).
For Lewisi clade infections, prevalence varied significantly among elevation bins (χ2 = 21.00, d.f. = 5, p = 0.0008; Figure 4b; see Appendix I), but only elevation bin V (2,001 to 2,500 m) showed a significant increase in prevalence (8.7 %, residuals = 3.45, p = 0.007). There were no significant differences for bins I (< 500 m, 2.4 %, residuals = -2.67, p = 0.092), II (501-1,000 m, 3.3 %, residuals = -1.23, p = 1.00), III (1,001-1,500 m, 3.9 %, residuals = -0.82, p = 1.00), IV (1,501-2,000 m, 4.9 %, residuals = -0.19, p = 1.00), or VI (> 2,500 m, 9.2 %, residuals = 2.02, p = 0.52).
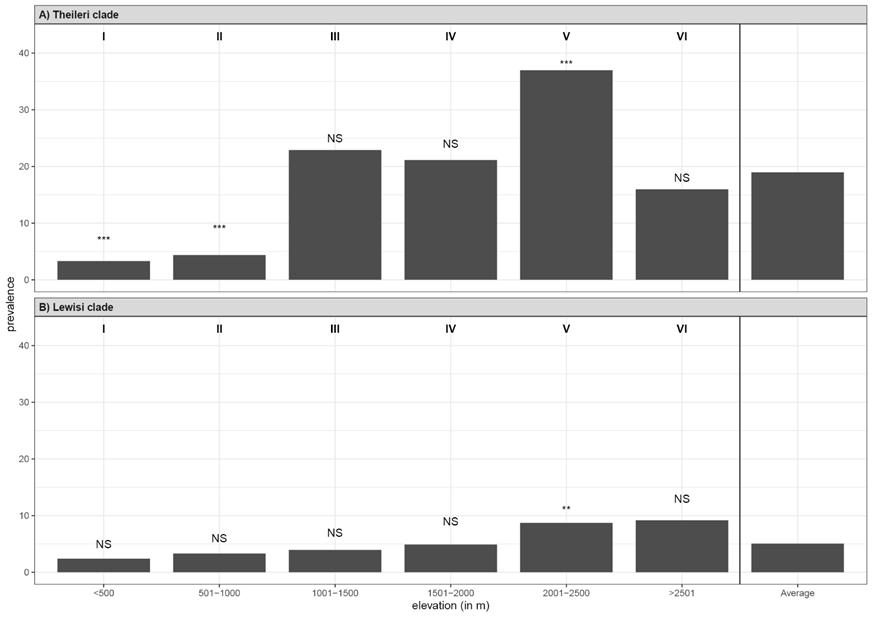
Figure 4 Prevalence of (A) Theileri clade (T. cyclops) and (B) Lewisi clade infections in rodents and shrews by elevation bin combining all localities. Roman numerals represent each elevation bin. The average prevalence for all bins is included on the right. Symbols above the bars indicate significance of prevalence by elevation bin compared to the average for that clade (‘NS’ = not significant, ‘*’ = p = 0.01 - 0.05, ‘**’ = p = 0.001 - 0.01, ‘***’ = < 0.001).
Cruzi clade (Terrestris-like) infections were detected in 11 individuals representing 2 endemic murid host species (1 Taeromys celebensis and 10 Crunomys hellwaldii) They were detected from 3 of 11 localities with all infections occurring in disturbed habitat in elevation bin I (< 500 m; Supplementary Material S1).Trypanosoma conorhini was detected in a single Bunomys andrewsi sample (NMV Z56762) from Mount Katopasa in disturbed habitat in elevation bin I (< 500 m; Supplementary Material S1).
Discussion
The continued detection of zoonotic diseases in human populations has fuelled investment in global wildlife disease surveillance aimed at identifying zoonotic pathogens with potential as emerging infectious diseases in humans (http://www.ceropath.org/; PREDICT Consortium 2020; Blasdell et al. 2022). Most of this work has focused on urban and rural habitats, under the expectation that the greatest risk for zoonotic diseases occurs where human-wildlife interactions are most frequent (Bordes et al. 2013; Blasdell et al. 2019, 2022). However, these habitats support a depauperate host community and much less surveillance occurs in the most biodiverse and intact ecosystems where potential zoonoses may be most prevalent and diverse. Our results with trypanosomes reinforce the notion that the zoonotic risk associated with mammal-borne parasites in tropical Southeast Asia (e. g.Blasdell et al. 2019, 2022) warrants surveillance beyond the edges of human settlement. This expanded effort will be essential to gain a comprehensive understanding of reservoir hosts, disease interactions and transmission risks.
Our results from screening for trypanosome infections in rodents and shrews offers a wildlife disease model of infection prevalence extending from the edge of human settlement into intact forest habitats on the biodiverse and densely populated, tropical island of Sulawesi, Indonesia. Trypanosome infections were dominated by one native species (Theileri clade (T. cyclops)) and one introduced species (Lewisi clade). We detected the native trypanosome in both rodents and shrews and previously reported it from bats (Mursyid et al. 2023) indicating that it infects a wide range of mammalian species. In contrast, the introduced species infected only rodents of the family Muridae. Both the native and introduced trypanosomes were detected in all elevation bins, extending from village edges to intact high-elevation forest. However, infections by both trypanosome clades reached their highest prevalence above 2,000 m elevation in the most intact forest habitats away from human habitation. The high prevalence of introduced Lewisi clade trypanosomes within intact forests and their infection of endemic host species associated with high elevation, primary forest (e. g. Tateomys macrocercus) reveals the capacity of introduced parasites to leave human settlements and penetrate biodiverse ecosystems. The detection of both trypanosome clades in host species with ranges that span all elevations and occur in both intact and disturbed habitats (e. g. Crunomys musschenbroekii, Rattus hoffmanni) reveals the capacity for interactions with a larger number of other host species and that may increase the probability of spillover to reservoir hosts and humans (Bordes et al. 2013, 2015). If trypanosome infections are indicative of zoonotic diseases, they suggest that novel disease interactions among native and introduced pathogens may be most prevalent in the most biodiverse habitats. These habitats beyond, but connected to, human settlement are likely to host a rich assemblage of zoonotic diseases with the potential to impact native wildlife health and lead to novel wildlife-human transmission events with unknown epidemiological effects.
Identifying zoonotic diseases from species inhabiting the most biodiverse and intact habitats will require leveraging all available samples and engaging with biologists collecting samples in remote conditions. Natural history collections house specimens from the breadth of global biodiversity that could be leveraged to a greater extent in wildlife pathogen research and surveillance (DiEuliis et al. 2016; Dunnum et al. 2017; Bell et al. 2018; Schindel and Cook 2018; Colella et al. 2021). Globally, more than 3 billion museum specimens, spanning centuries of collecting, provide unparalleled access to the historical context lacking in most disease ecology research (Harmon et al. 2019; Schmitt et al. 2019; Cook et al. 2020). They have revealed the origins of diseases (e. g. 1918 Spanish Influenza; Taubenberger et al. 2007), detected the invasion of parasites (e. g. Trypanosoma lewisi on Christmas Island; Wyatt et al. 2008), identified the source of disease outbreaks (e. g. Sin Nombre Virus; Yates et al. 2002), and tracked global trends in parasitism (Wood et al. 2023a, 2023b). These specimens retain evidence of infections that have been critical to identifying the geographic and temporal origins of contemporary wildlife diseases such as white-nosed syndrome in bats (Campana et al. 2017), retroviruses in koalas (Ávila-Arcos et al. 2013), and chytrid fungus in amphibians (Cheng et al. 2011; Byrne et al. 2019). By preserving specimens before, during and after disease outbreaks, they provide insight into the evolutionary responses of hosts (Foster et al. 2007; Mikheyev et al. 2015; Cook et al. 2017), vectors (White et al. 2011; Pelissie et al. 2018; Korlević et al. 2021; Meireles et al. 2023), and pathogens (Yates et al. 2002; Tsangaras and Greenwood 2012, 2019; Ávila-Arcos et al. 2013; Nishimura et al. 2022). Holistic specimens preserve the phenotypic evidence of disease on the health and pathology of animals and their trends over time (Rothschild and Panza 2005; Lorch et al. 2021). This notion of the extended phenotype (Webster 2017) revealed by new technologies and new studies of holistic specimens preserved in natural history collections will continue to increase their value to wildlife disease research.
The taxonomically rich, geographically widespread, and temporally deep sampling of natural history collections includes an increasing number of cryogenically frozen tissues, and other material specimens suitable for wildlife disease surveillance. However, a culture of using and growing collections has not been adopted by most global wildlife surveillance projects with few samples deposited in natural history collections and few samples requested for use (Kelly et al. 2020; Colella et al. 2021; Thompson et al. 2021). Our study exemplifies the scope of samples from biodiverse habitats being acquired by natural history collections that could be leveraged by wildlife disease research. In this study, thousands of ethanol-preserved tissue samples used to screen trypanosomes were collected along with holistic voucher specimens and other tissue specimens preserving DNA and RNA and housed in liquid nitrogen that are amenable to further screening of pathogens including bacteria, viruses, and protozoa. Like many collections of this nature, most species sampled in this study have never been screened for wildlife pathogens and represent the vast discovery awaiting collaboration between natural history collections focused on the breadth of biodiversity and veterinary pathologists focused on zoonotic disease surveillance.