


 nueva página del texto (beta)
 Inglés (pdf)
 Artículo en XML
 Referencias del artículo
 Enviar artículo por email
 Citado por SciELO
  Similares en
SciELO
Similares en
SciELO 
 Permalink
Introduction
Estimating the population density of a species allows carrying out comparisons over time and identifying trends in wild populations (Gallina 1994). According to Brown (1984) and Naoki et al. (2006), the factors affecting the distribution and abundance of individuals in a population are the availability and supply of resources in the habitat of each species. In mammals, population density is related to aspects such as habitat size and the supply of food, shelters, and water. In this way, the highest densities are associated with habitats that provide the appropriate resources for each species in quantity and quality (Pettorelli et al. 2001; Marsden and Whiffin 2003).
The white-tailed deer is a mammal species belonging to the family Cervidae that is widely distributed in America from southern Canada to the northern Amazon, ranging from 0 m to 4,000 m above sea level. Its ecological plasticity allows it to settle in tropical rainforests, scrublands, marshlands, and Andean moors, but the savannah is usually the most favorable biome (López-Arévalo et al. 2020). The white-tailed deer has been one of the most studied species throughout its range. Most studies have been carried out in the United States and Canada. In Latin America, the country with the largest number of studies on this species is Mexico (Mandujano 2014); in Colombia, these studies are still very scarce (Mateus-Gutiérrez et al. 2020).
The population density of white-tailed deer throughout its range varies according to the availability of food, water, and shelters, local weather conditions, the presence of predators and competitors, and habitat alterations. The largest abundances have been associated with habitat complexity and vegetation types such as scrub (Gallina 1994; Gallina et al. 1998; Villarreal 1999; Delfín-Alfonso and Gallina 2007; Gallina et al. 2010; Stewart et al. 2011). The anthropic influence related to hunting and proximity to human communities also affects the population dynamics, reflected in a lower deer density in areas closer to human settlements (Flores-Armillas et al. 2011; Ramos-Robles et al. 2013).
On the other hand, the analysis of the age distribution of a population, i. e., the proportion of individuals belonging to a given age class, is a central component of population dynamics, since it provides information about the past and current status of a population, in addition to suggesting future trends (Ojasti 2000). Estimating and analyzing these parameters and the environmental factors that influence them represent baseline information to preserve, use, or monitor wildlife populations (Mandujano 2011). It is believed that a high proportion of juveniles indicates an expanding population, whereas the predominance of adults is characteristic of a stationary or declining population (Ojasti 2000).
In Colombia, the white-tailed deer are distributed throughout most of the territory. However, there are few studies on its population density, and it is considered that the largest populations thrive in La Orinoquia and the Andean region in the Chingaza National Natural Park (NNP; Rojas-Pardo 2010; Mateus-Gutiérrez 2014; Gómez-Castellanos 2017). In the first, population densities between 13 individuals/km2 and 43 ind/km2 have been estimated in two localities of the department of Casanare by direct count along transects (Pérez-Moreno et al. 2020). For the Chingaza NNP, Mateus-Gutiérrez (2014) estimated between 17.8 ind/km2 (Monterredondo) and 23.2 ind/km2 (La Mina) based on counts of fecal groups. For Monterredondo, Gómez- Castellanos (2017) calculated about 8.9 ind/km2 based on counts of fecal groups and identified visibility and distance to water sources as the main factors influencing abundance. Thus, higher abundances are reported in areas with poor visibility, whereas greater distances to water bodies are associated with lower abundances.
In the Chingaza NNP, where moor and submoor vegetation predominate, Aconcha-Abril (2008) found minor variations in the sex ratio in adults (1:0.6 in Monterredondo and 1:0.9 in La Playa) and juveniles (1:1.12 in Monterredondo and 1:1.7 in La Playa). However, the adult:juvenile ratio showed a higher proportion of adults, namely 2:1 in Monterredondo and 3:1 in La Playa. Based on the definition of 3 age classes, namely fawns, juveniles, and adults, a 2:2:7 ratio was calculated for Monterredondo and 2:2:10 for La Mina (Mateus-Gutiérrez 2014) in this protected area.
Rodríguez-Castellanos (2016), using niche models, proposed that the population inhabiting the Chingaza NNP comprises approximately 4,868 individuals distributed in an area of approximately 237,788 km2, equivalent to 31% of the total NNP area. This value suggested a population with exponential growth and with a homogeneous distribution in the protected area; this author used the average population density obtained by Mateus-Gutiérrez (2014). To evaluate spatial and temporal variations in white-tailed deer density, the population density and age structure of this species were estimated in the Monterredondo and La Paila sectors of the Chingaza NNP in 2020.
Materials and methods
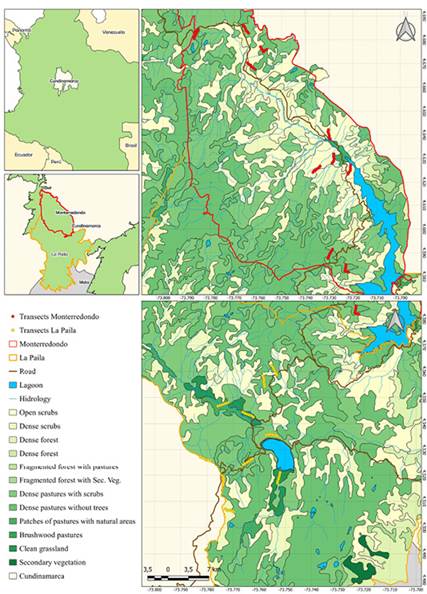
Study Area. The study area is located in the Chingaza National Natural Park, in the eastern Colombian Andes north of Bogotá and in the departments of Cundinamarca and Meta (Figure 1). It stretches across nearly 76,600 ha, through an altitudinal gradient between 800 m and 4,500 m above sea level, but most of the territory is above 3,300 m a.s.l. The rainfall regime is unimodal, with most rainfall concentrated between May and August and the dry season from December to February (Vargas and Pedraza 2003; Plan de Manejo 2014-2018 2013). Within the protected area, 53 plant communities have been described distributed in seven vegetation types, including pajonal, frailejonal, scrubs, pastures, chuscal, moor forest patches, and shrub forests (Vargas and Pedraza 2003).
For this study, we selected the Monterredondo and La Paila sectors (Figure 1) because they differ in physical and biotic characteristics, as well as in the anthropogenic influence. The Monterredondo sector is characterized by open scrubs, dense scrubs, dense forests, fragmented forest with secondary vegetation, dense pastures with scrubs, dense pastures without trees, and patches of grassland alternating with natural vegetation (Figure 2), where the dominant plant cover in this sector is dense pasture with shrubs (Interpretación Visual de Imagen Satelital Landsat 857 2018).
According to the 2014 to 2018 management plan of the Chingaza National Natural Park (Plan de Manejo 2014-2018 2013), Monterredondo is in a fair state of conservation with low functionality. Additionally, this section shows a greater anthropogenic influence since it includes camping areas for tourists, who sometimes offer food to deer (Plan de Manejo 2014-2018 2013).
On the other hand, the Paila sector is covered by open scrubs, dense scrubs, high dense forests, fragmented forests with pastures and crops, fragmented forests with secondary vegetation, dense pastures with scrubs, dense pastures without trees, patches of pastures alternating with natural areas, brushwood pastures, clean grassland, and secondary vegetation (Figure 3), where the high dense forest is the dominant plant cover (Interpretación Visual de Imagen Satelital Landsat 857 2018). This sector harbors submoor species, mainly scrub species of the families Asteraceae (Pentacalia, Diplostephium, and Baccharis), Hypericaceae (Hypericum), and Ericaceae (Macleania, Cavendishia, Gaultheria, and Vaccinium); and moors dominated by frailejonal (Espeletia grandiflora, E. killipii, E. uribei, E. argentea, and Espeletiopsis corymbosa), pajonal (Calamagrostis effusa), and chuscal (Chusquea tessellata).
Population Density. Pellet groups were monitored during two field trips. We visited the transects of each sector twice: first during February and March 2020 and subsequently in December 2020. In each sector, we installed 10 transects measuring 500 m long. Each transect included 51 circular plots with a radius of 2 m placed 10 m apart from each other (Figure 4), for a total of 20 transects and 1,020 plots (510 plots per sector).
GIS tools were used to locate the transects at random, considering the type of plant cover of each sector to capture the greatest diversity in terms of units of vegetation cover and land uses for the two sectors evaluated, i. e., Monterredondo (MR) and La Paila (LP), meeting the requirement to be separated at least 800 m in the range as suggested by Mandujano (2014) and Mandujano and Yáñez-Arenas (2016). Additionally, its orientation was refined taking into account elements such as inclination and supplementary information from the Chingaza NNP trail and track network.
In each plot, all fecal pellet groups found were collected, noting the number of pellets, appearance, and texture, considering the report by Mateus-Gutiérrez (2014); one pellet group corresponded to the total number of pellets with similar characteristics grouped in the sampling area (Gallina et al. 2014). Additionally, we recorded the date, sector, transect, and plot. When a pellet group was found at the transect boundary, it was recorded if more than 50% of it was within the plot (Mateus-Gutiérrez 2014).
Population density was estimated using the Eberhardt and Van Etten (1956) model with the following equation, which calculates the number of individuals per square kilometer from the number of fecal pellet groups: D = (NP)(PG)/(TP)(TD). Where NP is the number of circular plots or fixed-width transects that fit in 1 km2. PG is the mean number of pellet groups per parcel or transect. TP is the decomposition time of pellet groups when using the Fecal Standing Crop (FSC) technique or the deposition rate of pellet groups with the Fecal Accumulation Rate (FAR) technique, and TD is the defecation rate.
The White-tailed deer population density was estimated using the FSC and FAR techniques; the FSC technique uses the daily defecation rate and stool persistence to estimate density by analyzing all fecal pellet groups in the plots visited on a sampling trip (Gallina et al. 2014). The FAR technique uses the deposition rate of fecal pellet groups and is used when each transect is visited more than once. In this study, transects were sampled on two occasions and the period between the first and second samplings was approximately 300 days for La Paila and 273 for Monterredondo, this due to the closure of the protected area after the COVID-19 pandemic was declared.
A standard defecation rate of 12.7 fecal pellet groups/ind/day obtained from the Eberhardt and Van Etten (1956) model is usually used. However, for this study, we used the values obtained by Mateus-Gutiérrez (2014) in the Chingaza NNP, namely, a defecation rate of 23.26 fecal pellet groups/ind/day and a decomposition time of 277.80 days (Table 1).
Furthermore, density was estimated with the semiautomated PELLET procedure for Excel, developed by Mandujano (2014), in which density is calculated assuming that it depends on the variation of parameters such as defecation rate, time of permanence of the fecal pellet group, and spatial distribution of pellet groups. This seeks to remove the subjectivity by reporting a single value, and incorporates the uncertainty of this type of sampling. The value using PELLET is reported as the mean plus/minus the standard deviation since it is calculated from three defecation rate values, including the one estimated by Mateus-Gutiérrez (2014).
Age Structure and Sex Ratio. To analyze the age structure and sex ratio of white-tailed deer in two sectors of the Chingaza NNP, the longest and shortest lengths were recorded for each pellet; then, the volume of each pellet, the relationship between the two lengths and the means of these variables for each pellet group were calculated.
Fecal pellet groups were first sorted into three age classes based on pellet volume: fawns (0 mm3 to 290 mm3), juveniles (291 mm3 to 605 mm3), and adults (at least 605 mm3; Vega et al. 2019). Subsequently, fecal pellet groups in the adult class were sorted by sex using clustering analyses; the first was an analysis of k-means establishing two groups, which corresponded to the two sexes (Mateus-Gutiérrez 2014). The second analysis was performed using the Fuzzy clustering tool, selecting two groups corresponding to males and females. Both analyses were carried out using the NCSS program (Sánchez-Rojas et al. 2009).
Results
Between February and March 2020, 104 fecal pellet groups were recorded and collected in the Monterredondo sector and 70 pellet groups in La Paila; in December 2020, 85 pellet groups were collected in Monterredondo and 42 in La Paila (Table 1).
Table 1 Values for the calculation of the population density of white-tailed deer in the Monterredondo and La Paila sectors in the Chingaza National Natural Park obtained between February and March (Mar) 2020 and December (Dec) 2020.
| Monterredondo | La Paila | |
|---|---|---|
| No. of transects | 10 | 10 |
| Transect area (m2) | 2,000 | 2000 |
| Sampled area (m2) | 6,405.6 | 6405.6 |
| No. of plots | 510 | 510 |
| No. of fecal pellet groups recorded | 104 (Mar) - 85 (Dec) | 70 (Mar) - 42 (Dec) |
| Mean number of pellet groups per plot | 0.204 | 0.137 |
| Decomposition time | 277.8 days | 277.8 days |
| Defecation rate | 23.26 pellet groups/ind/day | 23.26 pellet groups/ind/day |
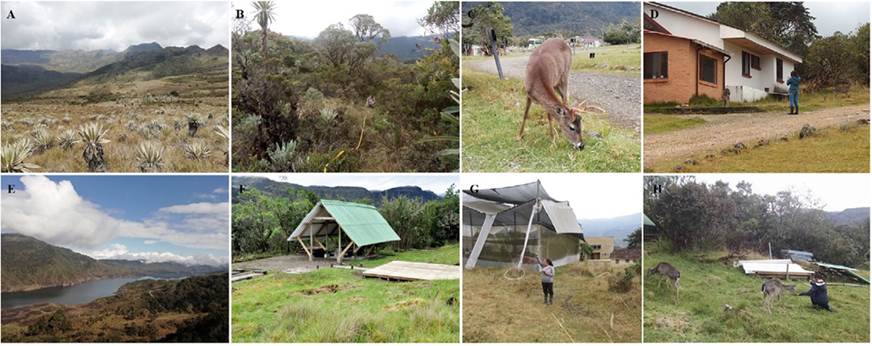
Figure 2 Photographs of some of the types of vegetation and land use in the Monterredondo sector. A) Dense pasture without trees. B) Dense shrubland. C) Deer in the vicinity of the National Natural Park facilities. D) Deer close to visitors and the house. E) Chuza Reservoir. F) Camping area. G) Plant nursery. H) Visitor feeding a deer.
The three estimates were obtained; with the first (FSC February), the calculated density for the Monterredondo sector (2.51 ind/km2) was higher than the density calculated for La Paila (1.69 ind/km2). Estimates using the semi-automated PELLET procedure for Excel yielded values of 0.7 ± 0.6 ind/km2 and 0.5 ± 0.8 ind/km2 for Monterredondo and La Paila, respectively. With the second estimate (FSC December), the above pattern was maintained, showing a higher density in the Monterredondo sector (2.06 ind/km2) than in La Paila (1.01 ind/km2). The PELLET procedure calculated 0.28 ± 0.3 ind/km2 for Monterredondo and 0.09 ± 0.1 ind/km2 for La Paila (Table 2). With the last estimate using the FAR technique, the deer density was 2.09 ind/km2 for the Monterredondo sector and 0.94 ind/km2 for La Paila. Using PELLET for Excel, the population density values were 0.37 ± 0.4 ind/km2 for Monterredondo and 0.16 ± 0.2 ind/km2 for La Paila (Table 2).
Age Structure and Sex Ratio. When the fecal pellet groups collected throughout the sampling period using the volume ranges proposed by Vega et al. (2019), the estimated proportion of age classes (adult, juvenile, and fawn) for the Monterredondo sector was 1:0.29:0, equivalent to 147 adults, 42 juveniles, and no fawns; for La Paila, the proportion was 1:0.57:0.04, corresponding to 69 adults, 39 juveniles and 3 fawns. It is worth noting that La Paila was the only sector where fecal pellet groups corresponding to fawns were found based on their volume.
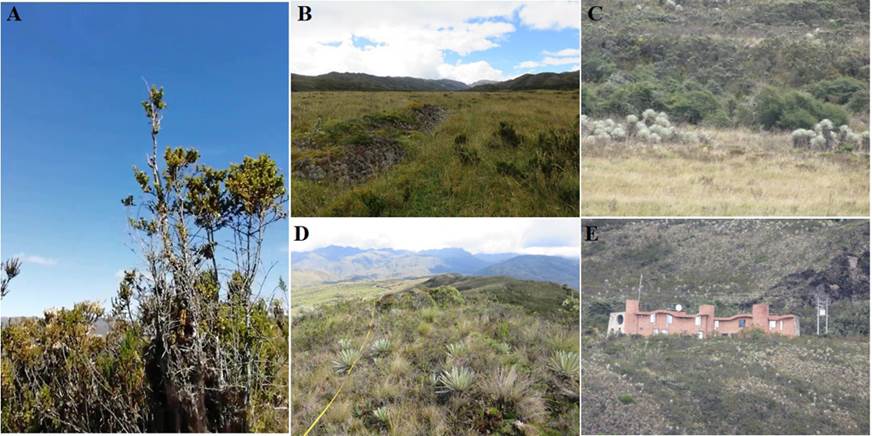
Figure 3 Photographs of some of the types of vegetation and land use in the La Paila sector. A) Dense shrubland. B) Clean grasslands. C) Mosaic of pastures with natural areas. D) Dense pastures without trees. E) Facilities of the National Natural Park.
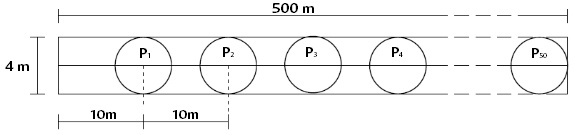
Figure 4 Arrangement of circular plots in a fixed-width transect of 500 m x 4 m (Modified from Mateus-Gutiérrez 2014).
Once the data were sorted out, the initial analysis of k-means classified the 147 adults of the Monterredondo sector into 57 males and 90 females (Figure 5a); in La Paila, the 69 adults were sorted into 16 males and 53 females (Figure 5b, in blue). It is evident that Monterredondo was the sector that housed most adults and, in general, white-tailed deer individuals.
When adults are sorted by sex using the Fuzzy clustering analysis, the male to female ratio was 1:1.1 for Monterredondo and 1:1.46 for La Paila; these values correspond to 70 males and 77 females in Monterredondo and 28 males and 41 females in La Paila. The estimates from the two analyses differ in the number of individuals grouped of each sex.
These analyses were also performed separating the two sampling times, i. e., February- March and December. For the Monterredondo sector, the value with the greatest variation was the number of juveniles because the December sample showed a lower number of juveniles. In La Paila, the number of fecal pellets identified as males was the one with the largest variation, as fewer males were recorded in December (Table 4).
Table 2 Values for the calculation of the population density of white-tailed deer in the Monterredondo and La Paila sectors in the Chingaza National Natural Park using the FAR (Fecal Accumulation Rate) and FSC (Fecal Standing Crop) techniques.
| Methodology | Monterredondo | La Paila | |
|---|---|---|---|
| PELLET | FSC February | 0.70 ± 0.6 ind/km2 | 0.50 ± 0.8 ind/km2 |
| FSC December | 0.28 ± 0.3 ind/km2 | 0.09 ± 0.1 ind/km2 | |
| FAR (total) | 0.37 ± 0.4 ind/km2 | 0.16 ± 0.2 ind/km2 | |
| Eberhardt and Van Etten 1956 | FSC February | 2.51 ± 0.6 ind/km2 | 1.69 ± 0.6 ind/km2 |
| FSC December | 2.06 ± 0.6 ind/km2 | 1.01 ± 0.6 ind/km2 | |
| FAR (total) | 2.09 ± 0.6 ind/km2 | 0.94 ± 0.6 ind/km2 |
Table 3 Temporal and spatial comparison of population density estimates of white-tailed deer in three sectors of the Chingaza National Natural Park using the Eberhardt and Van Etten (1956) methodology and a defecation rate of 23.26 fecal groups/ind/day in all cases.
| Source | Technique | La Mina | Monterredondo | La Paila |
|---|---|---|---|---|
| Mateus-Gutiérrez (2014) | FSC | 17.77 ind/km2 | ||
| Mateus-Gutiérrez (2014) | FSC | 23.18 ind/km2 | ||
| Gómez-Castellanos (2017) | 8.90 ind/km2 | |||
| Caguazango et al. (2019) | 0.09 ind/km2 | |||
| Este estudio (2020) | FSC Feb | 2.51 ind/km2 | 1.69 ind/km2 | |
| FSC Dic | 2.06 ind/km2 | 1.01 ind/km2 | ||
| FAR | 2.09 ind/km2 | 0.94 ind/km2 |
Discussion
The results of this study suggest that the population density of white tailed deer varies temporarily in the two sectors studied, and a decrease in the number of deer per square kilometer has been observed in recent years. Unlike studies carried out in the protected area indicating that the deer population is experiencing exponential growth (Rodríguez-Castellanos 2016), the samples collected in subsequent years, including the present study, suggest that the population density of deers has declined (Figure 6).
Table 4 Clustering analysis using K-means and Fuzzy clustering for the sectors in the two samplings.
| Monterredondo | La Paila | |||||||
|---|---|---|---|---|---|---|---|---|
| February - March | December | February - March | December | |||||
| K-means | Fuzzy | K-means | Fuzzy | K-means | Fuzzy | K-means | Fuzzy | |
| Female | 45 | 37 | 36 | 36 | 36 | 26 | 17 | 11 |
| Male | 27 | 35 | 39 | 39 | 15 | 25 | 1 | 7 |
| Juvenile | 32 | 32 | 10 | 10 | 18 | 18 | 21 | 21 |
| Fawn | 0 | 0 | 0 | 0 | 1 | 1 | 2 | 2 |
When comparing the values estimated by the techniques used (FSC February, FSC December, and FAR) with the methodologies studied (PELLET procedure and Eberhardt and Van Etten 1956), it can be observed that in all cases, the absolute values obtained with the Eberhardt and Van Etten model exceed the upper limit of the intervals obtained with PELLET. Furthermore, the value calculated with FCS February was higher than the two that followed (FSC December and FAR) in all cases; however, no significant differences were observed in these values between sectors or sampling times (P > 0.05). The analysis of population density values estimated in previous studies (Table 3) shows variation not only between the sectors within the protected area, with La Paila having the lowest deer density, but also a trend of decreasing population density to the present time.
Thus, the density calculated for the Monterredondo sector in this study ranges between 2.06 ind/km2 and 2.51 ind/km2, which is lower than the value calculated by Mateus-Gutiérrez (2014) and Gómez-Castellanos (2017), where density was 17.8 ind/km2 and 8.9 ind/km2, respectively. Other estimates of population density in localities near the Monterredondo sector for similar plant covers ranged between 4.6 ind/km2 and 8 ind/km2 (Gómez-Castellanos 2017), which are higher than the value obtained in this study. Moreover, when comparing the data with the study carried out by Ramos (1995), the defecation rate was modified by 12.7 pellet groups/ind/day, resulting in a population density of 4.6 ind/km2 for 2020, higher than that reported by Ramos (1995) of 1 ind/km2.
Taking into account the above, Rodríguez-Castellanos (2016) reported 4868 white-tailed deer in the Chingaza NNP. However, this value may be overestimated since the modeling was based on the density reported by Mateus-Gutiérrez (2014) in one of the sectors where the presence of the species was most evident; additionally, this estimate does not take into account the spatial variation in population density observed in the present study.
For the La Paila sector, three estimates have been obtained, in which the deer population density was 28.5 ind/km2, 0.084 ind/km2, and 0.94 ind/km2 in 2004, 2019, and 2020, respectively (Rodríguez et al. 2004; Caguazango et al. 2019; this study). According to the above, although the defecation rate used in these estimates was different, the trend to decrease over time is maintained.
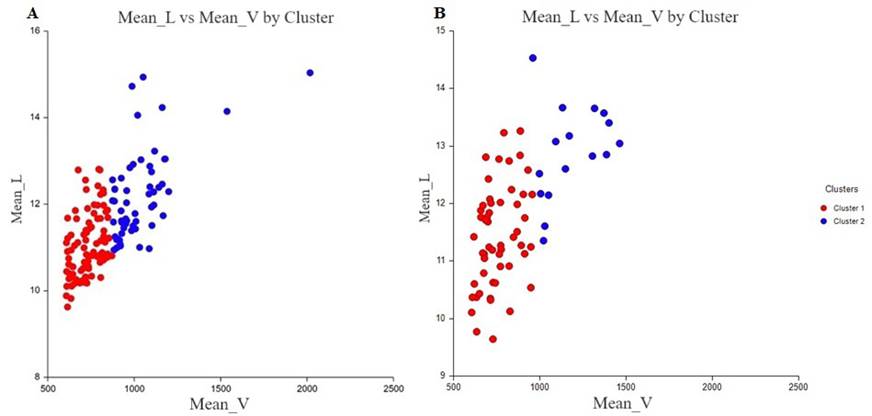
Figure 5 Plot of K-means for the whole sampling in a) Monterredondo and b) La Paila. Cluster 1, in red, corresponds to female pellet groups. Cluster 2, in blue, corresponds to male pellet groups.
With respect to the findings reported for other moors of Colombia, the values obtained in the present study are higher than the figure reported by Garavito (2004) of 1.1 x 10⁻⁴ ind/km2. In contrast, for the Soata moor in Boyacá (Alarcón 2009), deer densities were similar (between 2.44 ind/km2 and 3.54 ind/km2), which lie within the range estimated in the present study. In general, in Colombia the most abundant white-tailed deer populations are found towards the eastern plains in flooding savannah ecosystems where they range between 13 ind/km2 and 43 ind/km2 based on direct counts (Pérez-Moreno et al. 2020). When the population densities estimated for the two Chingaza NNP sectors in the present study are compared with those reported for moor ecosystems in Ecuador (1.6 ind/km2; Albuja 2007), it is evident that the deer density is higher in the Chingaza moor.
With respect to the densities estimated in studies carried out in other countries, the deer density in Chingaza is similar to those reported by Valenzuela (1994), Ortiz-Martínez et al. (2005) and López-Téllez et al. (2007) in México, 4.83 ind/km2, 2.28 ind/km2, and 1.08 ind/km2, respectively, and lower than those reported by Mandujano (1992), Gallina (1994), and Camargo-Sanabria (2008) corresponding to 28.1 ind/km2, 21 ind/km2, and 5 ind/km2. On the other hand, the population density obtained in this study lies within the range calculated for Honduras, between 1.35 ind/km2 and 10 ind/km2 (Portillo et al. 2015).
The white-tailed deer population density is affected by factors including food, water, and shelter availability, the presence of predators and competitors, and hunting and proximity to human settlements (Brokx 1984; Gallina 1994; Gallina et al. 1998; Villarreal 1999; Delfín- Alfonso and Gallina 2007; Gallina et al. 2010). In the present study, the estimated density for the evaluated sectors may be influenced by hunting, the presence of predators such as puma (Puma concolor), of which there are records in the foothills of the protected area (El Espectador 2016), the largest presence of the spectacle bear in the park (Parra-Romero et al. 2017), and competition with domestic herbivores (Sánchez-Rojas et al. 2009). With respect to the latter, cows were observed during the sampling, mainly in La Paila, which exposes deers to the risk of contagion of zoonotic diseases that may decrease their abundance (Martínez et al. 1999; Campbell 2009; Villarreal-Espino et al. 2011; Elías and Vásquez 2016).
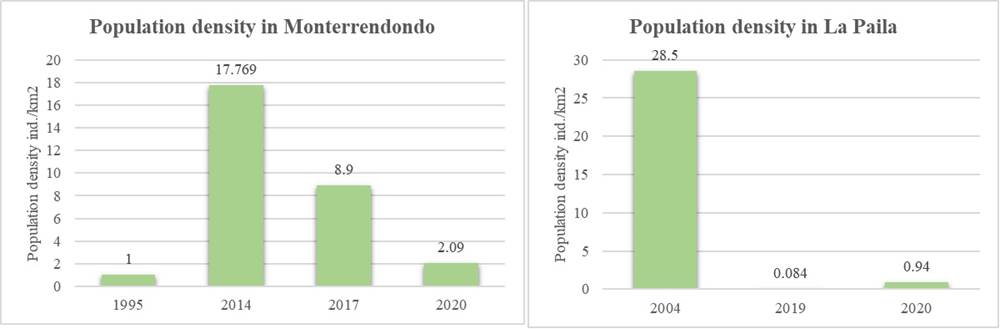
Figure 6 Variation in white-tailed deer population density in two sectors of the Chingaza National Natural Park since 1995 to date (Ramos 1995; Rodriguez et al. 2004; Mateus-Gutiérrez 2014; Gómez-Castellanos 2017; Caguazango et al. 2019; this study 2020).
Additionally, there is evidence of the presence of feral dog herds spotted in various sectors of the park through sequences of photos in camera traps, and accounts of local inhabitants reporting these herds chasing to death white-tailed deers (Reatiga 2015; Rodriguez et al. 2019). These represent the factor that probably causes the greatest reduction in the population studied in the protected area (Plan de Manejo 2014-2018 2013). In this sense, better control of feral dogs in the Monterredondo sector associated with increased human activity, park rangers, and visitors, probably contributes to the higher deer density in this sector than in La Paila. Separately, according to Duarte et al. (2016), the presence of feral dogs reduces the diversity and abundance of wild animals in natural areas, and white-tailed deer is one of the species most affected by the presence of feral dogs (Bergman et al. 2009). Therefore, controlling feral dog herds in the protected area is essential for the conservation of white-tailed deer.
On the other hand, the variation in deer population density estimates may be related to the fact that the places where transects were installed in Monterredondo in previous studies were selected after confirming the presence of white-tailed deer, while in the 2020 study, they were installed at random and stratified. In addition to the fact that sampling in transects installed with prior knowledge of the areas frequented by deer may lead to overestimating population densities and pose a risk for the species related to its exploitation (Mandujano 2014), random sampling provides better data on population variation (Galindo-Leal and Weber 1998, cited in Pineda 2006). For this reason, Camargo-Sanabria (2004) and Gallina et al. (2014) recommend that transects be installed in a stratified manner according to the types of plant cover or habitat quality.
In general, it is estimated that a stable deer population should show an age distribution approximating the 3:2:5 ratio, where the highest proportion is assigned to adults (Teer et al. 1965). According to Ojasti (2000), populations with a high proportion of juveniles are expanding, while the predominance of adults is usually related to stationary or declining populations; however, adults are reproductive members of the population that can increase the number of individuals.
In the present study, the estimated population structure (adults:juveniles:fawns) was 1:0.29:0 for Monterredondo and 1:0.57:0.04 for La Paila, evidencing a higher proportion of adults in both sections, consistent with the reports by Mateus-Gutiérrez (2014; 8:2:2 and 10:2:2) and Aconcha-Abril (2008), who found a higher proportion of adults in relation to juveniles (2:1) in Monterredondo, in the Chingaza NNP. These results differ from Valenzuela (1994) and Gallina (1994), who reported a higher proportion of fawns and a higher proportion of juveniles, with 0.23:0.27:0.43 and 0.21:0.51:0.28, respectively. In the case of Gallina (1994), these results may be influenced by poaching and the presence of predators such as puma in the area, which exert greater pressure on adults, leading to their decrease.
Finally, since the management and conservation of deer must be based on population monitoring with reliable estimates of the number of individuals in the areas of interest (Mandujano 2014) - in this case the Chingaza PNN - it is proposed that the deer population density be calculated and studied differentially by park sectors. Also, we recommend that it be estimated with the semi-automated PELLET for Excel procedure developed by Mandujano (2014), which allows calculating a range for population density instead of a single value, thus incorporating the variation of parameters such as defecation rate and pellet decomposition time.
Considering the above, we recommend conducting continuous monitoring of the population using these indirect sampling techniques that offer advantages such as that the observer does not disrupt the study population, and the study is not affected by environmental conditions interfering with the visualization of individuals, among others. In addition, defecation rates and decomposition times already calculated for the area should be used or recalculated during the study following the sampling design recommendations proposed by Mandujano (2014).
Conclusions. The white-tailed deer populations studied in the two sectors of the Chingaza National Natural Park, Monterredondo and La Paila, showed temporal variations evident as a decrease compared to the values reported by previous studies for this same area. According to these studies, the highest abundance of deer was recorded in 2004 for La Paila and in 2014 for Monterredondo; the estimated number of individuals has been decreasing since then.
Furthermore, population density varies spatially, showing a higher population density in Monterredondo compared to La Paila, based on estimates with the two methods and the three techniques used. However, the age structure data suggest that the population is stable, since the largest proportion of individuals corresponds to the adult class, with an evident presence of juveniles and fawns.

