


 nueva página del texto (beta)
 Inglés (pdf)
 Artículo en XML
 Referencias del artículo
 Enviar artículo por email
 Citado por SciELO
  Similares en
SciELO
Similares en
SciELO 
 Permalink
Introduction
The Neotropics is characterized by a high mammal richness, with 1,617 of the 6,495 species known worldwide (Burgin et al. 2018). Perú is the second most diverse country in mammals in South America, with 573 species grouped into 223 genera (Pacheco et al. 2021). Twenty-one of the mammal species registered for Peru are endemic to the country and listed in some threat category. The Manu Biosphere Reserve, in southeast Perú, is home to 222 species, accounting for 39 % of the species recorded in Perú (Solari et al. 2006). The number of species recorded in Perú and this reserve may increase because many areas are still unexplored or with little sampling effort (Pacheco et al. 2009, 2021). Mammals are frequently used in conservation as key, flag, and umbrella species for various reasons, such as their central role in trophic webs, charisma, and broad distribution (Thornton et al. 2016; Figel et al. 2018).
The distribution range of a species stretches from a center of abundance to barriers that limit its dispersion (Grinnell 1914; Aliaga-Samanez et al. 2020). These can be intangible, such as inter-and intraspecific relationships and climatic factors, or tangible, such as rivers, mountains, and land-use changes (Wallace 1854; Grinnell 1914; Oswald et al. 2016; Aliaga-Samanez et al. 2020). The permeability of barriers varies depending on the characteristics of each species and may even change over time (Aliaga-Samanez et al. 2020). These barriers lead to variations in the composition of communities and their diversity in landscape units or surrounding landscapes (Grinnell 1914; Ayres and Clutton-Brock 1992; Gascon et al. 2000).
Some studies have addressed mammal diversity and its differences between landscape types or vegetation units (Pérez-Irineo and Santos-Moreno 2010; Aquino et al. 2012; Cruz-Jácome et al. 2015; Hernández-Pérez et al. 2015; Li et al. 2021). In recent years, the use of trap cameras for the study of mammals has increased significantly since they are considered an affordable, reliable, and non-invasive research tool that allows for recording cryptic and evasive species (Pérez-Irineo and Santos-Moreno 2010; Hernández-Pérez et al. 2015; Mosquera-Guerra et al. 2018). Camera traps facilitate data collection to calculate relative abundance, activity patterns, diversity, and spatial variation (Cruz-Jácome et al. 2015; Hernández-Pérez et al. 2015; Mosquera-Guerra et al. 2018). This information is important to define priority conservation areas with quantitative methods, such as those proposed by Chávez-Gonzalez et al. (2014), or to contribute additional information to improve existing proposals in priority areas (Monroy-Vilchis et al. 2011; Mosquera-Guerra et al. 2018).
Priority conservation areas are threatened by the expansion of the agricultural frontier and road networks, incorporation of pollutants from areas outside their limits, and resource overexploitation due to the intensification of hunting and fishing (Osores-Plenge et al. 2012; SERNANP 2019; Shepard et al. 2010). In and around priority conservation areas, many mammal species are used as a source of protein (bushmeat) for cultural reasons, subsistence, and growing economic needs (Aquino et al. 2007; Fa et al. 2013). In this context, 25 % of species consumed as bushmeat in South America are under some category of threat according to IUCN, so their vulnerability is intensified by overhunting (Aquino et al. 2007; Fa et al. 2013). One of the priority conservation areas in Peru is the Manu Biosphere Reserve (RBM, for its acronym in Spanish; SERNANP 2019).
The RBM comprises an area of 1,881,200 ha, including a core area (Manu National Park) and a buffer zone (SERNANP 2019). This reserve is considered a conservation hotspot due to its high biological diversity (Myers et al. 2000) as a result of the different climate types and broad altitudinal range within its area (Smith et al. 2008; Serrano-Rojas et al. 2022). The RBM is home to a wide variety of ecosystems, the most representative of which are the pajonal, the high tropical forest, and the low tropical forest (SERNANP 2019). These and other ecosystems are delimited by geographic barriers that restrain species distribution.
This study aimed to investigate the variation in mammal diversity at three sites within the RBM, each subject to different forms of protection: government-managed, privately-managed, and unprotected. The study also sought to document observations related to both tangible physical barriers, such as the Alto Madre de Dios River and Cerro Teparo Punta, and intangible barriers, including anthropogenic activities and their interactions with mammalian communities.
Materials and methods
Study area. The present work was carried out in the district and province of Manu, in the department of Madre de Dios within the RBM (Figure 1). Phototrapping was carried out at three sites with different degrees of conservation, separated by geographic barriers between them, and at different distances from urban and rural settlements:
Piñi piñi (-12.770769 °S, -71.489761 °W): Region adjacent to the upper Piñi Piñi River at 618 masl in the Manu National Park. This site is under strict protection by the Peruvian government through the Ministry of the Environment. It is located 15 km from the native community of Santa Rosa de Huacaria (-12.886353 °S, -71.4407001 °W and 4.5 km from the Amalia indigenous people in initial contact settlement (-12.742430 °S, -71.524425 °W). Santa Rosa de Huacaria belongs to the Huachperi-Matsigenka tribe and the Amalia settlement to the Matsigenka tribe. The main activities of these communities are small-scale agriculture for self-consumption and bushmeat hunting (e. g., Ateles chamek, Tayassu peccari, Cuniculus paca, Dasyprocta punctata, Alouatta seniculus, and Crax tuberosum) (Da Silva et al. 2005). It is located 19 km from Pillcopata, a major town where there is constant trade and home to hunters who use rifles and similar guns for bushmeat hunting (e. g., Tayassu peccari, Cuniculus paca, Dasyprocta punctata, and Crax tuberosum). It is separated from the Manu Learning Centre biological field station and Aguanos by the Cerro Teparo Punta, a hill stretching from the Coñec pongo up to 56 km northwestward, from where trap cameras have been installed. According to Servicio Nacional de Metereología e Hidrología del Perú (SENAMHI 2020), the local climate is rainy with a dry and temperate winter (B(i)B’).
The Manu Learning Centre Biological Field Station (MLC; -12.809389 °S, -71.396056 °W) is situated on the left bank of the Alto Madre de Dios River at an elevation of 524 meters above sea level (asl) in the Manu National Park buffer zone. The station is enveloped by a secondary forest that has been undergoing a self-recovery process for over 30 years. It serves as a hub for biodiversity monitoring and ecotourism activities, and is not supported by government protection but is managed as a private conservation area by the Crees Foundation. It is 19 km from the native Palotoa Teparo community (Matsigenka tribe) on the same left bank of the Alto Madre de Dios River, 2.5 km from the Aguanos village, and 6 km from the Salvacion village, which is the main commercial trade center home to hunters who use firearms. According to SENAMHI (2020), the local climate is rainy with high humidity the year round (B(r)B’).
Aguanos (-12.800532 °S, -71.372436 °W): It is located on the right bank of the Alto Madre de Dios River at 470 m asl in the RBM buffer zone, with neither government nor private protection, administered under the local government of the Manu province. It is a hamlet dedicated mainly to growing bananas (Musa paradisiaca) and papaya (Carica papaya; Santiago-Corisepa et al. 2022). The Villa Salvación village center (-12.836485 °S, - 71.361210 °W) is 5 km away. According to SENAMHI (2020), the local climate is rainy with high humidity the year round (B(r)B’).
Sampling with trap cameras. At each study site, eight stations were established, distributed within a system of grids of two quadrants, separated from each other by a minimum distance of 1 km. In each station, we placed a camera trap at a height between 30 and 40 cm from the ground and set to capture 15-second videos with 30-second intervals between captures. At each station, cameras were in operation for three months between June and September, corresponding to the dry season in Peru (with 90 hours of effort per station). Those records separated by more than 1 hour were considered independent records for the analyses (Oliveira et al. 2020).
Identification and taxonomic criteria. Species identification was performed by comparison with previous records in the Crees Foundation database and using the descriptions by Emmons and Francois (1990). Species were listed, and scientific names were updated considering the proposal of Pacheco et al. (2021).
Data analysis. Potential differences between the three protection levels were investigated using a similarity analysis (ANOSIM) and a non-metric multidimensional scaling (NMDS). ANOSIM is a non-parametric test that uses permutations to calculate differences between groups; in the study, the groups are the eight sampling stations for each forest type (Legendre and Legendre 1983). The NMDS is an ordination method to detect differences between groups using a distance measure, in this case, the Bray-Curtis distance (Legendre and Legendre 1983). The radius of each circle surrounding each point is inversely proportional to the distance to the geometric centroid of the eight sampling points of each forest type.
To determine which of the three forest types is more diverse, we performed Hill’s alpha diversity and evenness indices, and rarefaction analyses. Hill’s diversity and evenness indices show a better diversity approximation than conventional diversity indices (Hill 1973). Hill’s evenness index was calculated by dividing Hill’s number of order 0 (N(0)) by the number of order 1 (N(1)).
To define whether the differences in the three protection level types are due to changes in composition, we constructed rank-abundance curves and performed a Bray-Cutis (Bray) beta diversity partitioning analysis. Beta diversity partitioning allows splitting the Bray-Curtis distance into a balanced variation resulting from changes in community composition and variation in gradients associated with the reduction in community richness and abundance (Jost 2007; Baselga 2013, 2017).
Preferences of some mammal species for a given degree of protection were explored through a correspondence analysis (CA). CA is an ordination method that reveals differences between objects and plots the descriptors associated with them using the Chi-square distance (Legendre and Legendre 1983). CA was carried out considering the type-I scaling, excluding species that were only recorded once. All the analyses and graphs were performed using the Python 3.10.9 programming language in the Spyder 5.4.2 IDE, using the packages NumPy 1.24, eCopy 0.1.2.2, Pandas 1.5.3, and Matplotlib 3.7.0.
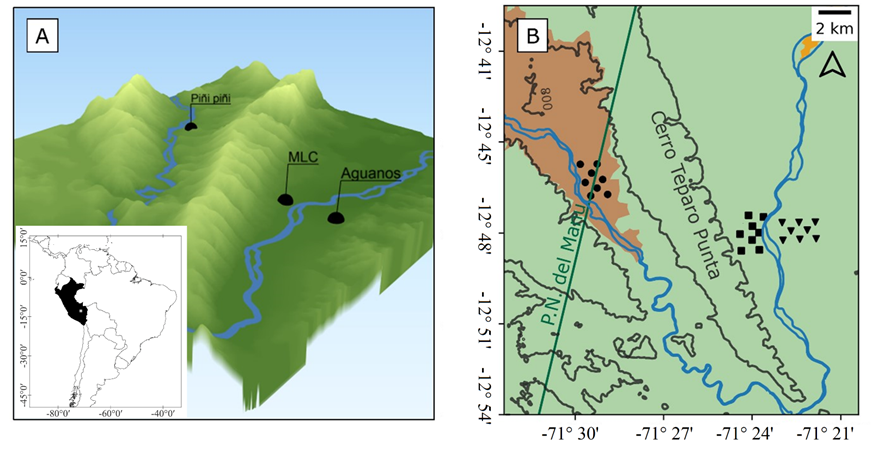
Figure 1 Study area. a) Three-dimensional elevation map showing the mountain formations, Madre de Dios River, Piñi Piñi River, and collection sites. b) Map of the layout of camera traps used in the study area showing mountain ranges, climate types according to SENAMHI (2020). Light green. weather A(r)A’; Light orange. weather B(r)B’; Line green. edge of Manu National Park; Black triangle. Aguanos; Black circle. Piñi piñi; Black square. MLC biological station.
Results
A total of 193 individuals of 36 species were recorded with a sampling effort of 2,160 h. The most abundant species was Cuniculus paca, with 21 individuals, followed by Dasypus novemcinctus and Mazama americana, with 19 individuals each. The families with the highest species richness were Didelphidae and Felidae, with five recorded species each. The most abundant families were Felidae, with 36 individuals; Cuniculidae, with 21; and Dasypodidae and Cervidae, with 19 individuals each. Cuniculus paca, M. americana, and D. novemcinctus are abundantly distributed in the three protection levels, being considered dominant species across the entire study area. Within the family Felidae, the dominant species in the three protection levels was Leopardus pardalis (Table 1).
Table 1 Abundance and richness of mammals collected in the study. Cod, name code; Ag, Aguanos; Pi, Piñi Piñi; M, Biological Station Manu Learning Centre; To, total, CA, conservation level according to SERFOR (2018). IUCN, threat category according to IUCN (2022); LC, Least Concern; EN, Endangered; VU, Vulnerable; NT, Near Threatened
| Familia | Especie | Nombre | Cod | Ag. | Pi | M | To | CA | IUCN |
|---|---|---|---|---|---|---|---|---|---|
| Sciuridae | Microsciurus flaviventer | Amazon Dwarf Squirrel | Amarel | 0 | 0 | 1 | 1 | DI | LC |
| Sciuridae | Hadrosciurus ignitus | Bolivian Squirrel | Bolrel | 0 | 0 | 2 | 2 | - | LC |
| Leporidae | Sylvilagus brasiliensis | Brazilian Rabbit | Brabit | 3 | 1 | 1 | 5 | - | EN |
| Pitheciidae | Callicebus urubambensis | Brown Titi Monkey | Broey | 0 | 0 | 1 | 1 | - | - |
| Didelphidae | Metachirus myosuros | Brown Four-Eyed Opossum | Brosum | 0 | 0 | 1 | 1 | - | - |
| Dasyproctidae | Dasyprocta variegata | Brown Agouti | Brouti | 6 | 2 | 2 | 10 | - | LC |
| Tayassuidae | Dicotyles tajacu | Collared Peccary | Colary | 8 | 0 | 4 | 12 | - | - |
| Didelphidae | Didelphis marsupialis | Common Opossum | Comsum | 5 | 0 | 1 | 6 | - | LC |
| Procyonidae | Procyon cancrivorus | Crab-Eating Raccoon | Craoon | 0 | 0 | 1 | 1 | - | LC |
| Chlamyphoridae | Priodontes maximus | Giant Armadillo | Giallo | 1 | 2 | 4 | 7 | V | VU |
| Myrmecophagidae | Myrmecophaga tridactyla | Giant Anteater | Giater | 3 | 1 | 4 | 8 | V | VU |
| Didelphidae | Philander sp. | Gray Four-Eyed Opossum | Grasum | 0 | 0 | 1 | 1 | - | - |
| Mustelidae | Galictis vittata | Grison | Grison | 1 | 0 | 0 | 1 | - | LC |
| Felidae | Puma yagouaroundi | Jaguarundi | Jagndi | 2 | 2 | 0 | 4 | - | LC |
| Felidae | Panthera onca | Jaguar | Jaguar | 2 | 1 | 2 | 5 | CA | NT |
| Procyonidae | Potos flavus | Kinkajou | Kinjou | 1 | 0 | 0 | 1 | - | LC |
| Cebidae | Cebus apella | Large-Headed Capuchin | Larhin | 0 | 1 | 0 | 1 | - | LC |
| Cuniculidae | Cuniculus paca | Lowland Paca | Lowaca | 7 | 6 | 8 | 21 | - | LC |
| Tapiridae | Tapirus terrestris | Lowland Tapir | Lowpir | 4 | 3 | 7 | 14 | CA | VU |
| Felidae | Leopardus wiedii | Margay | Margay | 3 | 2 | 3 | 8 | DI | NT |
| Dasypodidae | Dasypus novemcinctus | Nine-Banded Armadillo | Ninllo | 6 | 5 | 8 | 19 | - | LC |
| Felidae | Leopardus pardalis | Ocelot | Ocelot | 4 | 5 | 4 | 13 | - | LC |
| Dinomyidae | Dinomys branickii | Pacarana | Pacana | 0 | 1 | 0 | 1 | V | LC |
| Atelidae | Lagothrix lagothricha | Peruvian Woolly Monkey | Perkey | 0 | 1 | 0 | 1 | EP | VU |
| Felidae | Puma concolor | Puma | Pumuma | 2 | 2 | 2 | 6 | CA | LC |
| Cervidae | Mazama americana | Red-Brocket Deer | Redeer | 7 | 5 | 7 | 19 | DI | DD |
| Canidae | Atelocynus microtis | Short-Eared Dog | Shodog | 1 | 0 | 0 | 1 | V | NT |
| Procyonidae | Nasua nasua | South American Coati | Souati | 0 | 3 | 2 | 5 | - | LC |
| Myrmecophagidae | Tamandua tetradactyla | Southern Tamandua | Soudua | 1 | 1 | 0 | 2 | - | LC |
| Sciuridae | Hadrosciurus spadiceus | Southern Amazon Red Squirrel | Sourel | 0 | 0 | 2 | 2 | - | LC |
| Cebidae | Saimiri boliviensis | Squirrel monkey | Squkey | 2 | 0 | 0 | 2 | - | LC |
| Mustelidae | Eira barbara | Tayra | Tayyra | 2 | 1 | 5 | 8 | - | LC |
| Didelphidae | Chironectes minimus | Water Opposum | Watsum | 0 | 0 | 1 | 1 | - | LC |
| Didelphidae | Caluromys lanatus | Western Wolly Opossum | Wessum | 1 | 0 | 0 | 1 | - | LC |
| Tayassuidae | Tayassu pecari | White-Lipped Peccary | Whiary | 1 | 0 | 1 | 2 | CA | VU |
| Total | 73 | 45 | 75 | 193 |
At Aguanos, the most abundant species was Dicotyles tajacu, with eight individuals, followed by C. paca and M. americana, with seven individuals each. Six singleton species were observed, and GaIictis vittata, Potos flavus, Atelocynus microtis, Saimiri boliviensis, and Caluromys lanatus were recorded exclusively in this area (Figure 2 and Table 1). At MLC, the most abundant species were C. paca and D. novemcinctus, with eight individuals each, followed by M. americana and Tapirus terrestris, with seven individuals each. Nine singletons with a single record were observed, and Microsciurus flaviventer, Sciurus ignitus, Callicebus urubambensis, Metachirus nudicaudatus, Procyon cancrivorus, Philander opossum, Sciurus spadiceus, and Chironectes minimus were recorded exclusively in this area (Figure 2 and Table 1). Last, at Piñi Piñi, the most abundant species was C. paca, with six individuals; eight singleton species were observed, and Sapajus apella, Dinomys branickii, and Lagothrix flavicaudae were observed only in this area (Figure 2 and Table 1).
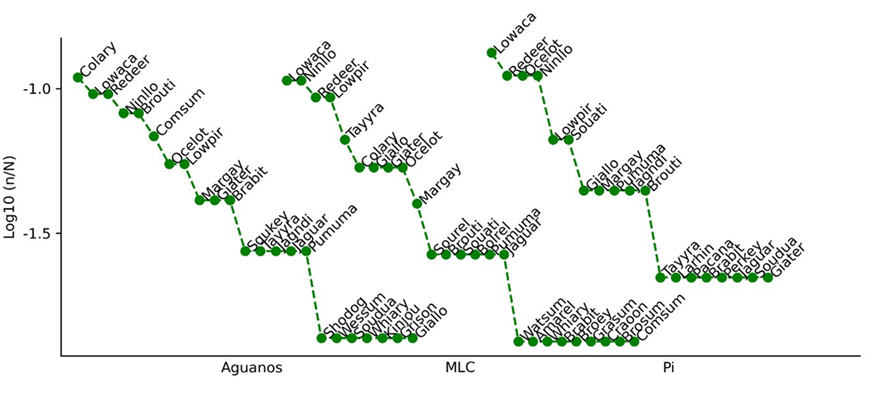
Figure 2 Rank-abundance curves of species recorded by forest type. Graph codes are specified in Table 1.
According to the correspondence analysis (Figure 3), some mammal species prefer a certain area. This preference is more noticeable in Didelphis marsupialis, D. tajacu, and Sylvilagus brasiliensis, which tend to prefer more open, disturbed, and unprotected areas (such as Aguanos); and Nasua nasua, which showed a trend toward protected and conserved areas within the Manu National Park (Piñi Piñi). These preference variations translate into statistically significant differences in the composition of mammal species between the three protection levels in the similarity analysis (R = 0.159; P < 0.05). Additionally, the above is supported by the non-metric multidimensional analysis (NMDS; Figure 3), showing that, although there is a high similarity between points closer to the centroid of each conservation level, there are also points that allow differentiating them.
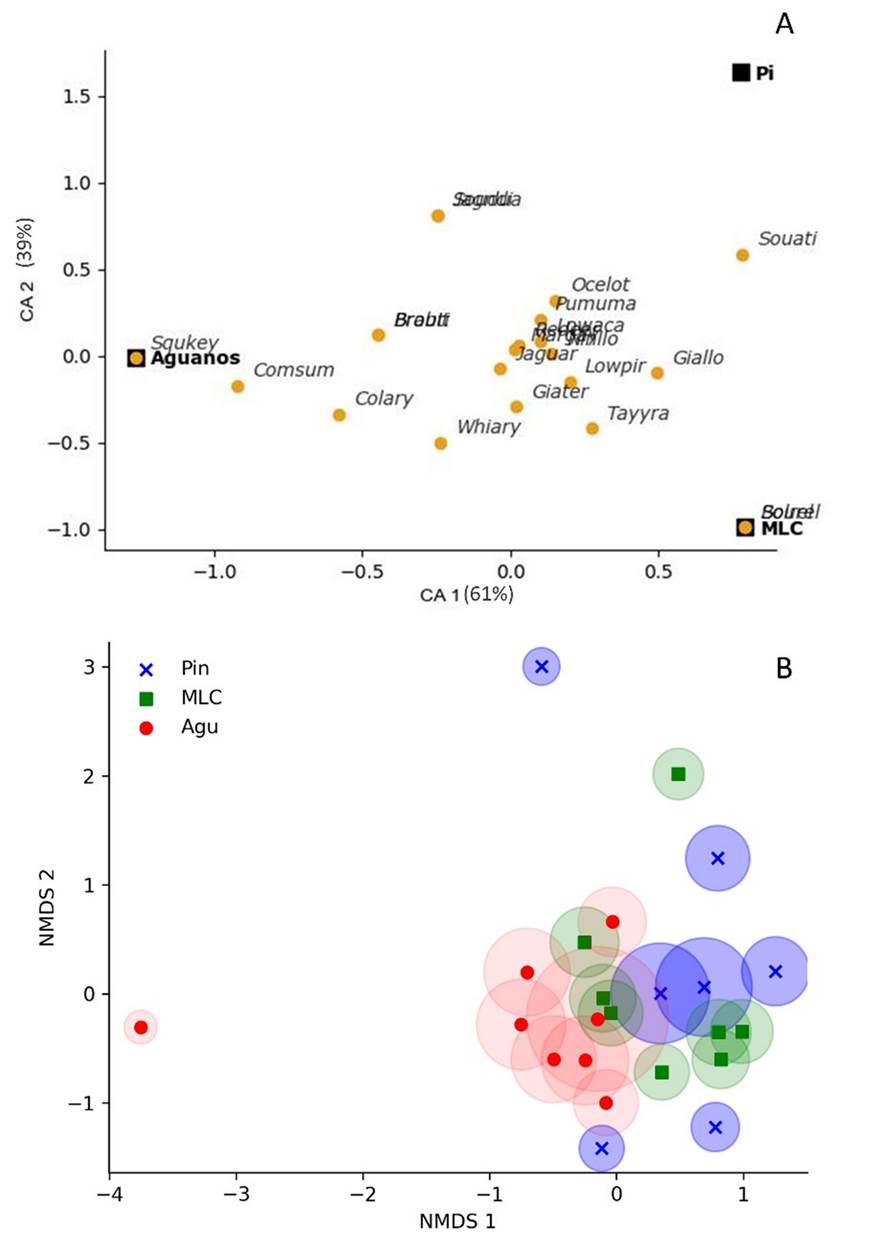
Figure 3 a) Correspondence analysis showing the three collection zones and associated species. b) Non-metric multidimensional scaling of the three forest types, showing camera traps.
The analysis of Hill’s alpha diversity numbers (Table 2) revealed that the most diverse protection level is MLC, followed by Aguanos and Piñi Piñi. As for evenness (E(1.0)), the most even forest was Aguanos, followed by MLC and Piñi Piñi. The shift of order in the evenness index between MLC and Aguanos occurs because the former recorded more singleton species (9) than Aguanos. Since different numbers of total individuals were recorded in each zone (Aguanos, 73; MLC, 75; and Piñi Piñi, 45), the effort was equalized using the rarefaction index, with MLC attaining the highest index, followed by Aguanos and Piñi Piñi, with very similar index values (Table 2).
Table 2 Analysis of Hill's alpha diversity, rarefaction, and evenness. N(0). zero Hill’s number; N(1). First Hill’s number; N(2). Second Hill’s number; E(1,0). Hill’s eveness.
| N (0) | N (1) | N (2) | E (1,0) | rarefy | |
|---|---|---|---|---|---|
| Aguanos | 23.000 | 18.216 | 15.446 | 0.792 | 19.388 |
| MLC | 25.000 | 19.159 | 15.756 | 0.766 | 20.298 |
| Piñi Piñi | 19.000 | 15.345 | 12.898 | 0.808 | 19.000 |
In the Bray-Curtis beta diversity partitioning (Table 3), the overall variation is mostly due to balanced variation (63.38 %), indicating that the species composition changes drastically from one protection level to another. When analyzed separately, this prevalence of beta diversity due to balanced variation (B-bal) is maintained when comparing MLC with Aguanos (76.14 %) and Aguanos with Piñi Piñi (57.41 %), but changes to a variation by gradients when comparing MLC with Piñi Piñi (59.35 %). Although the variation is mostly balanced, composition changes are also due to gradient variation (B-gra).
Table 3 Bray-Curtis beta diversity partitioning analysis. B-bal. balanced partition of Bray-Curtis index; B-gra. gradient partition of Bray-Curtis index; B-total. Bray-Curtis index.
| L1 | L2 | B-bal | %B-bal | B-gra | %B-gra | B-total |
|---|---|---|---|---|---|---|
| MLC | Aguanos | 0.3263 | 76.1404 | 0.1023 | 23.8596 | 0.4286 |
| MLC | Piñi piñi | 0.2000 | 40.6452 | 0.2921 | 59.3548 | 0.4921 |
| Aguanos | Piñi piñi | 0.2333 | 57.4073 | 0.1731 | 42.5926 | 0.4065 |
| MLC-Agu-Piñi | 0.3314 | 63.3859 | 0.1914 | 36.6141 | 0.5228 | |
Discussion
The protection level of an area determines the presence of human settlements, the activities allowed, and the intensity of resource extraction (Kuamara et al. 2004; Blom et al. 2005; Trisurat et al. 2014; Rabanal et al. 2010). All these factors influence mammalian communities in different regions and at different scales (Kuamara et al. 2004; Blom et al. 2005; Trisurat et al. 2014; Rabanal et al. 2010). The present study is one of the few works relating the composition of mammal communities to the protection level of areas within a Biosphere Reserve.
In general, the mammal community varies across the three protection levels as some species exhibit preferences for a given level; as a result, beta diversity is primarily due to balanced variation. This variation may be due to various factors, such as geographic barriers that delimit the distribution of species (Gascon et al. 2000; Maciel-Mata et al. 2015; Oswald et al. 2016), climatic conditions that determine seasonality and its presence (e. g., Candido-Rocha et al. 2006), and anthropic activities such as hunting (Blom et al. 2005; Aquino et al. 2007; Fa et al. 2013).
Tangible geographic barriers, such as Cerro Teparo Punta and Alto Madre de Dios River, restrain the dispersal capacity of some populations, isolating them. As a result, these may produce potential new lineages that respond differently and independently to the local environment (Oswald et al. 2016). Mountain ranges are central to species composition and endemism patterns in Neotropical forests (Oswald et al. 2016). In this way, Cerro Teparo Punta is a barrier for some mammal populations that cannot move across the peak of this relief form. As regards the Alto Madre de Dios River, more studies should be carried out to determine whether it is a barrier restraining the distribution of mammals because not all rivers limit the movement of species, and their permeability depends on the dispersal capacity of each species (Grinnell 1914; Gascon et al. 2000).
Another factor that may explain the variation in the three sampling areas is intangible barriers such as anthropogenic activities, such as hunting, whose preference for some species and strategies differ between regions (Kuamara et al. 2004; Aquino et al. 2007; Endo et al. 2010; Fa et al. 2013). This variation in hunting preference decreases the abundance of the most hunted species and favors the abundance of the least hunted ones in areas surrounding populated centers (Endo et al. 2010). In the present work, Didelphis marsupialis, Sylvilagus brasiliensis, and Dicotyles tajacu tend to be present in disturbed areas, maybe cause they are not usually hunted by local or indigenous populations in the surrounding areas (Endo et al. 2010; Fa et al. 2013; Farfan-Flores et al. 2023). The species most hunted and consumed by Matsigenka indigenous communities in the study area are Ateles chamek, Lagothrix lagotricha, and Tayassu pecari, which may explain the low frequency of these species in the present study (Endo et al. 2010; Farfan-Flores et al. 2023).
All species recorded in the study were previously reported for Peru by Solari et al. (2006) and Pacheco et al. (2021), so they are common for the Manu Biosphere Reserve. A large part of the recorded species are considered under some threat category. According to Servicio Nacional Forestal y de Fauna Silvestre (SERFOR 2018), 12 (34 %) species are listed under a threat category: four as Vulnerable, one as Endangered, four as Nearly Threatened, and three with insufficient data. According to International Union for Conservation of Nature and Natural Resources (IUCN 2022), 31 species (88 %) are considered under a threat category: 21 species as Least Concern (LC), five as Vulnerable (VU), one as Endangered (EN), three as Nearly Threatened (NT), and one as Data Deficient (DD; Table 1).
Cuniculus paca, Mazama americana, and Dasypus novemcinctus were the most recorded species in the present work. The three species are widely distributed in Peru and have been recorded in the Pacific rainforest, equatorial dry tropical forest, yungas, and low tropical forest (Pacheco et al. 2021). These species can be considered very abundant in the Peruvian Amazon (Aquino et al. 2012). Aquino et al. (2007) mention them among the species facing heavy hunting pressure, so monitoring strategies are needed to ensure their conservation in the RBM. In addition to these three species, many mammals under a threat category are consumed as a protein source by local and native populations, affecting their diversity and total biomass (Endo et al. 2010; Fa et al. 2013). Therefore, the effect of hunting and the hunting methods should be considered within and around the current and proposed priority conservation areas.
The present work recorded five feline species, accounting for 62.5 % of the feline species reported for Peru (Pacheco et al. 2021). The presence of carnivores such as felines is essential for defining conservation criteria in each area because they play a central role in the ecosystem by limiting the number of herbivores; indeed, they are generally used in conservation strategies (Miller et al. 2001; Figel et al. 2018; Thornton et al. 2016). The most protected areas generally have a greater relative abundance of felines than the least conserved (Pardo Vargas et al. 2016). This is consistent with our work, where 26.6 % of felines were recorded at Piñi Piñi and only 14.6 % at MLC. Puma concolor and Panthera onca inhabit the entire study area, mainly the RBM, so they should be considered in local conservation strategies as umbrella species, replicating previous models (Solari et al. 2006; Figel et al. 2018; Thornton et al. 2016).
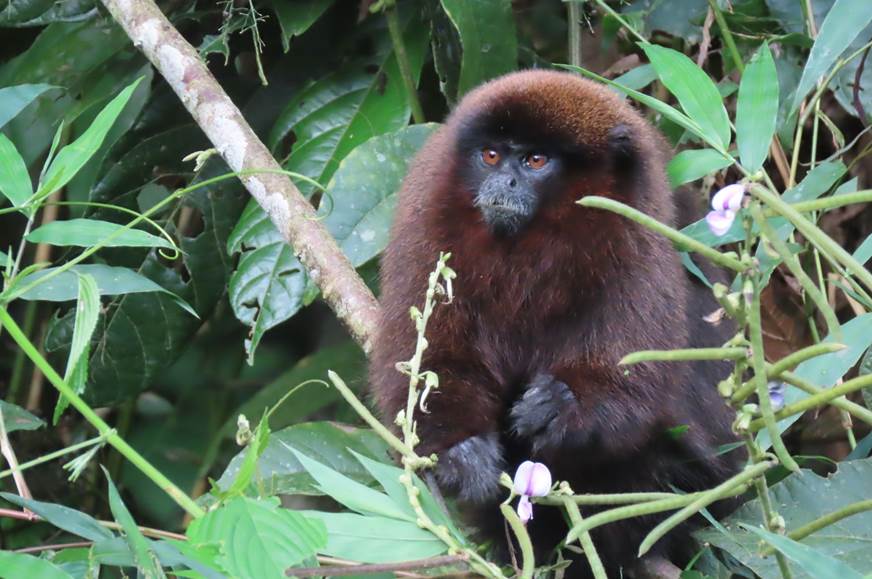
From the records, a detailed review of the Philander species recorded in the Manu Learning Centre biological station is needed because this genus entails a controversial taxonomy, with eight described species, of which five are reported for Peru (Voss et al. 2018; Pacheco et al. 2021). Another recorded species for which the distribution should be studied to determine its threat category is Callicebus urubambensis (Figure 4), a species endemic to Peru treated as a subspecies of Callicebus brunneus before its description as a separate species (Vermeer and Tello-Alvarado 2015).

