


 texto en
  Inglés (pdf)
 Artículo en XML
 Referencias del artículo
 Enviar artículo por email
 Citado por SciELO
  Similares en
SciELO
Similares en
SciELO 
 Permalink
Introduction
Hydrological modeling is prime for water resources planning and management in the context of climate variability and change. Most of the currently available models will provide reliable results where hydrological data are available for calibration of model parameters (Boughton & Chiew, 2007). However, the distinct hydrology of dryland rivers (i.e., drought- and flood-dominated regimes with extreme variability and low predictability (Bunn, Thoms, Hamilton, & Capon, 2006) challenges hydrological modeling on both a discrete and a continuous basis (Pilgrim, Chapman, & Doran, 1988).
Hydrological modeling in drylands has two major sources of error. On the one hand, model parameters at calibration represent standard catchment conditions in response to seasonal climatic variations that are assumed as stable on both validation and prediction (Coron et al., 2012; Merz, Parajka, & Blöschl, 2011). Climate-driven flow variability may lead to less optimal results because parameters calibrated on a given period do not necessarily represent the full range of flows that may be expected to occur in the long term. On the other hand, the over-parameterization of many models (which constitutes one of the root causes of the model output uncertainty; Perrin, Michel, & Andréassian, 2001) may be particularly challenging in drylands. Dryland catchments home some of the most poorly gauged rivers on Earth (Callow & Boggs, 2013), and therefore lack a detailed hydrological understanding on which to base the calibration of many model parameters - especially those related to subsurface flow processes (Beven, 2002).
This paper implements a simple yet robust conceptual hydrological model, GR2M (Makhlouf & Michel, 1994), to determine whether a) conceptual models based on few parameters perform satisfactorily on dryland catchments, and b) a simple transfer of model parameters from calibration to validation works in the context of climate-driven flow variability. The study compares two different model versions (Lavabre, Cambon, Folton, Makhlouf, & Michel, 1997; Mouelhi, Michel, Perrin, & Andréassian, 2006) to determine the parameters that are most sensitive to dryland catchment hydrology and implements generalized split-sample tests (Coron et al., 2012) allowing considering all possible climatic configurations between calibration and validation. The analysis centers on the Sauce Grande catchment, the major source of freshwater within south-western Buenos Aires, Argentina. This dry subhumid catchment has been regulated 40 years ago for drinking water supply, and present reservoir performance revisits particular attention. In addition to providing a new example validating the robustness of GR2M to simulate monthly runoff, this paper improves the potential for transferability of model parameters over time and yields new hydrological data that constitutes an important platform to underpin further water resources planning and management in this highly regulated, dryland catchment.
Materials and methods
Study area
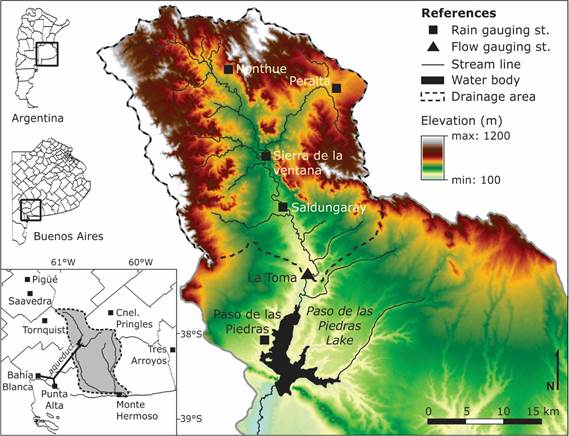
The study centers on the Sauce Grande River (Argentina), an agricultural stream regulated since 1978 by the Paso de las Piedras dam for drinking water supply to the cities of Bahía Blanca and Punta Alta (Figure 1). The climate type for the majority of the river catchment is dry subhumid. Mean annual rainfall is 640 mm, mean annual temperature is 14.3 °C, and mean potential evapotranspiration is 1 050 mm (1981-2010); based on the data series described by Casado, 2013). The river flow regime is perennial flashy (rainfed) and event driven (Casado, 2013). According to the hydrological series used in this study (1910-1947), the mean annual flow is 3.44 m3 s-1 and exhibits high variation (CV= 1.3). Flow variability is the norm, as it occurs in most dryland rivers (Tooth, 2000; Tooth, 2013), and responds to rainfall anomalies linked primarily to El Niño-Southern Oscillation (Scian, 2000) and other large-scale atmospheric phenomena (Scian, Labraga, Reimers, & Frumento, 2006).
Long-standing episodes of drier- and wetter-than-normal conditions are common (Casado & Campo, 2019), and impact very seriously on local water resources. At present, the recurrence of drought and increasing water demand challenge the relationship between water use and management, and the current reservoir performance revisits particular attention. However, one of the major drawbacks to re-evaluating the relationship between capacity, yield, and performance of Paso de las Piedras is that the drainage basin to the reservoir is poorly gauged, and long-term records on which to base realistic projections are therefore lacking.
Predicting long-term runoff series in this regulated, poorly gauged catchment is both important and challenging. Previous research efforts on hydrological modeling within the upper Sauce Grande catchment provided suitable results (Brandizi, Sequeira, & Fernández, 2013). However, the data series used on model calibration was too short in the context of the regional climate variability, and further research efforts should focus on producing reliable runoff predictions under non-stationary climate conditions supporting near future water planning and management.
Data
Hydrological records in the study catchment are either short-termed, temporally discontinuous, or both. The only reliable hydrological series available in the long term are monthly runoff volumes recorded at La Toma (Figure 1) on the period 1910-1947. Despite these runoff records probably mislead current hydrologic conditions, the series encompasses some of the most severe flood and drought events in history, e.g., the drought of 1935-1939 (Schefer, 2004); the floods of 1919 and 1944 (Gil, 2010). It, therefore, provides a good dataset on which to calibrate the models. In addition, these data series were used to size the Paso de las Piedras dam prior to construction (Schefer, 2004), and have therefore a great value-added.
Concurrent rainfall records were obtained from different rail stations and farms through the catchment. Mean areal rainfall was calculated using the Thiessen method. Months exhibiting missing records or unreliable values were completed with gridded rainfall data extracted from the global dataset of the University of Delaware (Willmott & Matsuura, 2001). The potential evapotranspiration (PE) was calculated based on mean monthly gridded temperatures (Willmott & Matsuura, 2001) using the method of Thornthwaite (1948). This method was selected because of its simplicity for PE estimations (i.e., it only requires to mean monthly temperature as input). In addition, it still remains among the top ten PE formulae for rainfall-runoff modeling as demonstrated by Oudin et al. (2005). Monthly series of runoff, mean areal rainfall and potential evapotranspiration were pooled together to provide a continuous dataset over 30 years of record (1916-1945).
Methods
Rainfall-Runoff models
Among the wide range of conceptual hydrological models available in the literature, this study implements the GR2M model (Génie Rural à 2 paramètres Mensuel) developed by Makhlouf and Michel (1994). GR2M was selected for two main reasons. First, GR2M estimates runoff from rainfall using two parameters only, thus avoiding poor estimations of physical parameters frequently unknown in poorly gauged catchments. Second, GR2M has been implemented successfully for a variety of applications and under a range of hydroclimatic conditions, including drylands (Djellouli, Bouanani, & Baba-Hamed, 2015; Folton & Lavabre, 2007; Mebarki, 2010; Okkan & Fistikoglu, 2014). Two versions of GR2M were retained and compared for the purpose of this study. Lavabre et al. (1997) modified the original GR2M to improve its efficiency for baseflow simulation. Later, Mouelhi et al. (2006) proposed a more general version of the original GR2M to increase its applicability under varying climate conditions.
The two model versions, namely GR2M-97 and GR2M-06, respectively, build on the water balance equation. Both use monthly rainfall (P) and evapotranspiration (E) data as input and estimate runoff based on recharge-discharge relationships between two reservoirs (Figure 2). First, the effective rainfall (Pe) is determined from a soil moisture reservoir (H). The maximum capacity of H is given by the parameter X1 (X1 > 0), and its actual content at the end of a given month is given by the balance between rainfall inputs (H1) and evapotranspiration losses (H2) for that particular month. Pe is then routed by a second reservoir with storage S and a production capacity X4. Actual runoff from the study catchment is given by a water balance term that regulates runoff production (X5). Depending on the model structure, it controls total runoff outputs (GR2M-97) or regulates the content of S (GR2M-06). Values of X5 greater than 1 indicate additional water supplies than those considered by the model, while values lower than 1 indicate additional water losses. The closer X5 to 1, the higher the ability of the model to simulate the water balance of the catchment.
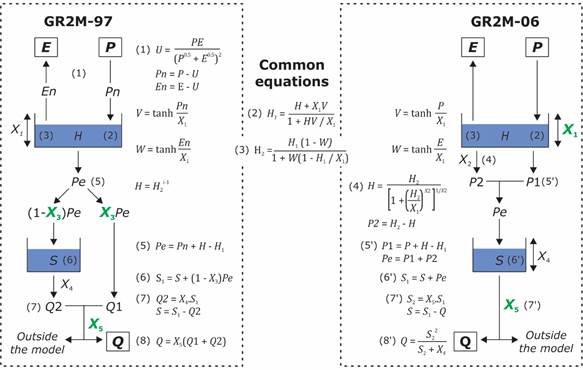
Figure 2 Scheme of the GR2M-97 and GR2M-06 models showing free parameters requiring calibration (in green). Equations are given along. For a more detailed description of the models, please refer to Lavabre et al. (1997), Makhlouf and Michel (1994), and Mouelhi et al. (2006).
The main differences between the two GR2M versions are given as follows.
The way initial abstractions are computed. GR2M-97 begins with a partial cancellation between P and E input data (U), whereas abstractions in GR2M-06 are considered in a percolation equation with parameter X2 that takes a fixed value (X2= 3).
The free parameters governing the model structure. The capacity of the soil moisture reservoir X1 is fixed to 250 mm in GR2M-97, whereas X1 is no longer a fixed parameter in GR2M-06 and requires calibration. On the other hand, GR2M-97 builds on the parameter X3 to determine the fraction of Pe that is readily discharged to the stream (Q1), and its complementary part entering the routing reservoir to yield Q2 (0 ≤X3≤ 1). Conversely, there is no direct runoff by-passing the routing reservoir in GR2M-06. All the effective rainfall Pe is routed by S, and therefore Q1 = 0.
The role of parameters X4and X5 in the computation of runoff outputs. In GR2M-97, X4 controls the part of S that becomes Q2 (X4=1/3), and the water exchange term X5 is used to adjust total runoff outputs from the catchment. In GR2M-06, however, X4 is the storage capacity of S, and water losses (or gains) to (from) outside the catchment are proportional to the content of S. Total runoff is ultimately determined based on the content of S after computation of water exchanges and relative to the capacity of S (expressed as a fixed value of 60 mm).
Generalized split-sample tests
GR2M-97 and GR2M-06 were calibrated using generalized split-sampling tests (GSST). In opposition to standard split-sample tests (Klemeš, 1986), GSST consist of a series of calibration-validation tests considering all possible climatic configurations, including similar and contrasting conditions between calibration and validation (Coron et al., 2012). The GSST procedure involves a) defining calibration periods using a sliding window of a given time length; b) optimizing model parameters on each calibration period using a given objective function, and c) performing all possible validation tests on the remaining periods whether they ensure independence (i.e., calibration and validation periods do not overlap).
This study used a sliding window of 5-yr lengths. The window was moved by one hydrological cycle (1 year) from 1916 to 1945, thus providing 26 calibration periods with a 4-yr overlap. The year preceding each calibration period was used as a warm-up period in all calibrations. This ensured avoiding the effects of bad initial conditions on calibration.
On each calibration period, model parameters were optimized by maximizing the square root transformed Nash-Sutcliffe efficiency (sqrt E). This transformation provides a median way between the classical Nash-Sutcliffe efficiency (Nash & Sutcliffe, 1970), that emphasizes the quality of high-flow simulations, and its log-transformed version, which emphasizes the quality of low-flow simulations (Perrin et al., 2001; Perrin, Michel, & Andréassian, 2003). Accordingly, sqrt E is given by:
where O and P are observed and predicted runoff at time step I; Ō is the mean observed runoff over the calibration period, and n is the number of time steps.
This procedure provided one parameter set per calibration period (i.e., 26 parameter sets) for both GR2M-97 and GR2M-06 models. Model parameters obtained for each calibration period were then tested on all the remaining, non-overlapping periods. This ensured strict independence in validation.
Model efficiency criteria
Two additional criteria were selected to determine which of the models perform better for runoff simulation in drylands. These include the classical Nash-Sutcliffe efficiency E, and an index of agreement d proposed by Willmott (1981) and revisited later by Krause, Boyle, and Bäse (2005). The index of agreement d represents the ratio of the mean square error to the potential error. It ranges from 0 (no correlation) to 1 (perfect fit) and is expressed as follows:
E and d criteria are based on absolute square errors between observed and predicted runoff. Because differences in higher values are expected to have a greater influence than those in lower values, relative forms of E and d were also calculated based on Krause et al. (2005). Relative E takes the form:
The index of agreement d based on relative deviations is expressed as follows:
Calibration-validation parameter extrapolation
A common source of error in rainfall-runoff modeling is the extrapolation of model parameters from the calibration period to periods leading to less optimal runoff estimations (Coron et al., 2012; Merz et al., 2011). Coron et al. (2012) proposed a model robustness criteria (MRC) to evaluate performance losses caused by the parameter transfer from calibration (C) to validation (V):
where ε is the objective function used in calibration (i.e., the square root transformed Nash-Sutcliffe efficiency); C→V is the parameter transfer term (i.e., sqrt E estimates on period V using the parameters calibrated on period C), and V→V is the optimum term (i.e., the maximum value of sqrt E obtained on period V during calibration). MRC should be positive, and as close to zero as the parameters calibrated on period C give a similar model fit than that obtained on period V. The higher the MRC value, the less suitable the parameter set for the receiving period V (Coron et al., 2012).
Another measure of the model error caused by parameter transfer from calibration to validation is the volume error VE (Merz et al., 2011). VE is a measure of bias on total runoff volumes and is defined as:
Where Pi C →V is the runoff predicted on period V using the parameters optimized in period C and Oi V is the observed runoff on period V. Values of VE greater (or smaller) than zero indicate an overestimation (or an underestimation) of the total runoff volume; VE= 0 indicates no bias (Merz et al., 2011).
MRC and VE values were analyzed relative to variations in mean annual rainfall () and potential evapotranspiration () to determine whether climate variability influence the quality of parameter transfer from calibration to validation (Coron et al., 2012). Changes in climate conditions were expressed as the ratio between (or ) from period C to V.
Results
Hydroclimatic variability in the upper Sauce Grande catchment
Hydroclimatic variability within the study basin was analyzed first to help interpreting model results. Figure 3 shows variations in rainfall (P), potential evapotranspiration (PE), and runoff (Q) over the observation period (1916-1945). Annual rainfall exceeded ±1 standard deviation on 10 out of 30 years, and the range between maximum and minimum P was as large as 670 mm yr-1; this is more than one of the mean annual rainfall observed along the period of record. Absolute variations in PE were less pronounced than those on P (722 <PE< 788). However, deviations from the interannual mean were significant (PE exceeded ±1 standard deviation on 50 % of years) and linked to variations in mean annual temperature (13 < T°C < 15). As the regional hydrological system is exclusively rainfed, rainfall emerges as the key variable driving variations in surface runoff. Yet runoff variations were notably larger than those observed on P, with maxima as high as 3.8 times the mean (Qmax= 472 mm yr-1) and minima as low as 0.3 the mean (Qmin= 36 mm yr-1).
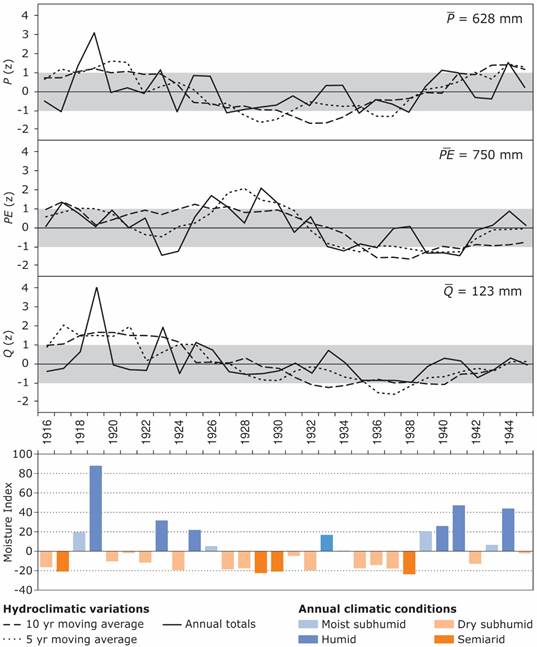
Figure 3 Hydroclimatic variations over the period 1916-1945 and annual climatic conditions based on the Moisture Index of Thornthwaite (1948). Hydroclimatic variables include rainfall (P), potential evapotranspiration (PE), and runoff (Q). Absolute values for all three variables were expressed in mm yr-1.
The Thornthwaite’s Moisture Index (MI) was calculated to evaluate how variations in the catchment water balance may influence annual climatic conditions (Figure 3). The mean annual MI for the upper Sauce Grande catchment is -6.8 (and therefore indicates a dry subhumid climate). Yet the relationship between water deficit and water surplus for a given year suggests that climate conditions may vary from humid climate B3 (i.e., the climate type of north-eastern Argentina and Uruguay, Feddema, 2005) to semiarid climate (i.e., the climate type of Argentinian Patagonia Feddema, 2005). Such variations are not skewed but describe an overall tendency to the dryer- and wetter-than-normal conditions every roughly 10 years. This trend is also noticeable from deviations of averaged P and PE series. The late 10’s and the first half of the ’20s were wetter than normal though some years were also warmer. Thus, predominantly humid conditions were interspersed by years of a drier climate. The second half of the ’20s and a good part of the ’30s were markedly dryers and warmer than normal, and thus annual climate conditions shifted from dry to semiarid. Humid conditions prevailed again by the end of the ’30s and during the ’40s, in connection with an increasing trend in P and a marked decrease in PE.
Rainfall-runoff modeling
Model calibration
GR2M-97 and GR2M-06 parameters obtained from calibration are quite reasonable (Table 1). On the one hand, the capacity of the soil moisture reservoir H averages 136 mm (parameter X1). Although this value is larger than the potential soil retention S obtained from the application of the NRCS method for average moisture conditions (SII= 76 mm; Casado, 2013), it falls within the range of S for dry (SI= 170 mm) and wet (SIII= 35 mm) antecedent conditions. Accordingly, a fixed value of X1= 250 mm in GR2M-97 provided less suitable results than those obtained using a smaller value. The best fit was obtained for X1= 75 mm, i.e., a value close to the NRCS S for average moisture conditions. On the other hand, GR2M-97 assumes that 58 % of the effective rainfall (Pe) becomes direct runoff (on average). This value is very close to the runoff coefficient (RC) of the upper Sauce Grande for average moisture conditions (RCII= 0.60) and falls within the range of RC obtained for dry (RCI= 0.42) and wet (RCIII= 0.74) antecedent conditions. The water exchange term X5 is common to both models and therefore exhibits similar behavior, i.e., it remains below unity in both cases. This indicates that there are no additional water supplies than those considered by the models but additional water losses.
Table 1 Distribution of GR2M-97 and GR2M-06 parameters optimized on 26 calibration periods of 5-yr length (1916-1945).
| Model | Parameter | Unit | Min | 1st Q | Median | 3rd Q | Max | Mean | SD |
|---|---|---|---|---|---|---|---|---|---|
| GR2M-97 | X3 | - | 0.40 | 0.52 | 0.56 | 0.63 | 0.77 | 0.58 | 0.09 |
| X5 | - | 0.44 | 0.47 | 0.67 | 0.77 | 0.84 | 0.64 | 0.14 | |
| GR2M-06 | X1 | mm | 87.0 | 106.1 | 112.8 | 135.8 | 200.2 | 126.5 | 32.5 |
| X5 | - | 0.62 | 0.69 | 0.84 | 0.86 | 0.90 | 0.79 | 0.09 |
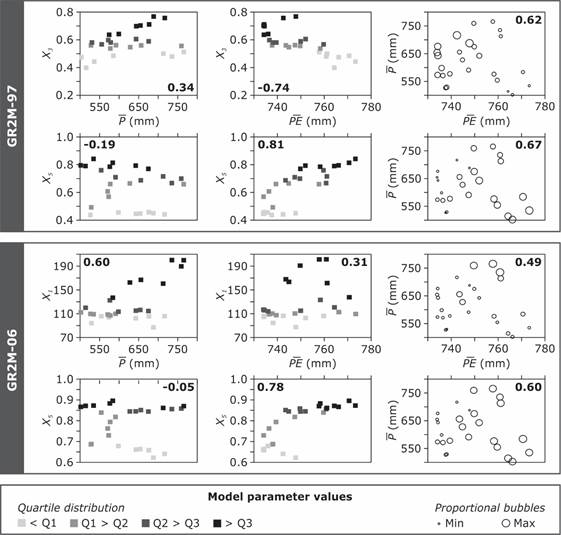
Despite the overall reliability of model parameters, distributions along the 26 calibration periods show moderate to high dispersion (Table 1). This suggests that the model structure is very sensitive to variations in catchment conditions from one calibration period to another. Figure 4 shows the relationship between model parameters by calibration period and correspondent values of mean annual rainfall () and potential evapotranspiration (). Variations in the capacity of H (parameter X1 in GR2M-06) respond to variations in more than to variations in and, in opposition to what was expected, the relationship between H and is positive. This indicates that rainfall amounts for some months may be too large relative to the observed runoff, and thus the capacity of H is increased to reduce the Pe entering the routing reservoir (see GR2M-06 model descriptions in the methods section). Conversely, the relationship between parameter X3 in GR2M-97 and climate variables is quite reasonable: The part of Pe that becomes direct runoff tends to increase with increasing and to decrease with increasing . Interestingly, the water exchange term (parameter X5) responds strongly to variations in in both models. In addition, correlations are positive (i.e., the higher the , the closer the value of X5 to unity). This indicates that potential evapotranspiration was either underestimated for several months along the simulation period or that this dryland catchment faces significant water losses owing to other drivers than those considered by the models.
Model performance
GR2M-97 and GR2M-06 performance during calibration was first inspected to determine the model ability to simulate runoff from rainfall comparatively. Average flow conditions by calibration period were classed into four categories ranging from extreme low to extreme high to help interpreting model results. Flow categories were defined by the 10th, 50th, and 90th percentiles of annual runoff volumes recorded over the observation period.
Both GR2M-97 and GR2M-06 models perform very suitably for runoff simulation (Figure 5). On average, they explain 90 and 88 % of the total runoff variance, respectively, and describe 97 % of agreement. As the models were calibrated based on square-root transformed runoff, values of E and d on periods of extremely high flow tended to be sensibly lower than average because the oversensitivity of E to high flow conditions was reduced. Indeed, higher model performance was found for periods exhibiting intermediate flow conditions. Because E and d criteria are of the mean square error type (i.e., they compensate for the higher absolute differences between predicted and observed runoff), the lower model performance was found on periods where prevailing flow conditions were extremely low (e.g., P12 & P13). Interestingly, GR2M-06 performed more poorly than GR2M-97 for both extremely high and extremely low flow conditions. Minimum values of E and d were 0.75 and 0.94, respectively, and were attained on calibration period P13.
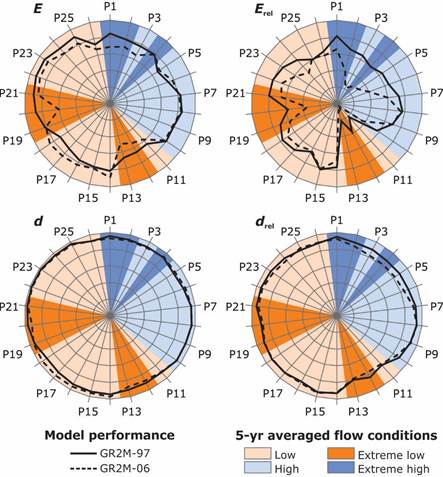
Figure 5 Performance of the GR2M-97 and GR2M-06 models by calibration period (P1 to P26). Radial charts increase from 0.5 (center) to 1 (outbound circle).
Relative forms of E and d were calculated to bypass the sensitivity of these criteria to extreme values (Figure 5). Relative model performance is naturally lower in both cases because absolute runoff differences for months of low flow are now significant. Both models reached the lower performance on periods of extremely low flow, indicating systematic over (or under) predictions of little runoff volumes. There were some periods, however, where relative model performance was more or less suitable irrespective of prevailing flow conditions. This may be explained by the relationship between flow variability and constancy along the calibration periods.
Flow variability and constancy were determined based on the coefficient of variation (CV) and the coefficient of dispersion (CD) of monthly flows on each calibration period. CV is affected by extreme flow values, and thus indicates the relative magnitude of flow variations, whereas CD is affected by the interquartile distribution of monthly flows, and thus indicates the frequency of such variations. On periods describing high flow variability (CV > 50th percentile of all CV) and extreme high flow dispersion (CD > 90th percentile of all CD), relative model performance dropped by up to 19 % (GR2M-97) and 12 % (GR2M-06) relative to absolute performance (e.g., P25 on Figure 5). This suggests that short-termed flow variability may be an important factor affecting the model efficiency to simulate the full range of flows. Conversely, on periods describing high flow variability but extreme low dispersion (i.e., flows were predominantly constant), relative model efficiency was more suitable. Indeed, model parameters are adjusted to prevailing flow conditions more than to scattered flow variations, irrespective of their magnitude. An example of this are calibration periods P17 & P18 (Figure 5), where roughly constant low flow conditions were interrupted by two peaks of high relative magnitude. An interesting aspect to highlight is that the relative efficiency of GR2M-97 on such periods increased concerning absolute terms, indicating higher model sensitivity to low flows than GR2M-06.
From the above, it results that GR2M-97 performs better than GR2M-06 to predict runoff in this dryland catchment. First, absolute model efficiency on periods exhibiting extreme high and extreme low flows is higher than for GR2M-06, suggesting higher model sensitivity to contrasting flow conditions. Second, the relative efficiency of GR2M-97 is higher irrespective of prevailing flow conditions, indicating greater structure adaptability to the range of flows that may be expected to occur in the long term. Consequently, the GR2M-06 model is excluded from the analysis and the following sections focus on the GR2M-97 model instead.
Potential for transferability of model parameters
The potential for transferability of GR2M-97 parameters was determined from series of calibration-validation tests based on the GSST procedure (Figure 6). Average efficiency losses were 22 % and mean bias on total volumes was 6 %. The magnitude of MRC values and the direction of VE (i.e., positive, or negative) were linked to prevailing flow conditions on validation periods. MRC values were higher on validation periods receiving parameters calibrated on more humid periods, with maximum attained on period P20 (up to 105 % efficiency loss). In addition, concurrent variations in VE indicate that efficiency losses on low-flow periods respond to an overestimation of total runoff volumes. Efficiency losses on high-flow periods were lower, yet important and linked to underestimation of runoff volumes.
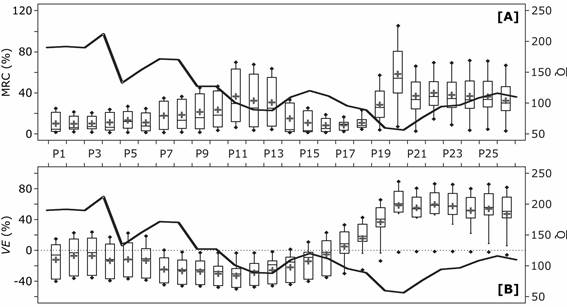
Figure 6 GR2M-97 performance variations from calibration to validation based on A) a model robustness criteria (MRC), and B) the volume error [VE]. The black thick line illustrates the mean annual runoff by the validation period.
MRC and VE values were inspected against variations in and to determine whether there is a link between model performance and varying climate conditions from calibration to validation (Figure 7). MRC values showed no clear trends relative to variations in climate. Indeed, previous results suggested that the efficiency of GR2M-97 for runoff predictions depended on prevailing flow conditions and, by extension, on the relationship between magnitude, variability, and constancy of monthly flows. Despite this relationship is driven by variations in P and PE, climate variations expressed as 5-yr mean annual values are too general to capture such a relationship. There is, however, a clustering tendency of high MRC values on quadrants I and IV. This indicates that performance losses may occur for parameter transfer from periods dryer and warmer (I) or wetter and cooler (IV) than the receiving period for validation.
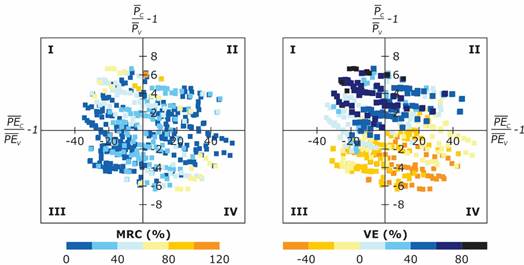
Figure 7 Distribution of MRC and VE values against relative variations in mean annual rainfall () and potential evapotranspiration () from calibration to validation.
Clearer trends emerged from the relationship between climate and bias on total volumes (Figure 7). Variations in clearly separate overestimation (VE> 0) from underestimation (VE< 0) of runoff volumes. Overestimation in runoff predictions tends to occur on validation periods that are cooler than the calibration periods providing model parameters and the other way around, underestimations tend to occur on validation periods that are warmer and exhibit logically higher . On the other hand, variations on influence the magnitude of the volume error. Thus, the higher bias tends to cluster on validation periods that are wetter than those providing model parameters (quadrant I), whereas the lower bias is found for receiving periods that are dryer (quadrant IV).
Modeling runoff from rainfall in the context of climate-driven flow variability
The above results suggest that a) the performance of GR2M is very sensitive to variations on prevailing flow conditions driven by variations in climate, and that b) parameter transfer from calibration to validation may result in notably less optimal model results. This section aims therefore at finding the best parameter combination to simulate runoff from rainfall under non-stationary climate conditions on a continuous monthly basis. Because the GSST procedure considers all possible climate combinations that may prevail in the long term, it results in that model parameters obtained from these combinations may be pooled together to adjust the model structure to climate variability.
Figure 8 shows the results obtained from regression tree learning, where a) model parameters by calibration period are the dependent variable; and b) concurrent mean annual runoff (), rainfall () and potential evapotranspiration () are the explanatory variables. Regressions included series of in addition to input variables and because previous results indicated that the model structure was very sensitive to prevailing flow conditions. The best fit between observed and predicted parameter values were obtained from 2-level regression rules for both X3 and X5. Tree regressions are quite consistent with previous results; the direct runoff term X3 depends on the balance between water gains and losses (i.e., and ), whereas the water exchange term, depends on water losses relative to water availability (i.e., and ).
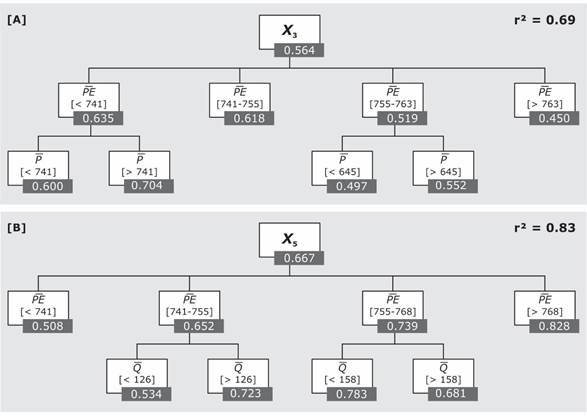
Figure 8 Tree regressions of GR2M-97 model parameters based on mean annual runoff (), rainfall () and potential evapotranspiration () by calibration period. A) Parameter X3; B) Parameter X5. In bold, coefficients of determination between observed and predicted parameter values.
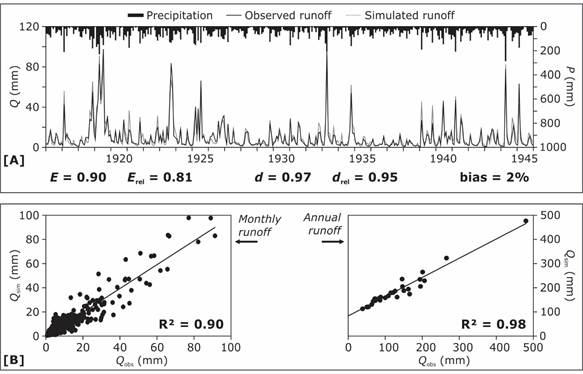
GR2M-97 was run on a continuous monthly basis from 1916 to 1945 using these rules. Antecedent hydroclimatic conditions were averaged using different periods to determine the combination producing the best model fit. Because model parameters compensate for catchment conditions on windows of 5-yr length, the best results were achieved for 5-yr averaged antecedent P, PE, and Q. Model results are illustrated in Figure 9 along with absolute and relative metrics of model performance. Although there is a tendency to underestimation of extreme high flows (which results in an underestimation of total runoff volumes by 4 %), the model provides a very good fit for the full range of hydrological conditions that occur throughout the observation period. Comparison of model performance during calibration and prediction for equivalent periods shows that, on average, E= + 0.1 %, d= + 0.1 %, Erel = -12.0 %, and drel = -2.3 %. Even though these values are not very significant (or even denote performance loss from calibration to prediction), it should be noted that these results are notably higher than those obtained by a simple transfer of parameters between calibration and validation, where E= -21.0 %, d= -5.0 %, Erel = -38.4 % and drel = -6.3 % on average. Furthermore, mean variations of the sqrt E (objective function) from calibration to prediction are only -0.7 %. It can be therefore concluded that allowing model parameters to evolve along with varying climate conditions improves long-term runoff predictions in this dryland catchment.
Discussion
Model simplicity and robustness
The movement towards developing conceptual rainfall-runoff models working with few parameters is not new (Jakeman & Hornberger, 1993; Perrin et al., 2001), and many studies have demonstrated already that simple, conceptual models do not necessarily provide less optimal results (e.g., Boughton, 2004; Ibrahim & Cordery, 1995; Mimikou & Rao, 1983; Mishra & Singh, 2004). GR2M belongs to this model community and results from intensive research efforts towards developing a conceptual, simple monthly rainfall-runoff model “that guarantee its robustness and make the research for parameter explanation easier” (Makhlouf & Michel, 1994: 1). The greatest advantages of GR2M are the simplicity yet robustness, adaptability, and accuracy of the model structure, and its ease of use, which increases its potential for applicability under a range of time and spatial scales (Paturel, Servat, & Vassiliadis, 1995). In addition, the two GR2M versions tested here were specifically developed to increase its efficiency for low flow simulation (Lavabre et al., 1997) as well as its applicability under varying climate conditions (Mouelhi et al., 2006), both aspects being particularly relevant in drylands.
Results from this investigation indicate that both model versions, GR2M-97 and GR2M-06, perform suitably to predict monthly runoff in this dryland catchment. Coefficients of efficiency during calibration averaged 90 %, and the percent agreement between observed and predicted runoff series was 97 %. Similar results were obtained for other drylands worldwide either for regional scales (e.g., the southern half of France, Folton & Lavabre, 2007; eastern Algeria, Mebarki, 2010; Bachir, Nouar, Hicham, Azzedine, & Larbi, 2015) or for a single catchment scale (e.g., the Nazas catchment in Mexico, Carmona, Ramírez, González, Caciano, & Ávalos, 2013; the Oued Louza catchment in Algeria, Djellouli et al., 2015; the Tahtali catchment in Turkey, Okkan & Fistikoglu, 2014).
Irrespective of the overall suitability in runoff predictions, the application of the GSST procedure revealed marked performance differences from one calibration period to another linked to climate-driven variations in prevailing flow conditions. Furthermore, relative performance analysis revealed that GR2M-97 and GR2M-06 performed better on periods exhibiting either low flow variability, flow constancy, or both. This may be explained by the fact that model parameters are optimized under average hydroclimatic variations occurring along the period used for calibration (Coron et al., 2012). Thus, the higher the variability and dispersion of flows along such a period, the higher the proportion of flow conditions remaining above or below standard conditions. The model performance to simulate the full range of flows is consequently lower. Argentinean dryland rivers are among the most variable in the world (McMahon, Peel, Vogel, & Pegram, 2007), and it is therefore not surprising that absolute and relative model efficiency ranged of 19 and 39 % along the 26 calibration periods, respectively.
Another important aspect to highlight is that GR2M-97 performed better than GR2M-06 for similar flow conditions. In addition to the way initial abstractions are computed, the main differences between the two model versions are given by a) the parameters left free for calibration; and b) the role of parameters X4 and X5 for computation of runoff outputs. Among all of these potential reasons, this study postulates that the superiority of GR2M-97 to predict runoff in this dryland catchment is primarily linked to one distinct parameter governing a good part of the model structure: parameter X3. GR2M-97 builds on determining the fraction of effective rainfall exceeding the soil infiltration capacity (i.e., direct runoff), whereas in GR2M-06 all the effective rainfall enters the routing reservoir (i.e., direct runoff equals zero). Infiltration-excess surface flow may represent a significant proportion of dryland runoff during wet periods (Graf, 1988), and thus GR2M-97 tends to be more able to simulate high flow magnitude than GR2M-06. On the other hand, many studies have demonstrated that runoff generation in drylands exhibits strong non-linear dependence on antecedent wetness (Beven, 2002). Non-linearity is given in both models by free parameters X1 and X3 regulating the catchment response to variable P and PE inputs. Although calibrating X1 (i.e., the capacity of H) could explain the reason why GR2M-06 performs suitably as well, leaving parameter X1 free in GR2M-97 did not provide clear improvements of model results. This suggests that calibrating the capacity of H may contribute very little to the model performance whether an adequate maximum capacity has been fixed. Another important reason explaining the superiority of GR2M-97 is the way runoff outputs are computed. After catchment water exchanges were computed, total runoff in GR2M-06 is proportional to the content of the routing reservoir (S) relative to a fixed capacity. In GR2M-97, total runoff equals the sum of surface and subsurface flows adjusted for catchment water exchanges. Subsurface flows are also proportional to the content of S, although S has an unfixed capacity. This ensures baseflow maintenance during dry spells and probably explains the superiority of GR2M-97 for low flow simulation in this perennial, dryland catchment.
Time instability of model parameters
Calibration-validation tests along the entire period of record (1916-1945) revealed that a) performance losses are most marked when model parameters are transferred from periods of higher flow, and b) such losses respond to overestimations in runoff predictions. Efficiency losses on high-flow periods were lower yet existed and were linked to underestimation of runoff volumes. Performance loss from calibration to validation responds to the combination of two aspects: a) model parameters compensate for problems in input data and structure-related model approximations that may change for different calibration periods, and b) the general idea of stability in catchment conditions, though meaningful differences may exist between the two periods (Coron et al., 2012; Merz et al., 2011). From both, the second aspect appears to be more meaningful in this highly variable dryland catchment, because if catchment conditions change, model parameters will also change. As argued by Brigode, Oudin, and Perrin (2013: 411): “different time periods used for calibration may provide quite different optimum parameter sets, depending on whether the period is dry or wet, for example, thus providing an estimation of parameter uncertainty with respect to their lack of robustness”.
Reliable predictions of catchment runoff yields are required to help decision-makers on future water planning and management (Vaze et al., 2011). Thus, the time (in)stability of parameters in hydrological modeling is the object of increasing research efforts worldwide, either in the context of climate variability (Coron et al., 2012; Louvet, Paturel, Mahé, Rouché, & Koité, 2016; Niel, Paturel, & Servat, 2003) or climate change (Brigode et al., 2013; Merz et al., 2011; Vaze et al., 2010). However, few studies have investigated how to handle the transferability of time-varying parameters to minimize performance loss in runoff predictions (Zeng, Xiong, Liu, Chen, & Kim, 2019). In addition, studies assessing the time (in)stability of model parameters in drylands are far less abundant than those assessing the efficiency of hydrological modeling on these distinct fluvial environments.
To improve the predictive performance of GR2M-97, this study used three regressions between model parameters and averaged hydroclimatic conditions by calibration period. This allowed model parameters to evolve over time, by varying, contrasting climate-driven flow conditions throughout the record. A similar approach was implemented by Wallner and Haberlandt (2015), although they used self-organized maps based on artificial neuron networks. Through this modification, the predictive efficiency of GR2M improved by 97 % concerning average efficiency losses from parameter transfer. Although model results are highly suitable in both absolute and relative terms, it should be noted that the model applicability outside the range of flow conditions that occurred during the calibration and verification periods is uncertain.
Conclusions
This paper tested the applicability of a simple conceptual hydrological model (GR2M) to predict long-term monthly runoff in a poorly gauged dryland catchment and implemented a GSST procedure to determine the influence of parameter transfer on model predictions under varying catchment conditions. In addition, two different model versions were evaluated and compared to determine the parameters that are more sensitive to dryland catchment hydrology. Both model versions provided suitable runoff predictions, in accordance with the results obtained for other dryland catchments worldwide. However, results showed that a) the quality of model predictions are affected by the magnitude, variability, and constancy of prevailing flow conditions from one calibration period to another, and b) performance differences between both model versions are effectively linked to the model structure; GR2M-97 showing higher sensitivity to extreme flow conditions and greater adaptability to flow variability. Reliable runoff predictions under contrasting catchment conditions are essential in drylands because water scarcity has as many implications on water resources planning and management as water excess. Although most models are currently available in literature will provide reliable results whether hydrological data for calibration are available, these findings outline the need for evaluating and comparing model parameters and approaches that best match hydrological processes within these distinct yet diverse fluvial environments.
In addition, this study showed that parameter transfer from calibration to validation may result in marked performance losses due to runoff overestimations on periods of lower flows than those observed on calibration, and vice versa. A simple method based on regression tree learning was proposed to overcome the timing instability of model parameters. Through this modification, model predictions improved notably. These results provide an important platform on which to base further investigations assessing the implications of climate-driven flow variability for future water resources planning and management. Yet the model applicability outside the range of flows that occurred over the period of record is highly uncertain. In this regard, further research efforts should center on evaluating the model's adaptability to current catchment conditions as well as its potential for transferability to other regional catchments.

