Notas
Water quality of Puyo River and tributaries, Pastaza, Ecuador
Abril-Saltos, Ricardo Vinicio1
 http://orcid.org/0000-0003-1544-4360
Armas-Chugcho, Patricia Abigail2
Chamorro, Washington Patricio3
Toscano-Salazar, Víctor Eduardo4
Sucoshañay-Villalva, Darwin Javier5
http://orcid.org/0000-0002-7724-1190
Ríos-Rodríguez, Antonio Fabricio6
http://orcid.org/0000-0001-6162-8086
http://orcid.org/0000-0003-1544-4360Armas-Chugcho, Patricia Abigail2
Chamorro, Washington Patricio3
Toscano-Salazar, Víctor Eduardo4
Sucoshañay-Villalva, Darwin Javier5
http://orcid.org/0000-0002-7724-1190Ríos-Rodríguez, Antonio Fabricio6
http://orcid.org/0000-0001-6162-8086
-
Publication dates-
June 26, 2025
May-Jun , 2021
- Article in PDF
- Article in XML
- Automatic translation
- Send this article by e-mail
- Share this article +
Abstract
This research was carried out in the sub-basin of Puyo River in the province of Pastaza in Ecuador between 2015 and 2018. It was aimed to characterize the environmental quality of water in different areas of the Puyo river sub-basin, including the main tributaries. The areas were classified as high, urban and low. A monitoring was carried out in the main course and its tributaries at 28 spots, registering values of conductivity, pH, temperature and oxygen saturation, chemical oxygen demand, biochemical oxygen demand, total and fecal coliforms as well as 413 surveys that were applied to identify the main types of activities that take place in the areas surrounding the main course and tributaries. The results showed differences in the concentrations of the different parameters in the dates and monitoring spots, reporting higher concentrations of BOD5, total and fecal coliforms in the urban area. The correlation analysis showed significant relationships between the variables studied except for oxygen saturation. The analysis of variance showed significant differences between the zones for electrical conductivity and the concentration of fecal and total coliforms. Surveys revealed that the majority of wastewater is deposited directly into the sewerage system and the main course of the river. It is concluded that the behavior of the different variables registered differs between the main body and tributaries, increasing the concentrations of total fecal coliforms from the urban area in the main body and differing the behavior of the other parameters in the three areas.
Keywords::
Water pollution, water, population
Introduction and objectives
Water management historically focused on meeting human needs for food and irrigation, leading to an oversight in the provision of fresh water for species and ecosystems (Ritcher, Mathews, Harrison, & Wigington, 2003) where rivers are also a source of recreation. Urbanization has had a significant impact on river ecosystems in riparian zones, generating changes in the structure and an increase in the load of pollutants. This affects the ecosystem functions of the water course. Other effects are the waterproofing of drainage areas and catchments at the headwaters of the rivers (Rörig et al., 2007).
-
Ritcher, Mathews, Harrison, & Wigington, 2003Ecologically sustainable water managementEcological Aplications, 2003
-
Rörig et al., 2007From a water resource to a point pollution source: The daily journey of a coastal urban streamBrazilian Journal of Biology, 2007
The main water source of the Pastaza canton, located in Pastaza-Ecuador is the river “Puyo”, which has an influence on 33.550 inhabitants in the urban area (Instituto Nacional de Estadísticas y Censos, 2010) and an impact in rural areas: 5 970 inhabitants in the district Tarqui (GADPR Tarqui, 2014); 1 027 inhabitants in “Fátima” (GADPR Fátima, 2015); 232 inhabitants in “Pomona” district (GADPR Pomona, 2015); 1 813 inhabitants in “Veracruz” (GADPR Veracruz, 2014) and Mera canton; 10 310 inhabitants in “Shell” (GADPR Shell, 2015), and 1 159 inhabitants in “Madre Tierra” (GADPR Madre Tierra, 2015). The total area of influence of the sub-basin of the river is approximately 60 130 inhabitants.
-
Instituto Nacional de Estadísticas y Censos, 2010Resultados del censo 2010, 2010
-
GADPR Tarqui, 2014Diagnóstico de la parroquia Tarqui, 2014
-
GADPR Fátima, 2015Plan de ordenamiento y desarrollo territorial de la parroquia Fátima, 2015
-
GADPR Pomona, 2015Plan de ordenamiento y desarrollo territorial de la parroquia Pomona, 2015
-
GADPR Veracruz, 2014Plan de ordenamiento y desarrollo territorial de la parroquia Veracruz, 2014
-
GADPR Shell, 2015Actualización del plan de ordenamiento y desarrollo territorial de la parroquia Shell, 2015
-
GADPR Madre Tierra, 2015Plan de ordenamiento y desarrollo territorial de la parroquia Madre Tierra, 2015
The river has two main branches known as Puyo and Pindo, which meet at the Unión Base sector. In its middle basin, many tourist, sports and ecosystem conservation activities are carried out. It crosses rural and urban areas where the wastewater does not have a treatment. This affects its physical-chemical characteristics and increases the importance of knowing the environmental quality of this water course and the relationship between the physicochemical and microbiological variables with the flow rates presented.
The research was carried out in the cantons “Mera” and “Pastaza” along the river “Puyo” sub-basin. Puyo River is the major supplier for the water requirements in Puyo city. In its main course two principal dams can be found: Puyo and Pindo as well as the tributaries for recreational dam. Its basin has an area of 355 km2 and a total channel length of 41.4 km. In addition, in several sectors of its main course and tributaries, there are natural spas where recreational activities are carried out.
This investigation was done between 2015 and 2018. Its focus was mainly the thematic field of water quality and the main objective was to characterize the environmental quality of water in different spots of the Puyo river sub-basin, including the main tributaries.
Materials and methods
The monitoring process was carried out from 2015 to 2018 at 28 spots; 10 of them located in the main course and 18 in the tributaries (Figure 1), covering a channel length of 9.2 km on the Pindo branch and 17 km on the branch Puyo. Composite samples were taken (Jadhav & Purohit, 2008), recording in situ values of conductivity, pH, and oxygen saturation (AWWA Staff, 2010) and collecting samples for the analysis of biochemical oxygen demand (BOD5) (Standard Methods No 5210B Chemical oxygen demand (HACH 8000) (Hach, 2014) and total coliforms (Standard Methods No. 9222B) (Rice, Baird, Eaton, & Clesceri, 2012), fecal coliforms (Standard Methods No. 9222 D and 9222l). Table 1 shows: geographic coordinates, height, channel length, and base expenditure for normal and low precipitation seasons.
-
Jadhav & Purohit, 2008Global pollution and environmental monitoring, 2008
-
AWWA Staff, 2010Water Quality, 2010
-
Hach, 2014Oxygen Demand, Chemical (Method 8000), 2014
-
Rice, Baird, Eaton, & Clesceri, 2012Standard methods for the examination of water and wastewater, 2012
Thumbnail
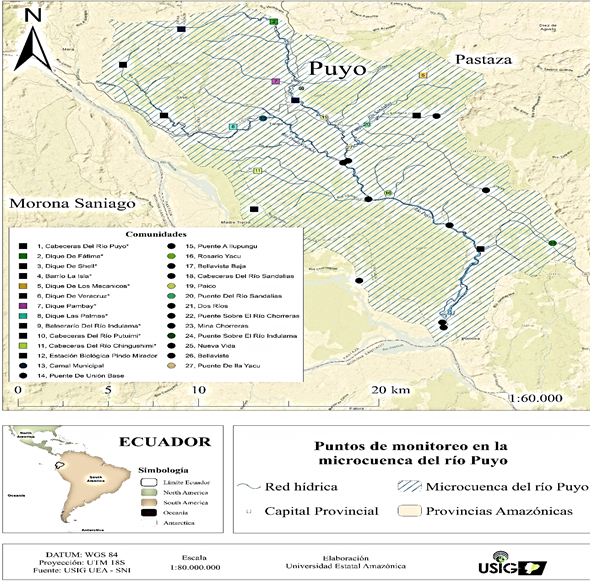
Figure 1
Location map of monitoring spots.
Location map of monitoring spots.
Table 1
Location coordinates of the sampling points.
Location coordinates of the sampling points.
| X | Y | Description | Zone | Branch | Altitude (m.a.s.l) | Parish | Soil coverage Characteristics | Slope (%) | Length of section channel | Channel length from the source | Basic flow (m3/s) | |
|---|---|---|---|---|---|---|---|---|---|---|---|---|
| Normal | Low rainfall | |||||||||||
| Main course | ||||||||||||
| 160336 | 9841315 | Puyo river headwather | Upper- Rural | Puyo | 1 256 | Mera | SF | 7.0 | 0 | 0 | 0.10 | 0.09 |
| 165474 | 9841913 | Fátima Dam | Upper- Rural | Puyo | 996 | Fátima | SF + G | 5.2 | 8 | 8 | 0.86 | 0.71 |
| 166665 | 9835765 | La Isla neighborhood | Urban | Puyo | 926 | Puyo | UZ | 1.1 | 9 | 17 | 5.00 | 3.72 |
| 169329 | 9830911 | Unión Base Bridge | Low- Rural | Puyo | 901 | Pomona | SF + G | 0.5 | 7 | 24 | 7.42 | 5.63 |
| 157105 | 9838531 | Pindo Mirador Biological Station | Upper- Rural | Pindo | 1 134 | Shell | SF+G | 7.5 | 4.2 | 4.2 | 0.76 | 0.37 |
| 159382 | 9834582 | Shell Dam | Urban | Pindo | 1 045 | Shell | SF+G | 1.8 | 5 | 9.2 | 2.63 | 1.45 |
| 164881 | 9834360 | Municipal slaughterhouse | Urban | Pindo | 921 | Puyo | UZ | 2.5 | 8 | 17.2 | 6.03 | 1.63 |
| 169595 | 9831059 | Ilipungu Bridge | Low- Rural | Puyo | 901 | Puyo | SF+ G+ UZ | 0.3 | 7.8 | 25 | 6.95 | 3.19 |
| 171825 | 9828556 | Rosarío Yacu | Low -Rural | Puyo | 887 | Veracruz | SF + G+C | 0.2 | 5.2 | 30.2 | 18.32 | 13.77 |
| 174914 | 9818079 | Low Bellavista | Low- Rural | Puyo | 801 | Madre | SF + G | 0.9 | 15.7 | 45.9 | 27.61 | 24.01 |
| Tributaries | ||||||||||||
| X | Y | Description | Zone | Branch | Height (m.a.s.l) | Parish | Soil coverage Characteristics | Basic flow (m3/s) | ||||
| 177246 | 9828776 | Chorreras river bridge | Low- rural | Puyo | 992 | Veracruz | SF+G+C | 0.61 | 0.37 | |||
| 174498 | 9834557 | Sandalias river headwather | Upper- rural | Puyo | 983 | Veracruz | SF+G+C | 0.04 | 0.03 | |||
| 173746 | 9837726 | Mechanic`s Dam (Chilcayacu river) | Upper- rural | Puyo | 979 | Veracruz | SF+G+C | 0.09 | 0.06 | |||
| 173397 | 9834595 | Veracruz Dam (Sandalias river) | Upper- rural | Puyo | 959 | Veracruz | SF+G+C | 0.33 | 0.10 | |||
| 165582 | 9837248 | Pambay Dam (Pambay river) | Upper-urban | Puyo | 952 | Puyo | SF+G+UZ | ND | ND | |||
| 168291 | 9834451 | Paico (Chilcayacu river) | Urban | Puyo | 923 | Puyo | SF+G+UZ | 0.70 | ND | |||
| 163223 | 9833715 | Las Palmas | Urban | Pindo | 966 | Puyo | SF+UZ | ND | ND | |||
| 170644 | 9833900 | Sandalias river bridge | Urban | Puyo | 953 | Puyo | SF+G+UZ | 1.17 | 0.80 | |||
| 170727 | 9828064 | Dos Ríos comunity (Chingushimi river) | Low- rural | Puyo | 906 | Veracruz | SF+G+C | 1.92 | ND | |||
| 175231 | 9826044 | Chorreras mine | Low- rural | Puyo | 860 | Veracruz | SF+G+C | 1.16 | 0.65 | |||
| 180945 | 9824657 | Indulama river bridge | Low- rural | Puyo | 998 | Pomona | SF+G+C | 0.42 | 0.23 | |||
| 176956 | 9824201 | Indulama river bath | Low- rural | Puyo | 998 | Pomona | SF+G+C | 1.74 | 1.23 | |||
| 164396 | 9827279 | Putuimi river headwather | Low- rural | Puyo | 937 | Madre Tierra | SF+G+C | 0.28 | 0.05 | |||
| 170229 | 9821720 | Nueva Vida | Low- rural | Puyo | 833 | Tarqui | SF+G+C | 1.80 | 1.20 | |||
| 174838 | 9818474 | Bellavista | Low- rural | Puyo | 799 | Madre Tierra | SF+G+C | 4.19 | 1.76 | |||
| 169686 | 9832099 | Ila Yacu Bridge | Low- rural | Puyo | 921 | Veracruz | SF+G | 2.48 | ND | |||
| 164592 | 9830277 | Chingushimi headwather | Low- rural | Puyo | 941 | Tarqui | SF+G+C | 0.06 | 0.05 | |||
The monitoring spots were grouped into three zones, considering the upper zone as that located in the upper basin with slopes ≥ 5 % where no urban settlements exist and urban areas with population settlements greater than 1000 people and lower areas subsequently located after the above mentioned settlements. Daily and monthly rainfall during the study period was also recorded for reference with an automatic meteorological station at the Pindo Mirador Biological Station located in the upper area. With the results obtained, a Pearson correlation (Fernández & Díaz, 2001) was applied with the use of the SPSS program (IBM, 2013), to determine, depending on each area, the relationship between the different parameters evaluated. The variables of the precipitation on the monitoring day and the precipitation of the previous day were also taken into consideration.
-
Fernández & Díaz, 2001Relación entre variables cuantitativas. Unidad de Epidemiología Clínica y BioestadísticaCuadernos de Atención Primaria, 2001
-
IBM, 2013SPSS Statistic. Vers 22, 2013
The statistic coefficient of variation were determined in line with the monitoring spots and an analysis of variance was performed with Duncan comparison tests for the different parameters depending on the areas. The INFOSTAT (Di-Rienzo et al., 2014) statistical program was used for this purpose. Prior to the analysis, the oxygen saturation percentage values were transformed with the square root function (Herrera, 2013). The values of the different parameters were compared with the Ecuadorian regulations referred to in the Unified Text of The Secondary Environmental Legislation (TULSMA). Book VI Annex 1 (Ministerio del Ambiente del Ecuador, 2015), considering the water quality criteria for recreational use with primary contact and admissible quality criteria for the preservation of aquatic and wildlife in fresh, marine and estuarine waters.
-
Di-Rienzo et al., 2014INFOSTAT vers. 2014, 2014
-
Herrera, 2013Métodos estadísticos alternativos de análisis con variables discretas y categóricas en investigaciones agropecuarias, 2013
-
Ministerio del Ambiente del Ecuador, 2015Texto Unificado de Legislación Ambiental Secundaria (TULSMA), 2015
A survey was carried out in the towns and villages near the main course and its tributaries in order to identify the types of productive activities that are carried out and the availability of basic services, which were distributed according to the population density of those sectors. A total of 341 inhabitants were surveyed (25 in the upper area, 212 in the urban area and 104 in the lower area) and 72 people in the tributaries (5 in the upper area and 67 in the lower area), giving a total of 413 surveys. This number exceeds the value calculated for finite population sample size (equation 1) which is 165 with a confidence level of 99 % (Morales, 2011) considering a population of 60 130 inhabitants.
-
Morales, 2011Tamaño de da muestra, 2011
Sample size:
e2
n
=
N
Z
2
p
q
(
N
-
1
)
e
2
+
Z
2
p
q
(1)
Where n: sample size; N: size of the universe (total population); Z: confidence level of the estimate, considering 99 % confidence. (2 576); p: probability of acceptance (0.5); q: probability of rejection (0.5); e: margin of error (10 %).
Results
Figure 2 allows observing the precipitation characteristics reported at the Pindo Mirador station in the sampling period with annual rainfall averaging 5005 mm and a monthly average of 417mm. The least rainy months show rainfalls higher than 190mm. April 2015 and January 2017 were the months with the greatest precipitation whereas September 2015, January 2016 and February 2018 showed the lowest precipitations. The precipitation characteristics reported by the Pindo Mirador station for the sampling days and the previous day were: February 2015: 9 mm and 11.8 mm; March 2015: 0 and 2 mm; April 2015: 17.6 mm and 4.4 mm; June 2015: 0.2 mm and 4.4 mm; Nov. 2016: 16.4 mm and 18 mm; Dec. 2016: 5.6 mm and 0; Sep. 2017: 3.7 mm and 8.2 mm; Nov. 2017: 12.2 mm and 9.8 mm; Sep. 2018: 7.3 and 14.2 mm; 9.9 mm and 9.3 mm; October 2018: 4.7 mm and 8.4 mm.
Thumbnail
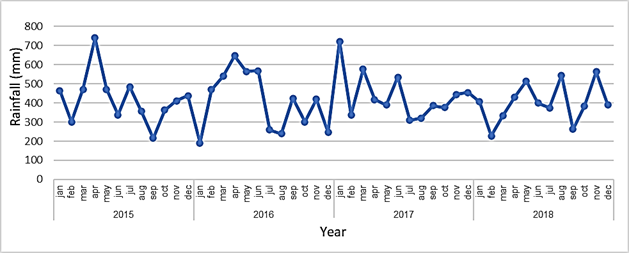
Figure 2
Monthly rainfall recorded in the Pindo Mirador Biological Station located by study area. Source: Data collected in the automatic meteorological station.
Monthly rainfall recorded in the Pindo Mirador Biological Station located by study area. Source: Data collected in the automatic meteorological station.
The general electrical conductivity on all dates (Figure 3) presents higher reports in the river main course, in the upper area of Fátima as well as Pambay and Las Palmas dams, where its average exceeds 100 us/cm2, later decreasing in In the lower areas of the basin. This may be due to the presence of higher flows which generate greater dilution. In the tributaries a higher electrical conductivity is reported in the upper area of Pambay dam and in the urban area of Las Palmas dam with lower values at the other monitoring spots. The Shell dam is the one with the highest coefficient of variation (Table 2).
Thumbnail
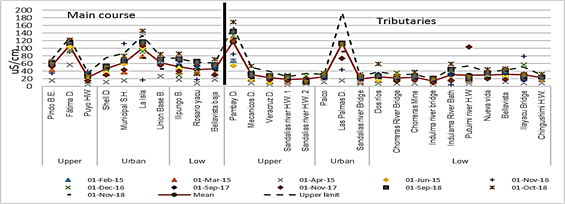
Figure 3
Recorded conductivity values.
Recorded conductivity values.
Table 2
Coefficient of variation (CV) of registered variables.
Coefficient of variation (CV) of registered variables.
| Point | Oxygen saturation | Total colif. | Fecal coliform. | Conductividad | pH | COD | BOD5 |
|---|---|---|---|---|---|---|---|
| B.S. Pindo Mirador | 17.8 | 162.1 | 148.6 | 29.6 | 4.8 | 57.3 | 96.5 |
| Fátima Dam | 17.8 | 162.0 | 235.3 | 18.4 | 5.3 | 66.4 | 83.0 |
| Puyo river headwater | 25.7 | 241.7 | 225.9 | 45.8 | 11.2 | 57.7 | 103.2 |
| Shell Dam | 24.6 | 100.6 | 123.7 | 31.3 | 6.2 | 72.9 | 101.2 |
| Municipal slaughterhouse | 24.9 | 129.0 | 88.1 | 39.8 | 7.6 | 60.5 | 72.1 |
| The island Neighborhood | 18.0 | 106.3 | 141.6 | 35.3 | 3.7 | 62.7 | 92.2 |
| Unión Base Bridge | 10.3 | 136.7 | 250.9 | 25.2 | 7.4 | 46.8 | 92.0 |
| Ilipungo Bridge | 20.1 | 186.6 | 111.6 | 39.0 | 7.2 | 62.5 | 103.0 |
| Rosario yacu | 13.2 | 149.4 | 148.0 | 42.4 | 7.7 | 58.5 | 79.2 |
| Low Bellavista | 20.8 | 159.7 | 200.0 | 32.0 | 8.6 | 87.1 | 79.7 |
| Pambay Dam | 22.6 | 178.8 | 94.5 | 33.5 | 3.4 | 119.1 | 132.4 |
| Mechanic`s Dam | 22.7 | 113.6 | 198.6 | 43.5 | 10.0 | 56.5 | 93.0 |
| Veracruz dam | 24.9 | 201.7 | 112.6 | 41.6 | 8.8 | 71.8 | 120.7 |
| Sandalias river hw1 | 27.3 | 274.0 | 188.1 | 36.1 | 7.6 | 45.0 | 127.4 |
| Sandalias river hw2 | 27.2 | 115.9 | 150.8 | 37.0 | 9.1 | 64.3 | 118.3 |
| Paico | 23.2 | 232.5 | 228.5 | 27.0 | 7.0 | 76.1 | 102.4 |
| Las Palmas Dam | 25.5 | 214.1 | 130.5 | 36.6 | 3.5 | 79.1 | 101.3 |
| Sandalias river b. | 8.8 | 211.1 | 124.3 | 32.2 | 8.7 | 94.4 | 153.1 |
| Dos rios | 22.9 | 189.0 | 184.9 | 56.2 | 8.8 | 73.0 | 92.0 |
| Chorreras river Bridge | 21.6 | 240.8 | 132.7 | 40.6 | 11.1 | 38.5 | 103.1 |
| Chorreras mine | 14.4 | 259.6 | 159.4 | 34.9 | 9.2 | 46.9 | 119.5 |
| Indulama river Bridge | 17.8 | 203.7 | 208.3 | 32.8 | 10.9 | 67.2 | 115.5 |
| Indulama river Bath | 24.2 | 287.3 | 156.3 | 54.7 | 8.5 | 69.1 | 85.4 |
| Putuimi river headwater | 26.7 | 256.0 | 217.3 | 90.1 | 10.4 | 45.2 | 87.2 |
| Nueva Vida | 18.2 | 158.8 | 152.3 | 26.2 | 8.7 | 54.3 | 81.5 |
| Bellavista | 27.4 | 200.5 | 185.9 | 31.7 | 7.5 | 84.0 | 117.7 |
| Ilayacu river bridge | 17.8 | 166.5 | 149.5 | 65.2 | 7.2 | 48.1 | 93.6 |
| Chingushimi river headwater | 19.8 | 143.3 | 172.7 | 26.6 | 9.2 | 37.8 | 75.7 |
| Mean | 20.92 | 185.04 | 165.03 | 38.76 | 7.83 | 64.38 | 100.77 |
The hydrogen potential (Figure 4a), presented values between 6 to 9, at the monitoring spots in the main course. The values were compared with the admissible quality criteria for the preservation of aquatic and wild life in fresh waters that establishes values between 6.5 and 9 and for admissible quality criteria for recreational use with primary contact with values between 6.5 and 8.3 (Ministerio del Ambiente del Ecuador, 2015). The majority of spots showed values below the permissible limit in June 2015 and April 2015 at Bellavista bajo spot, Sandalias 2 River headwaters, the Bridge over Chorreras River, the bridge over the Indulama River, Indulama River spa, Ilayacu and the Chingushimi River headwaters. In November 2017, the lowest value was recorded at the headwaters of the Sandalias 2 River.
-
Ministerio del Ambiente del Ecuador, 2015Texto Unificado de Legislación Ambiental Secundaria (TULSMA), 2015
Thumbnail
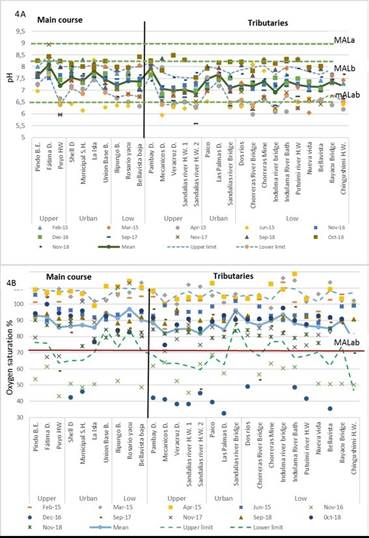
Figure 4
Registered values of a) hydrogen potential, b) oxygen saturation.
Registered values of a) hydrogen potential, b) oxygen saturation.
The maximum permissible limit on water quality criteria for the preservation of aquatic and wildlife in freshwater was not exceeded at the sampling spots and dates. However, the spas in Fatima, Indulama river and Veracruz did exceed the limits in November 2017 and September 2018. The general mean shows the highest values in Fátima and Pambay dams which are close to the limit.
The oxygen saturation levels (Figure 4b), were at all spots above the minimum permissible limit. Both mentioned criteria must exceed 80 % saturation except for June 2015 in: Shell, Mecánicos, Veracruz, Las Palmas at the municipal camal spot, headwaters of the Sandals River 1 and 2, Dos Ríos, Indulama river spa, headwaters of the Putuimi and Bellavista rivers. Some spots in November 2016 and October 2018 showed the same information.The spots where values below the minimum limit are repeatedly reported are in the main body of the headwaters of Puyo River, the Municipal Camal, La Isla neighborhood, the tributaries of Veracruz and Los Mecánicos dams and Rio Sandalias 2 headwaters. The average numbers in the Main course register values higher than 80 %, decreasing in the urban area and increasing in the lower area, which being the same watercourse represent a re-oxygenation in the lower areas. In the tributaries the lowest concentrations were found in the Mecanicos dam, and in the headwaters of the Sandalias 2 River.
The chemical oxygen demand (Figure 5a) reported higher values in the months of February and April 2015, mainly in the districts and tributaries of Bellavista Baja, Fátima dam, Barrio la Isla, Veracruz dam, headwaters of the Sandalias 2 River, the bridge over the Indulama River, Indulama River spa and Bellavista. The Pambay dam reported higher values in September 2018. The average figure per spot shows higher values in: La Isla and Barrio Bellavista neighborhoods, in the main course and in the headwaters of the Sandalias 2 River, Bellavista and the headwaters of the Chingushimi River in the tributaries. This parameter It`s not considered in the equatorian legal normative, so it does not compare the treshold limit values.
Thumbnail
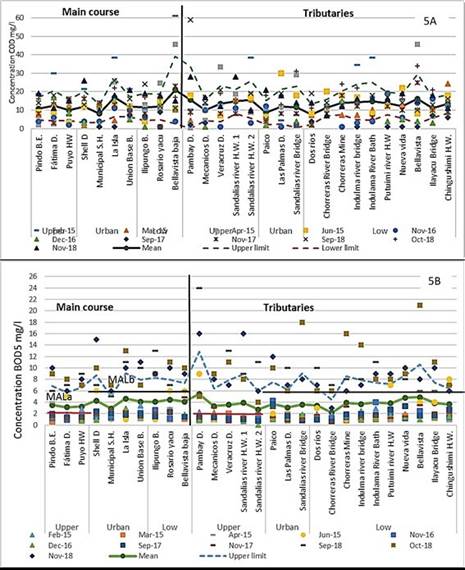
Figure 5
Recorded values of concentrations of a) chemical oxygen demand, b) biochemical oxygen demand.
Recorded values of concentrations of a) chemical oxygen demand, b) biochemical oxygen demand.
In the biochemical oxygen demand (Figure 5b), the maximum allowable limit for admissible quality criteria of the DB05 was considered for the protection of non-impacted aquatic life, which corresponds to areas of the upper basin, where the limit is 2 mg/l and has a moderate impact corresponding to urban and low areas where the maximum limit is 6 mg/l. The samplings indicated values higher than those established in the standard of the main course in February 2015 in the upper part of Puyo River headwaters. In April those values were shown at Pindo River spot, while in June in the high area of Fatima dam. Regarding tributaries, the month of June showed high values in Pambay River dam and in the low part of Putuimi River headwaters, Nueva Vida and Chingushimi River headwaters. In the samplings of November 2017, September 2018 (a, b), and October 2018, most spots exceeded the maximum allowable limit. The average values in the main course and tributaries are within what is established in the permissible limits of Ecuadorian regulations in urban and low areas where it is considered a condition of moderate impact for aquatic life. The opposite though can be found in the upper area where non-impacted aquatic life is considered. Furthermore, higher concentrations are reported in the main course of Rosario Yacu, Shell dam and La Isla neighborhood as well as the tributaries in Pambay dam.
In terms of total coliform values (Figure 6a), the water quality criterion for recreational use with primary contact establishes a maximum permissible limit of 2000 in its most probable number / 100 ml. In general, all the spots exceed the maximum permissible limit, except for April 2015, September 2018 (a, b), and October 2018 where most spots present values below the permissible limit. The general average shows that only the Mecánicos dam reaches the maximum allowable limit. In the main course, the upper part presents lower concentrations, but they increase from as the water course pass through the urban area. In the tributaries this trend is not shown. In the fecal coliform measure (Figure 6b) the water quality criterion for recreational use with primary contact establishes a maximum limit of 200 NMP / 100 ml. The main course presents values within the limits in the upper area of Pindo River and Fátima dam as of March and June 2015, December 2016, September and November 2017. In the urban area, the Shell dam shows the same values in March and April.
Thumbnail
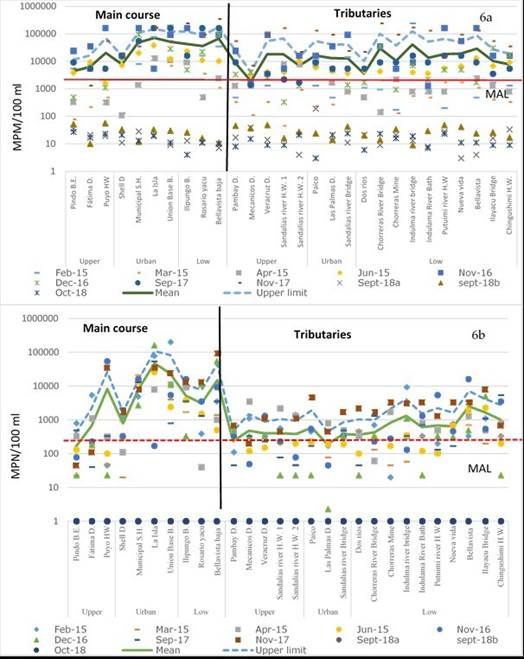
Figure 6
Concentration of a) total coliforms, b) fecal coliforms.
Concentration of a) total coliforms, b) fecal coliforms.
From this point on, the concentration of fecal coliforms in the urban area increases and subsequently decreases in the lower area. However, it remains above the maximum permissible limit.In the tributaries, the months of March and June 2015 and December 2016 present values below the maximum allowable limit. The average values generally show numbers within the permissible limit in the main course of Pindo River and in the tributaries of Las Palmas dam. The rest of the spots exceed the permissible limits, observing the highest concentrations in La Isla neighborhood, Union Base bridge and Bellavista. The samplings carried out in September a and b and October 2018 reported values of 1 MPN
Table 2 shows the coefficients of variation for each parameter at each point. In general, one can say that the variables with the highest coefficients of variation are the total coliforms, fecal coliforms and the biochemical oxygen demand. On the other hand, for each parameter we can detect spots with the highest coefficient of variation, corresponding to oxygen saturation and total coliforms at the headwaters of Sandalias 1 River, fecal coliforms on the Union Base bridge, conductivity at the headwaters of the Putuimi River, hydrogen potential at the headwaters of the Puyo river, chemical oxygen demand in the Pambay River dam and biological oxygen demand in the sandals river bridge.
The analysis of variance between zones (Table 3) reported differences of 0.05 between zones for the electrical conductivity parameters and total coliforms in the main course, while in tributaries it was reported for electrical conductivity and fecal coliforms. Duncan's mean comparison test (Table 3) showed that in the low area the electrical conductivity in the main course differs from the high and urban areas, reporting the lowest values of the three areas, which may be due to dilution effects due to increased water volumes in this sector. This behavior is also observed in the tributaries. In the main course, the measurement of total coliforms in the lower area presents differences with respect to the other zones. In the tributaries, the concentration of fecal coliforms reports higher values in the lower zone. In both cases it may be because of accumulation of materials deposited in the wastewater collected in the upper and urban areas.
Table 3
Analysis of variance and Mean comparation test of the parameters between zones for the main course and tributaries.
Analysis of variance and Mean comparation test of the parameters between zones for the main course and tributaries.
| Parameter | P value | |||
|---|---|---|---|---|
| Main course | Tributaries | |||
| Conductivity | 0.0385 | 0.001 | ||
| Oxygen saturation | 0.5834 | 0.4739 | ||
| pH | 0.0742 | 0.2309 | ||
| Chemical Oxygen Demand | 0.3074 | 0.343 | ||
| Biochemical Oxygen demand | 0.5939 | 0.8955 | ||
| Total coliform | 0.0219 | 0.4971 | ||
| Fecal coliform | 0.0921 | 0.0316 | ||
| Duncam comparation test | ||||
| Tributaries | ||||
| Parameter | Fecal coliform | Conductivity | ||
| Zone | Mean MPN/100 ml | Experimental E. | Mean uS/cm2 | Experimental E. |
| Upper | 386.24 a | 225.95 | 38.67b | 3.9 |
| Urban | 390.2 a | 291.7 | 45.57b | 5.03 |
| Low | 1 026 b | 161.25 | 26.15 a | 2.78 |
| Curso principal | ||||
| Parameter | Conductivity | Total coliform | ||
| Zone | Mean uS/cm2 | Experimental E. | Mean MPN/100ml | Experimental E. |
| Upper | 60.85ab | 5.23 | 10 313.12 a | 10 800.55 |
| Urban | 65.62 b | 4.53 | 44 649.55 b | 9 353.55 |
| Low | 47.97ab | 5.23 | 48 833.3 b | 10 800.55 |
The correlation analysis (Table 4) shows significant positive relationships at 0.01 between oxygen saturation with chemical and biochemical oxygen demand in the low zone. Also shown in the table are the relationships between total and fecal coliforms, conductivity and pH, biochemical oxygen demand with pH and the chemical oxygen demand. Significant negative correlations are shown at 0.05 in the urban area between BOD with oxygen saturation, total coliforms and in the low area between total coliforms with pH and biological oxygen demand. Significant positive relationships at 0.05 were also identified between conductivity with chemical oxygen demand in the urban area and biological oxygen demand in the upper zone. Significant correlations are stated in the three zones at 0.01. This is the case of total coliforms with fecal coliforms between pH and conductivity in the upper zone whereas the urban and lower zones showed relations at 0.05. In addition, between the COD and pH in the urban area and BOD and COD correlations at 0.05 are also displayed in the upper area. The value of 0.01 appeared also in the urban area. The precipitation of the sampling day with the precipitation of the previous day shows significant correlations at 0.01.
Table 4
Correlation between parameters.
Correlation between parameters.
| Zone | Parameter | Total coliform | Fecal coliform | Conductivity | pH | COD | BOD | Oxygen saturation | Sampling day rainfall | Previus day rainfall |
|---|---|---|---|---|---|---|---|---|---|---|
| Upper | Total coliform | 1 | .932** | -.135 | -.153 | -.253 | -.256 | -.149 | .373* | .442** |
| Fecal coliform | 1 | -.194 | -.234 | -.103 | -.208 | -.106 | .314 | .329 | ||
| Conductivity | 1 | .673** | .321 | .156 | .078 | -.167 | .119 | |||
| pH | 1 | .323 | .324 | .034 | .036 | .160 | ||||
| COD | 1 | .401* | .051 | -.326 | .082 | |||||
| BOD | 1 | .267 | -.139 | .204 | ||||||
| Oxygen saturation | 1 | -.002 | .300 | |||||||
| Urban | Total coliform | 1 | .659** | .267 | .021 | -.201 | -.366* | -.201 | -.088 | -.046 |
| Fecal coliform | 1 | .202 | .116 | .223 | -.177 | -.209 | -.023 | -.077 | ||
| Conductivity | 1 | .349* | .310* | .225 | -.110 | -.077 | .067 | |||
| pH | 1 | .194 | .343* | -.091 | .069 | .219 | ||||
| COD | 1 | .536** | .148 | .110 | .280 | |||||
| BOD | 1 | .129 | -.163 | .223 | ||||||
| Oxygen saturation | 1 | -.110 | .030 | |||||||
| Low | Total coliform | 1 | .721** | -.101 | -.235 | -.119 | -.268 | -.090 | .264 | .247 |
| Fecal coliform | 1 | -.128 | -.210 | .009 | -.152 | -.230 | .179 | -.044 | ||
| Conductivity | 1 | .422* | -.066 | .397* | .126 | -.271 | .347* | |||
| pH | 1 | .032 | .336 | -.047 | -.104 | .299 | ||||
| COD | 1 | .167 | .308 | .149 | -.047 | |||||
| BOD | 1 | .185 | -.099 | .217 | ||||||
| Oxygen saturation | 1 | -.056 | .137 | |||||||
| Sampling day rainfall | 1 | .484** | ||||||||
| Previus day rainfall | 1 | |||||||||
Regarding the precipitation of the sampling and previous day in the upper zone, this has been shown a significant correlation with total coliforms at 0.05 on the day of sampling and 0.01 the previous day and at 0.05 with conductivity and precipitation on the previous day in the low zone. In this case, the three areas reported the same value since we only worked with one meteorological station.
The results of the survey showed that in terms of agricultural activity in the main course (Table 5) the cultivation of cassava, “Chinese” potatoes and sugar cane predominates. Over 40 % of all people surveyed spend their time with this agricultural activity. Cattle (22 %), pigs and poultry production (18 %) as well as livestock production are found in lower percentages. There is a predominance of sawmills and car wash centers in the urban area. In the tributaries the cultivation of Chinese potatoes stands out in the lower area, followed by cassava and sugar cane, which are distinctive of the upper area. In high and low areas, the production of cattle, pigs and chickens stands out, the latter also being prominent in the low areas, where a low number of small industries such as sawmills and brown sugar loaf shops are reported. Although this study does not contemplate the areas dedicated to these productions, we can cite Abril Ruiz, Alonso, Torres and Cabrera (2016), who describes the agricultural situation of these areas in a study carried out in the province of Pastaza which includes all the districts covered, in the study area of this research. The study reveals the following: 1 403.8 ha for sugar cane production 141.3 ha for Cassava and plantain. Pastures for handling cattle 284.8 ha; 17 farms have between 11 to 50 animals and 2 to 10 cattle heads. 9 farms have up to 10 animals. 3 farms have 10 to 100 animals. There is a total of 12 farms that have of up to 100 chickens. One farm has 101-500 chickens and two farms more than 2 000 chickens.
-
Abril Ruiz, Alonso, Torres and Cabrera (2016Prospección de especies vegetales en la provincia de Pastaza, EcuadorCuban Journal of Agricultural Science, 2016
Table 5
Activities that development in the area and sanitary services.
Activities that development in the area and sanitary services.
| Hight (%) | Upper (%) | Low (%) | Upper (%) | Low (%) | ||
|---|---|---|---|---|---|---|
| Agricultural (Crop) | Sugar cane | 4 | 8 | 40 | 20 | 39 |
| Chinese potatoes | 8 | 9 | 53 | 0 | 51 | |
| Cassava | 12 | 10 | 58 | 20 | 39 | |
| Banana | 8 | 3 | 34 | 0 | 27 | |
| Cocoa | 3 | 26 | ||||
| Citrus | 2 | 11 | 0 | 3 | ||
| Others | 8 | 16 | ||||
| Livestock | Cattle | 8 | 2 | 23 | 0 | 3 |
| Pig Cattle | 8 | 2 | 18 | 0 | 4 | |
| Kitchen | 4 | 1 | 18 | 20 | 7 | |
| Fish | 4 | 20 | 3 | |||
| Horses | 1 | 12 | 0 | 1 | ||
| Industrial | Sawmill | 1 | 0 | 1 | ||
| Paneleras | 2 | 0 | 1 | |||
| Lubricators | 2 | 1 | 1 | |||
| Others | 2 | 0 | 1 | |||
| Has sewerage | 8 | 25 | 6 | 20 | 18 | |
| Type of service | Higienic service | 28 | 42 | 9 | 80 | 18 |
| Latrine | 8 | 19 | 48 | 33 | ||
| Septic Tank | 36 | 20 | 26 | 20 | 28 | |
| Other not specified | 20 | 10 | 13 | 12 | ||
| Final disposal of sewage | Sewerage | 16 | 39 | 16 | 80 | 16 |
| River | 44 | 28 | 42 | 46 | ||
| Estuary | 12 | 13 | 22 | 20 | 13 | |
| Other | 28 | 23 | 26 | 3 | ||
In terms of basic services, both the main course and tributaries (Table 5) have a large coverage of electricity and water services. In the urban area of the main course, the sewerage reaches 30 % of coverage, whereas in the rest of the areas this percentage is less than 20 %. Most areas have a garbage collecting service. However, this service only works in the urban area on a daily basis. In the upper and urban areas of the main course, the use of toilet and septic tanks predominates. In the lower area, the use of latrines is more common. Only 40 % of the population in urban areas disposes wastewater in the public sewage system. In the upper and lower areas, they are mostly disposed in the river or in estuaries. In the upper zone of the tributaries, there is a greater use of hygienic service and the residual water is thrown in its majority into the public sewage system. In the lower areas latrines and septic tanks are mainly used and the water is deposited directly to the river and estuaries. The results of the basic services analysis are related to the concentrations of fecal coliforms. They indicate that in the high and low areas that have rural characteristics, the deposition of fecal matter would present more discharges with little volume, generating a dispersion of the pollutant, while in the urban area, it is deposited in the sewage system also receiving contributions discharged directly to the river. This confirms the fact that the influence of the type of area affects the concentration of fecal coliforms, being more evident in the urban area, where statistical differences evidenced in the analysis of variance were identified.
Discussion
The study shows that there is an interaction between the type of area, where there is an influence of the population over the concentration of the different parameters. The upper area mainly has a secondary forest coverage and less population and shows in its parameters values more adjusted to the criteria established in Ecuadorian regulations. This area presents an undulating topography and a greater number of slopes. It also presents changes in the relief (8 km from the spring on both branches). According to the criteria of Martínez (2005) they present a high slope (> 7 %) and average (2 to 7 %), which influences on having a higher flow velocity and a greater presence of waterfalls, generating greater oxygenation. However, the type of origin of each branch also shows a different response, since the Pindo branch originates from the accumulation of water from a swamp and the monitoring spot is 4 km from the source. Whereas, the headwaters point of the Puyo River is at the same source that comes from sources underground. As a result, in the first case it has a longer route and influences having a higher oxygen saturation. However, 8 km from the source, at Fátima Dam, we can observe values similar to the ones of the Pindo Mirador station. Considering the upstream of these points and the fact that there are no population settlements, these saturation levels reach averages of 90 %. This is also reflected in lower COD, BOD5, and total coliform concentrations, but not in faecal coliform concentrations.
-
Martínez (2005)Hidrología práctica, 2005
The concentration analysis of total and faecal coliforms in both branches of the main body shows an accumulation effect as the current passes through the urban area. Considering the last spots in this area before the low-rural area, the flows reach 7.42 m3/s in the Puyo branch and 6.03 in the Pindo branch. This suggests that these water volumes are exceeded in their dilution capacity of these two variables.
Romero, Chaile and Amoroso (2010), in their studies of mountain rivers showed an increase in the value of hydrogen potential in the areas of the lower basin compared to those in the upper basin, where the presence of large populations is not identified. This is not observed in this study and indicates that the presence of people influences the behavior of water quality.
-
Romero, Chaile and Amoroso (2010)Bacteriología e hidroquímica de ríos de montaña, TucumánAUGMDOMUS, 2010
Pérez and Rodríguez (2008) indicate that changes in pH may indicate the entry of fertilizers and eutrophication processes. Marques, Albertoni and Palma-Da-Silva (2012) show high values in the dams. Compared to the results of this research, the upper zone of the main course and Fatima dam report higher values. The same happens in the tributaries of Pambay dam and the urban area of Las Palmas dam which are characterized by having no population in their upper course.
-
Pérez and Rodríguez (2008)Índice fisicoquímico de la calidad de agua para el manejo de lagunas tropicales de inundaciónRevista Biología Tropical, 2008
-
Marques, Albertoni and Palma-Da-Silva (2012)Water quality in the lotic area of the Antas River before and after the construction of the Monte Claro hydroelectric plant, south BrazilActa Limnologica Brasiliensia, 2012
The dissolved oxygen values are higher than those set by Pérez and Rodríguez (2008), who indicates that levels below 55 % affect aquatic life in tropical environments. This may be due to the fact that it’s a mountain river, where the presence of more rapids, enables oxygen exchange with the environment, increasing its concentration.
-
Pérez and Rodríguez (2008)Índice fisicoquímico de la calidad de agua para el manejo de lagunas tropicales de inundaciónRevista Biología Tropical, 2008
Biological oxygen demand, Abril, Rodríguez, Landázuri and Santi (2014), in studies carried out between March and May 2012 in the dam of Shell, values between 2 to 16 mg/l with an average of 9.3 mg/l ml were shown. This indicates that under the conditions of the year 2015, the presence of treatment systems have an impact on mitigating the concentrations of this parameter reporting in this period all the values within the permissible limits.
-
Abril, Rodríguez, Landázuri and Santi (2014)Impactos ambientales generados por el dique del río Pindo en Shell cantón MeraRevista Amazónica de Ciencia y Tecnología, 2014
Abril et al. (2014) in studies conducted between March and May 2012 in the dam of Shell, total coliform values between 800 to 1 000 000 cfu/100 ml were displayed, with an average of 257 000 cfu/100 ml. This shows that under the conditions of the period evaluated, the presence of treatment systems influences the decrease of the high concentrations of this parameter at this point. From this point on, the main course exceeds the permissible limits in the urban and low areas. However, in the samplings that had the highest precipitation (March and April 2015), a tendency to decrease in the lower areas has been identified. Regarding fecal coliforms, the same study shows values between 110 to 900 000 cfu/100 ml with an average of 228 078 cfu/100 ml and indicates that under the conditions of the year 2015, the presence of treatment systems significantly influences the reduction of the high concentrations of this parameter at this point. This also indicates that the treatment systems eliminate a significant load of fecal coliforms, being their removal greater in proportion to the one obtained in total coliforms.
-
Abril et al. (2014)Impactos ambientales generados por el dique del río Pindo en Shell cantón MeraRevista Amazónica de Ciencia y Tecnología, 2014
Marques et al. (2012) show samplings in areas before and after the water damming in the Antas river in Brazil, where the concentration of biological and chemical oxygen demands decrease in areas after the damming, while total and faecal coliform concentrations increase. This can be observed between Shell and Camal dams.
-
Marques et al. (2012)Water quality in the lotic area of the Antas River before and after the construction of the Monte Claro hydroelectric plant, south BrazilActa Limnologica Brasiliensia, 2012
Torres, González Rustrián and Houbron (2013), monitoring processes carried out in the Seco River (Mexico) with an extension of 70 km, a basin area of 438 km2 and rainfall throughout the rainy season of 1 426 mm and 171 mm in dry seasons. The main characteristics in its upper part are slopes of 15 % in the first sampling point and 3 % in the rest of the basin. This shows the lowest concentrations of chemical oxygen demand in the first monitoring point. The same can be observed in the present study in the highest part of the basin where its area is 350 km2 and the length of the course is 40 km, despite presenting higher rainfall.
-
Torres, González Rustrián and Houbron (2013)Enfoque de cuenca para la identificación de fuentes de contaminación y evaluación de la calidad de un río, Veracruz, MéxicoRevista Internacional de Contaminación Ambiental, 2013
In the lower area, the use of latrines and the presence of cattle, pigs and poultry farms are factors that contribute loads of fecal matter to the river. It is necessary to mention that the presence of these bacteria does not necessarily represent the existence of human fecal contamination since they are also found in the soil and vegetation. Romero et al., (2008).
It is observed that the concentrations: BOD5 (Whipple, Hunter, & Yu, 1974), and fecal coliforms (Johnston, Detenbeck, & Gerald, 1990) are greater in urban areas where there is a larger population, which is related to what was cited by Rörig et al. (2007).
-
Whipple, Hunter, & Yu, 1974Unrecorded Pollution from Urban RunoffJournal Water Pollution Control Federation, 1974
-
Johnston, Detenbeck, & Gerald, 1990The cumulative effect of wetlands on stream water quality and quantity, a landscape approachBiogeochemistry, 1990
-
Rörig et al. (2007)From a water resource to a point pollution source: The daily journey of a coastal urban streamBrazilian Journal of Biology, 2007
In the correlation of variables with the precipitation on the sampling day, only the total coliform concentration showed significant correlations at 0.01, in the upper part. If we apply the hydrological criterion of the concentration time which expresses the travel time of a water flow between two spots in a basin, through the Kirpich formula (Gaspari, Rodríguez, Senisterra, Delgado, & Besteiro, 2013), the Fatima Dam spot presents a time of 1.9 hours and the Pindo Mirador Biological Station 1 hour. This justifies that these points located in the upper part present significant correlation influences regarding the precipitation of the sampling day when receiving contributions of flows generated by rainfall in previous hours.
-
Gaspari, Rodríguez, Senisterra, Delgado, & Besteiro, 2013Elementos metodológicos para el manejo de cuencas hidrográficas, 2013
Conclusions
The topography, land use, and the presence of populations have an influence on the characteristics of the concentrations of the parameters oxygen saturation, COD, BOD5, total and faecal coliforms in the main body and tributaries.
In the main body, the concentrations of total and faecal coliforms increase exponentially from the urban area. This is reflected in their averages, exceeding 10 000 NMP / 100ml in both measures, as they have greater contributions of disposed wastewater in the sewage system and subsequently discharged into the water course. This exceeds the limit established in the regulations. This trend is not observed in tributaries.
The coefficients of variation indicate that the variables concentration of total and faecal coliforms report greater variability with ranges from 100.6 to 274 in total coliforms and from 88.1 to 250.9 in faecal coliforms for the monitoring spots. In addition, the pH is the one that reports lower coefficients of variation.
The behavior of the parameters studied in this research is different in the main course of the river and its tributaries, as well as between the different areas evaluated.
In the main course, the concentrations of total and faecal coliforms increase in the urban area having higher contributions of wastewater disposed in the sewage system and subsequently discharged in the water course. Also, these parameters exceed the limits established in Ecuadorian legislation.
The correlation analysis shows that the BOD variable has the highest number of relationships with the rest of the variables. In addition, the precipitation on the sampling and previous day, shows a relationship with the concentration of total coliforms in the upper area.
The analysis of variance showed differences in conductivity and tributaries (p ≤ 0.05) giving as a result lower values in the lower area (47.97 uS/cm2). Fecal coliforms concentrations in the tributaries and total coliforms in the main course showed the highest values in the lower zone.
The population and type of disposal given to the wastewater are the main contribution that influences the concentrations of BOD, COD, total and faecal coliforms because in urban and low areas more than 70 % of the waste lands in the sewer and river. Only in the area bordering the Shell Dam, one can find treatment plants, which is also observed in the analysis of variance for this variable, generating a cumulative effect towards the low area where the highest concentration is reported with an average of 48 833.3 NMP / 100 ml.
The agricultural and livestock work is carried out mainly in the low-rural area. According to the analysis of variance, higher concentrations of fecal coliforms are reported with an average of 1 026 NMP/100 ml.
In conclusion, the areas located in the upper part should focus on strategies for the preservation of forests. The areas in the urban area should work on the treatment of domestic and downstream wastewater. Finally, the lower areas should focus on the agricultural activities and the treatment of domestic wastewater.
Acknowledgments
I would like to thank the Provincial Autonomous Decentralized Government of Pastaza and the Amazon State University for their support provided during the development of this research.
Referencias
- Abril, R. V., Rodríguez, L. M., Landázuri, A. R., & Santi, G. J. (2014). Impactos ambientales generados por el dique del río Pindo en Shell cantón Mera. Revista Amazónica de Ciencia y Tecnología, 3(3), 258-283. Links
- Abril, R. V., Ruiz, T. E., Alonso, J., Torres, V., & Cabrera, G. (2016). Prospección de especies vegetales en la provincia de Pastaza, Ecuador. Cuban Journal of Agricultural Science, 50(4), 649-671. Links
- AWWA Staff. (2010). Water Quality (4th ed.). Denver, USA: American Water Works Association. Links
- Di-Rienzo, J., Casanoves, F., Balzarini, M., Gonzalez, L., Tablada, M., & Robledo, C. (2014). INFOSTAT vers. 2014. Recuperado de http://www.infostat.com.ar Links
- Fernández, P., & Díaz, P. (2001). Relación entre variables cuantitativas. Unidad de Epidemiología Clínica y Bioestadística. Cuadernos de Atención Primaria, 4, 141-144. Recuperado de https://www.fisterra.com/mbe/investiga/var_cuantitativas /var_cuantitativas2.pdf [Citado 2016 julio] Links
- Gaspari, F., Rodríguez, A., Senisterra, G., Delgado, M., & Besteiro, S. (2013). Elementos metodológicos para el manejo de cuencas hidrográficas. Buenos Aires, Argentina: Editorial de la Universidad de La Plata. Links
- GADPR Tarqui, Gobierno Autónomo Descentralizado Parroquial Rural de Tarqui. (2014). Diagnóstico de la parroquia Tarqui. Recuperado de http://app.sni.gob.ec/sni-link/sni/PORTAL_SNI/data_sigad_plus/sigadplusdiagnostico/1660012260001_DIAGNOSTICO TARQUI 2015_15-05-2015_18-28-31.pdf Links
- GADPR Shell, Gobierno Autónomo Descentralizado Parroquial Rural de Shell. (2015). Actualización del plan de ordenamiento y desarrollo territorial de la parroquia Shell. Recuperado de http://app.sni.gob.ec/sni-link/sni/PORTAL_SNI/data_sigad_plus/sigadplusdiagnostico/1660012930001_DIAGNOSTICO PD y OT SHELL 2015_15-05-2015_15-07-49.pdf Links
- GADPR Fátima, Gobierno Autónomo Descentralizado Parroquial Rural de Fátima. (2015). Plan de ordenamiento y desarrollo territorial de la parroquia Fátima. Recuperado de http://app.sni.gob.ec/snilink/sni/PORTAL_SNI/data_sigad_plus/sigadplusdocumentofinal/1660011020001_FaPDOT_GAD%20Parroquia2015_30-10-2015_15-22-13.pdf Links
- GADPR Veracruz, Gobierno Autónomo Descentralizado Parroquial Rural de Veracruz. (2014). Plan de ordenamiento y desarrollo territorial de la parroquia Veracruz. Recuperado de http://app.sni.gob.ec/sni-link/sni/PORTAL_SNI/data_sigad_plus/sigadplusdiagnos tico/1660011370001DIAGNOSTICO%20PARROQUIA%20VERACRUZ_14-05-2015_19-43-37.pdf Links
- GADPR Pomona, Gobierno Autónomo Descentralizado Parroquial Rural de Pomona. (2015). Plan de ordenamiento y desarrollo territorial de la parroquia Pomona. Recuperado de http://app.sni.gob.ec/sni-link/sni/PORTAL_SNI/data_sigad_plus/sigadplusdiagnostico/1660008740001_PDYOT%20POMONA%202020_15-05-2015_23-46-25.pdf Links
- GADPR Madre Tierra, Gobierno Autónomo Descentralizado Parroquial Rural de Madre Tierra. (2015). Plan de ordenamiento y desarrollo territorial de la parroquia Madre Tierra. Recuperado de http://app.sni.gob.ec/sni-link/sni/PORTAL_SNI/data_sigad_plus/sigadplusdocumentofinal/1660012420001_PLANF_29-10-2015_20-36-28.pdf Links
- HACH. (2014). Oxygen Demand, Chemical (Method 8000) (9nd ed.). Recuperado de www.hach.com/asset-get.download-en.jsa?id=7639983817 Links
- Herrera, M. (2013). Métodos estadísticos alternativos de análisis con variables discretas y categóricas en investigaciones agropecuarias (PhD. Thesis). Instituto de Ciencia Animal, Mayabeque, Universidad Agraria de la Habana. Links
- IBM, International Business Machine. (2013). SPSS Statistic. Vers 22. Armonk, USA: International Business Machine. Links
- Instituto Nacional de Estadísticas y Censos. (2010). Resultados del censo 2010. Recuperado de http://www.ecuadorencifras.gob.ec/wp-content/descargas/Manu-lateral/Resultados-provinciales/pastaza.pdf Links
- Jadhav, H. V., & Purohit, S. H. (eds). (2008). Global pollution and environmental monitoring. Mumbai, India: Himalaya Publishinh House. Links
- Johnston, C. A., Detenbeck, N. E., & Gerald, J. N. (1990). The cumulative effect of wetlands on stream water quality and quantity, a landscape approach. Biogeochemistry, 10(2), 105-141. DOI: 10.1007/BF00002226 Links
- Martínez, E. (2005). Hidrología práctica (2ª ed.). Madrid, España: Colegio de Ingenieros de Caminos, Canales y Puertos. Links
- Marques, A., Marques, L., Albertoni, E., & Palma-Da-Silva, C. (2012). Water quality in the lotic area of the Antas River before and after the construction of the Monte Claro hydroelectric plant, south Brazil. Acta Limnologica Brasiliensia, 24(3), 314-325. Recuperado de Links
- Ministerio del Ambiente del Ecuador. (2015). Texto Unificado de Legislación Ambiental Secundaria (TULSMA). Fuente§ Libro VI Anexo 1. Registro O ficial Edición Especial Nº 316 lunes 4 de mayo de 2015. Links
- Morales, P. (2011). Tamaño de da muestra. Recuperado de http://www.Upcomillas.Es/Personal/Peter/Investigacion/Tama%F1omuestra.Pdf Links
- Pérez, A. G., & Rodríguez, A. (2008). Índice fisicoquímico de la calidad de agua para el manejo de lagunas tropicales de inundación. Revista Biología Tropical, 56(4), 1905-1918. Links
- Rice, E., Baird, R., Eaton, A., & Clesceri, L. (2012). Standard methods for the examination of water and wastewater (22nd ed.). Washington, DC, USA: American Public Health Association, American Water Works Association. Links
- Ritcher, B. D., Mathews, R., Harrison, D. L., & Wigington, R. (2003). Ecologically sustainable water management. Ecological Aplications. 13, 206-224. DOI: 10.1890/1051-0761(2003)013[0206:ESWMMR]2.0.CO;2 Links
- Romero, N. C., Chaile, A. P., & Amoroso, M. J. (2010). Bacteriología e hidroquímica de ríos de montaña, Tucumán. AUGMDOMUS, 2, 16-26. Recuperado de http://www.revistas.unlp.edu.ar/domus/article/viewFile/128/158 Links
- Rörig, L. R., Tundisi, J. G., Schettini, C. A., Pereira-Filho, J., Menezes, J. T., Almeida, T. C., Urban, S. R., Radetski, C. M., Sperb, R. C., Stramosk, C. A., Macedo, R. S., Castro-Silva, M. A., & Perez, J. A. (2007). From a water resource to a point pollution source: The daily journey of a coastal urban stream. Brazilian Journal of Biology, 67(4), 597-609. Links
- Torres, B., González, G., Rustrián, E., & Houbron, E. (2013). Enfoque de cuenca para la identificación de fuentes de contaminación y evaluación de la calidad de un río, Veracruz, México. Revista Internacional de Contaminación Ambiental, 29(3), 135-146. Links
- Whipple, W., Hunter, J., & Yu, S. (1974). Unrecorded Pollution from Urban Runoff. Journal Water Pollution Control Federation, 46(5), 873-885. Recuperado de www.jstor.org/stable/25038730 Links