


Servicios Personalizados
Revista
Articulo
 texto en
  Inglés (pdf)
 Artículo en XML
 Referencias del artículo
 Enviar artículo por email
Indicadores
-
 Citado por SciELO
 -
 Accesos
Links relacionados
-
 Similares en
SciELO
Similares en
SciELO
Compartir

 Permalink
Tecnología y ciencias del agua
versión On-line ISSN 2007-2422
Tecnol. cienc. agua vol.12 no.2 Jiutepec mar./abr. 2021 Epub 26-Jun-2025
https://doi.org/10.24850/j-tyca-2021-02-11
Articles
Evapotranspiration and energy exchange in a temperate forest in Mexico
1
 http://orcid.org/0000-0003-2162-6726
2
http://orcid.org/0000-0002-9550-2825
3
http://orcid.org/0000-0003-4746-573X
4
http://orcid.org/0000-0002-9475-5716
1Colegio de Postgraduados, Texcoco, México, hidalgo.melissa@colpos.mx
2Colegio de Postgraduados, Texcoco, México, gangeles@colpos.mx
3Instituto Tecnológico de Sonora, Cd. Obregón, México, yepezglz@gmail.com
4Colegio de Postgraduados, Texcoco, México, fplascen@colpos.mx
5Instituto Nacional de Investigaciones Forestales, Agrícolas y Pecuarias, Ojuelos de Jalisco, México, josuedlb@gmail.com
6Colegio de Postgraduados, Texcoco, México, teresa.gonzalez@colpos.mx
In forest ecosystems the energy balance, the water cycle and the carbon cycle are linked through the evapotranspiration process. Evapotranspiration is highly variable in space and time since it is controlled by numerous biophysical factors. The objective of this study was to analyze the seasonal variability of evapotranspiration and identify the main factors that influence this process. The eddy covariance technique was used to measure fluxes of sensible heat and latent heat (equivalent to evapotranspiration) in a temperate forest under forest management, located in the region of Zacualtipán, Hidalgo, Mexico. Simultaneously, net radiation, ground heat flux, soil moisture content and other meteorological parameters were measured. During the analyzed period, the proportion of the net radiation with the latent heat and sensible heat fluxes was similar most of the time. The total observed annual evapotranspiration was 980 mm. It was lower in the “cold front” season and no differences were found between the rainy season and the dry season. Temperature, soil moisture, net radiation and vapor pressure deficit explained most of the variability of the evapotranspiration. Further studies are necessary to involve the analysis of ecosystem productivity and water use efficiency, to better understand ecosystem processes and identify appropriate sustainable forest management practices.
Keywords: Energy balance; temperate forest; latent heat; eddy covariance; seasonal variation; Pinus patula
En los ecosistemas forestales, el balance de energía, el ciclo del agua y el ciclo del carbono se vinculan a través del proceso de evapotranspiración. La evapotranspiración es altamente variable en espacio y tiempo, y está controlada por numerosos factores biofísicos. El objetivo de este estudio fue analizar la variabilidad estacional de la evapotranspiración e identificar los principales factores que influyen en dicho proceso. El método de eddy covariance se utilizó para medir los flujos de calor sensible y calor latente (equivalente a evapotranspiración) en un bosque bajo manejo forestal, ubicado en la región forestal de Zacualtipán, Hidalgo. Simultáneamente se midió la radiación neta, el flujo de calor del suelo, el contenido de agua en el suelo y otros parámetros meteorológicos. A lo largo del periodo analizado, la proporción de la radiación neta con los flujos de calor latente y calor sensible fue similar la mayor parte del tiempo. La evapotranspiración total anual observada fue de 980 mm. Ésta fue menor en el periodo de “nortes" y no se encontraron diferencias significativas entre el periodo de lluvias y el de secas. La temperatura, humedad del suelo, radiación neta y déficit de presión de vapor explicaron la mayor parte de la variabilidad de la evapotranspiración. Se recomienda realizar estudios posteriores que involucren el análisis de la productividad del ecosistema y eficiencia en el uso del agua, para comprender mejor los procesos del ecosistema e identificar prácticas apropiadas para el manejo forestal sostenible.
Palabras clave: balance de energía; bosque templado; calor latente; covarianza de vórtices; variación estacional; Pinus patula
Introduction
Forests play an important role in the water and energy balance of the earth's surface (Dolman, Moors, Grundwald, & Bernhofer, 2003; Matsumoto et al., 2008), since they influence the components of the hydrological cycle and have the ability to capture and redistribute solar energy (Ellison et al., 2017). Of the solar energy that reaches the earth's surface, a part is reflected back into the atmosphere, the rest remains available to drive ecosystem´s natural processes, and it is known as net radiation (Huryna & Pokorný, 2016). Net radiation is partitioned into sensible heat flux, ground heat flux, and latent heat flux. The latter provides the energy for the evapotranspiration process (Bonan, 2016).
Evapotranspiration is the sum of water vapor released by the soil and vegetation, into the atmosphere (Law et al., 2002; Biederman et al., 2016). Much of this process is directly associated with the productivity of the ecosystem, since the assimilation of CO2, during photosynthesis and transpiration, is regulated by the dynamics of opening and closing of the stomata (Canny, 1998). In forests, evapotranspiration is comprised of soil evaporation, canopy interception, and plant transpiration (Sun, Domec, & Amatya, 2016).
Evapotranspiration varies with climate, vegetation type, plants phenological stage and it is directly affected by land management strategies and climate change (Liu & El-Kassaby, 2018). Therefore, changes in land cover and climate factors directly affect the regional hydrological cycle, energy balance, and ecosystem functions, including evapotranspiration (Liu et al., 2018).
The management of forest resources in Mexico has been aimed at developing silvicultural practices that allow maximizing wood production (Perez-Verdin, Monarrez-González, Tecle, y Pompa-Garcia, 2018). These practices improve the productivity of ecosystems and contribute to the reduction of greenhouse gas emissions (Ussiri & Lal, 2017). However, several studies have reported that the implementation of these activities cause a negative impact on the regulation of water fluxes (Monarrez-González, Perez-Verdin, López-González, Márquez-Linarez, & González-Elizondo, 2018).
Despite the importance of understanding forest evapotranspiration process, direct measurements at the landscape scale have only been possible in the last two decades (Baldocchi, 2019; Wilson & Baldocchi, 2000) and in recent years in the case of Mexico (Delgado-Balbuena et al., 2019). Generally, evapotranspiration estimates in forest ecosystems have been derived as a residual from the water balance (Özhan, Gökbulak, Serengil, & Özcan, 2010). It is also common for evapotranspiration to be considered a proportion of potential evapotranspiration; and therefore it is calculated from meteorological information obtained at fixed stations with numerous direct, theoretical and empirical methods (García, Campos, Di Bella, & Posse, 2008). These approaches tend to be relatively inexpensive; however, the derived evapotranspiration estimates have limited ability to inform biophysical controls on short time scales. Currently, there are other more sophisticated and more accurate methods, which are based on the analysis of turbulent fluxes to determine actual evapotranspiration (García et al., 2008). Among these methods the eddy covariance technique provides direct and continuous measurements of energy and water vapor exchange between an ecosystem and the atmosphere (Baldocchi, 2003; Aubinet, Vesala, & Papale, 2012).
At a global scale, several studies that have used this method report that the distribution of energy and evapotranspiration show seasonal variations (Mo, Liu, Chen, y Hu, 2018; Sanwangsri, Hanpattanakit, & Chidthaisong, 2017; Tsuruta, Kosugi, Takanashi, & Tani, 2016); interannual variations (Miyazaki et al., 2014), and among forest ecosystems (Brümmer et al., 2012; Cristiano et al., 2015; Sun, Zou, Wilcox, & Stebler, 2018). In Mexico, the studies on the exchange of water and energy between terrestrial ecosystems and the atmosphere are still limited. Most of them are focused on grasslands and shrublands and tropical deciduous forests in the arid and semi-arid zones of the country (Martínez-Yrízar, Álvarez-Sánchez, & Maass, 2017). Such studies have focused on trying to understand the influence of precipitation (Pérez-Ruiz et al., 2010); topographic factors (Berry, Gotsch, Holwerda, Muñoz-Villers, & Asbjornsen, 2016); vegetation cover (Holwerda, Alvarado-Barrientos, & González-Martínez, 2016), and the role of fog (Alvarado-Barrientos, Holwerda, Asbjornsen, Dawson, & Bruijnzeel, 2014) on hydrological dynamics and energy exchange. In the case of temperate forests, this study is the first report in Mexico of energy exchange and evapotranspiration, based on continuous measurements of turbulent fluxes. Understanding the variability of these processes and their main control mechanisms will provide a solid foundation to address the challenges of climate change and the effects of forest management actions. The objectives of our study were: (i) to estimate the energy exchange and evapotranspiration in a forest under forest management with the eddy covariance method, (ii) to determine the meteorological variables that control evapotranspiration, and (iii) to analyze the seasonal variability of water and energy fluxes in a temperate forest in central Mexico.
Materials y methods
Study site
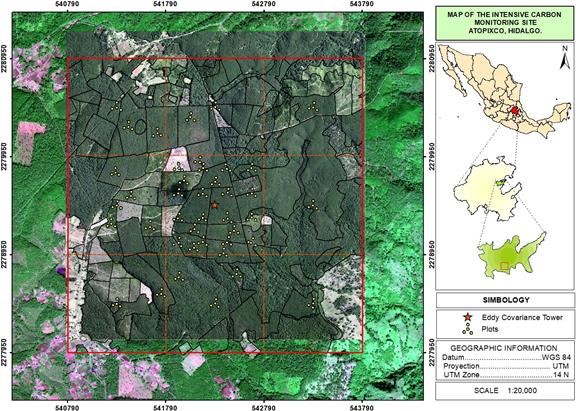
The study site is located at the Intensive Carbon Monitoring Site Atopixco (20 ° 37 '49.78 ”N and 98 ° 37' 51.01” W and 20 ° 35 '18.74 ”N and 98 ° 35' 23” W), at the forest region of Zacualtipán, Hidalgo (Figure 1). It is a temperate forest under forest management for timber production since 1980. The silvicultural development method with the regeneration of seed tree method is used at this site, which has allowed the generation of evenage stands dominated by Pinus patula Schltdl. et Cham. Also, part of the forest structure are species such as: Quercus laurina Humb. et Bonpl, Quercus rugosa Neé, Quercus excelsa Liebm, Clethra mexicana D.C., and Vaccinium leucanthum Schltdl at low densities (Ángeles-Pérez et al., 2015).
The predominant climate of the region is temperate-humid, with a marked rainy season between June and October (1 200-1 600 mm annually); and mean annual temperature that ranges between 12.5 and 14.5 ⁰C (Soriano-Luna et al., 2018). Because it is located in one of the highest parts of the Sierra Madre Oriental (2075 masl) (Ángeles-Pérez et al., 2015), this ecosystem is directly exposed to the humid winds from the Gulf of Mexico and to the entry of cold fronts ("Nortes") that dominate during the winter season. The soil types are feozem haplic (Hh), deep and rich in organic matter (Aguirre-Salado et al., 2009).
The Intensive Carbon Monitoring Site was established according to the methodology proposed by Hollinger (2008). The design consisted of a 3 × 3 km polygon, divided into 9 quadrants of 1km2 each, with permanent sampling plots similar to those used by the National Forestry Commission (Conafor, 2012) in the National Forest and Soil´s Inventory. In the center of the polygon an eddy covariance flux tower was instrumented to measure the exchange of energy and water vapor between the ecosystem and the atmosphere (Figure 1).
Eddy covariance system and weather sensors
The eddy covariance system was installed in a tower, 32 m above ground level. An open-path infrared gas analyzer (IRGA, model LI-7500A, LI-COR, Lincoln, NE, USA) was used to measure the water vapor concentration; and a three-dimensional sonic anemometer (Gill Windmaster Pro) to measure wind speed (m / s) in its three components x, y, z. Both instruments took measurements at a frequency of 10 Hz and the data was recorded on a controller and storage interface (LI-7550, Li-COR, Lincoln, NE, USA).
Simultaneously, meteorological variables were measured: air temperature and relative humidity at 31m above the ground (Vaisala HUMICAP sensor); global radiation, net radiation and photosynthetically active radiation at a height of 33 m (pyranometer LI-COR LI-200, net radiometer CNR4 Kip & Zonen and quantum sensor LI-COR LI-190R, respectively) and precipitation above the canopy (TR-525Mrain rain gauge).
To measure soil temperature, 2 thermocouples (TCAV Campbell Scientific) were installed 5 cm below the ground surface. The water content in the soil was measured with two reflectometers (CS616 Campbell Scientific). ground heat flux was measured at four points with ground heat flux plates (HFP01 Campbell Scientific) buried 7 cm from the ground surface.
Meteorological information and the soil conditions were stored in 30 minute intervals on a CR3000 data logger (Campbell Scientific). The data collection period was from October 1, 2017 to September 30, 2018.
Data processing
The collected data were processed in the Eddy Pro software version 6.2.0 (LI-COR, Inc., 2016). To calculate sensible and latent heat fluxes, in periods of 30 minutes, through the covariance of the wind speed, with the water vapor concentration, and the sonic temperature, respectively (Burba, 2013).
The procedure included the removal of peaks from the time series (Vickers & Mahrt, 1997), correction “W-boost” of the calculation error of the anemometer that underestimates the vertical speed of the wind; tilt correction with the double coordinate rotation method (Wilczak, Oncley, & Stage, 2001); correction of delays between the signals of the gas analyzer and the anemometer; corrections for fluctuations in air density ((Burba, 2013; Webb, Pearman, & Leuning, 1980), and spectral corrections of high and low frequency (Moncrieff, 1997; Moncrieff, 2004). Finally, with the software, the quality control indicators were calculated for all the fluxes based on the test of turbulent and steady-state conditions (Mauder & Foken, 2006). The result of the data processing was a database, which included the value of the intermediate and final variables calculated for each period.
Data quality control
This procedure was performed on the database that resulted from processing in Eddy Pro. The database shows the value of sensible heat fluxes (H), latent heat (LE) and water flux, together with a numerical code (0, 1 or 2) that indicates the quality of the fluxes. The value "0" indicates fluxes of better quality, "1" represents fluxes of good quality, while "2" indicates fluxes of poor quality. The fluxes considered of poor quality were removed from the analysis. Records that were outside the flux magnitude limit and those values that were recorded in periods of intense precipitation were also removed.
Gapfilling
Although the eddy covariance technique allowed the generation of almost continuous measurements over time, there were periods of absence of records caused by system failures and by data exclusion according to data quality control. The data gapfilling is generally done through the correlation of the fluxes with meteorological variables (radiation, temperature or humidity); however, during 27 days distributed throughout the period, there were no records of these variables. Therefore, the estimation of the missing flux data was carried out with the marginal distribution sampling algorithm in REddyProc (Wutzler et al., 2018). This online tool (https://www.bgc-jena.mpg.de/REddyProc/brew/REddyProc.rhtml), in addition to considering the covariance of fluxes with meteorological variables (Falge, Baldocchi, & Olson, 2001) which allowed the temporal autocorrelation of the fluxes (Reichstein et al., 2005). The percentage of data generated in relation to the total was 39 %, of which 12 % corresponded to the daytime period and 27 % to the nighttime period.
Energy balance closure
The evaluation of the energy balance closure is a standardized procedure within the eddy covariance methodology to verify the quality of the measurements. This procedure consisted of plotting the 30-minute values of the sum of the sensible heat fluxes (H) and latent heat (LE) against the difference of the net radiation values (Rn) and the ground heat flux (G). A trend line was fitted where the value of the slope and the intercept of the regression line quantified the reliability of the energy balance closure.
Footprint
The footprint was obtained with the eddy covariance measurements. The analysis was carried out with the Flux Footprint Prediction (FFP) online data processing tool (Kljun, Calanca, Rotach, & Schmid, 2015). In a monthly analysis, it was observed that the footprint remained constant throughout the year.
Data analysis
To identify the environmental controls that influence the variation of evapotranspiration, a Spearman correlation matrix was used. This nonparametric analysis was chosen because the data did not show a normal distribution. The variables used were: net radiation, photosynthetically active radiation, air and soil temperature, relative humidity, vapor pressure deficit, precipitation, and soil water content. Subsequently, a multiple linear regression model was fitted to evaluate the influence that have the predictors described above, on evapotranspiration; the dependent variable was normalized with the Box-Cox transformation. The reliability of the model was evaluated with the adjusted coefficient of determination (R2adj), residual standard error (RSE) and the Akaike Information Criterion (AIC).
The seasonal variation of evapotranspiration was analyzed in three periods: entry of cold fronts (November-February), dry season (March-May) and rainy period (June-October). To determine whether there were statistically significant differences among seasons, the Kruskal-Wallis test was used, followed by a post hoc analysis with the Mann - Whitney - Wilcoxon test to determine which periods differed from each other. The statistical analyzes were carried out with the R software (R Core Team, 2018) version 3.5.0.
Results
Weather conditions
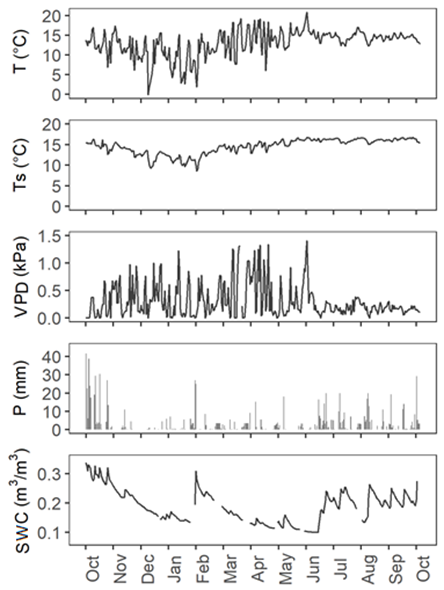
Global radiation, net radiation and photosynthetically active radiation reached their maximum point in May and their minimum in October; in the case of net radiation, the minimum was in December (Table 1). The air temperature ranged from 2 to 20.8 ° C (daily average) and during the months of June to September it remained between 12 and 17 ° C (Figure 2). The minimum air temperature occurred in December and the maximum in May. The soil temperature ranged between 8.5 and 16.8 ° C; in general, it had a similar trend to air temperature. The vapor pressure deficit remained high during the months of March, April and May, so the evaporative demand was higher in this period. We registered precipitation in all months, a total of 953 mm accumulated, which was 20 % lower than that occurred in previous years. Seventy two percent of the total precipitation occurred from June to October, the month of October had the highest contribution (294.9 mm). The water content in the soil varied with precipitation. The intense precipitation events at the end of January caused an abrupt increase in the soil water content for the month of February (Figure 2). The annual precipitation recorded at the study site for the years 2014-2018 was 1255 mm, 812 mm, 1227 mm, 1286 mm, and 751 mm, respectively.
Table 1 Mean monthly values of evapotranspiration and the weather variables during the study period.
| Variable | 2017 | 2018 | ||||||||||
|---|---|---|---|---|---|---|---|---|---|---|---|---|
| Oct | Nov | Dec | Jan | Feb | Mar | Apr | May | Jun | Jul | Aug | Sep | |
| Gr (W/m2) | 136.1 | 175.9 | 156.8 | 144.7 | 171.5 | 201.1 | 210.2 | 229.9 | 175.4 | 215.7 | 180.5 | 164.8 |
| Nr (W/m2) | 99.0 | 115.5 | 95.7 | 99.5 | 121.2 | 144.8 | 151.6 | 164.7 | 128.5 | 159.1 | 126.1 | 130.5 |
| PPFD (µmol/m2/s) | 250.4 | 322.6 | 288.0 | 268.3 | 325.8 | 383.8 | 404.5 | 447.1 | 349.5 | 431.9 | 346.2 | 343.8 |
| T mean (°C) | 12.8 | 11.8 | 10.1 | 7.4 | 12.4 | 13.5 | 14.4 | 15.6 | 15.0 | 14.7 | 14.1 | 14.5 |
| T min (°C) | 3.8 | 1.7 | -4.7 | -0.4 | 6.8 | 4.8 | 3.9 | 9.2 | 10.7 | 9.8 | 10.5 | 10.7 |
| T max (°C) | 21.7 | 21.3 | 20.6 | 21.8 | 21.2 | 24.9 | 25.0 | 26.5 | 20.4 | 23.1 | 18.6 | 19.8 |
| Ts (°C) | 14.8 | 13.8 | 12.1 | 11.0 | 13.3 | 14.3 | 14.9 | 15.9 | 16.2 | 16.1 | 15.9 | 16.3 |
| VPD (kPa) | 0.19 | 0.36 | 0.37 | 0.24 | 0.34 | 0.57 | 0.46 | 0.41 | 0.20 | 0.21 | 0.17 | 0.15 |
| P (mm) | 294.9 | 21.1 | 13.8 | 83.3 | 35.6 | 44.8 | 39.6 | 29.3 | 100.3 | 76.3 | 124.1 | 89.8 |
| SWC (m3/m-3) | 0.29 | 0.22 | 0.16 | 0.16 | 0.22 | 0.16 | 0.13 | 0.12 | 0.16 | 0.21 | 0.21 | 0.22 |
| ET (mm) | 93.3 | 80.0 | 68.5 | 63.5 | 72.4 | 94.0 | 93.0 | 81.7 | 71.1 | 95.5 | 85.3 | 81.9 |
Where Gr = global radiation; Nr = net radiation; PPFD = photosynthetically active radiation; T = air temperature; Ts = soil temperature; VPD = vapor pressure deficit; P = precipitation; SWC = soil water content, and ET = evapotranspiration.
Energy balance
The closure energy balance was 0.81 (Figure 3), which indicates that there is an underestimation of latent or sensible heat fluxes. Despite this, the quality of the flux measurements was sufficient to analyze the energy and evapotranspiration budgets. The energy closure value obtained was similar to those reported by Wilson et al. (2002) on FLUXNET sites globally.
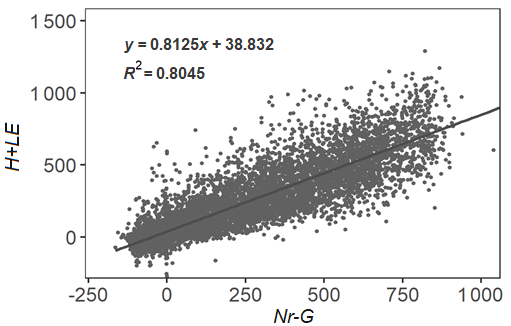
Figure 3 Dispersion of the components of the energy balance. Net radiation (Nr), ground heat (G), sensible heat (H) and latent heat (LE).
The annual course of net radiation, ground heat flux, sensible heat and latent heat, during the study period, is shown in Figure 4. The distribution of available energy (net radiation) as flux of latent heat and sensible heat varied throughout the year, in which we observed three trends. In the months of October 2017, and August and September 2018, when there was more water available, the main form of energy exchange from the surface to the atmosphere was latent heat.
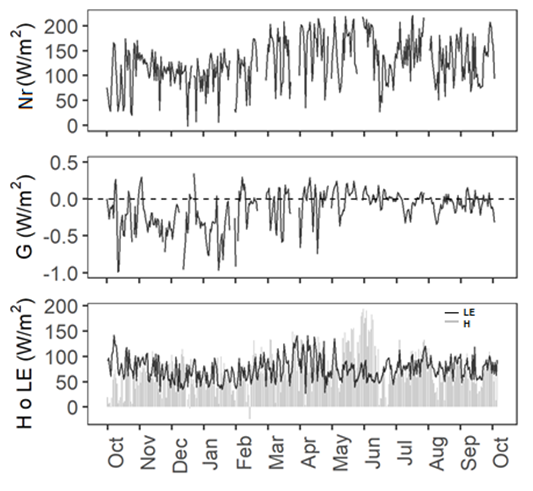
Figure 4 Temporal variation of net radiation (Nr), sensible heat (H), latent heat (LE) and ground heat flux (G).
In the months of May to July, sensible heat flux dominated the energy exchange between the ecosystem and the atmosphere. In the rest of the months, sensible and latent heat fluxes were distributed.
The ground heat flux throughout the period was low. Table 2 shows the monthly mean values of net radiation and the proportions used for each flux.
Table 2 Net radiation and its relative contribution to each flux, in a forest under forest management.
| Month | Nr | LE/Nr | H/Nr | G/Nr | Bowen ratio H/LE |
|---|---|---|---|---|---|
| October | 144.2 | 0.70 | 0.42 | -0.0015 | 0.60 |
| November | 167.5 | 0.55 | 0.53 | -0.0017 | 0.95 |
| December | 135.1 | 0.55 | 0.55 | -0.0019 | 0.99 |
| January | 142.6 | 0.47 | 0.52 | -0.0030 | 1.10 |
| February | 157.6 | 0.51 | 0.53 | -0.0003 | 1.04 |
| March | 165.0 | 0.51 | 0.50 | -0.0008 | 0.98 |
| April | 179.0 | 0.54 | 0.49 | -0.0001 | 0.92 |
| May | 216.4 | 0.40 | 0.67 | 0.0002 | 1.65 |
| June | 162.9 | 0.47 | 0.55 | 0.0002 | 1.16 |
| July | 204.1 | 0.48 | 0.51 | -0.0003 | 1.06 |
| August | 167.3 | 0.54 | 0.47 | -0.0004 | 0.86 |
| September | 179.7 | 0.52 | 0.47 | -0.0001 | 0.90 |
Where Nr = net radiation, LE = latent heat flux, H = sensible heat flux, and G = ground heat flux.
Evapotranspiration
During the study period, evapotranspiration was 980 mm and slightly exceeded annual precipitation (953 mm). Total monthly evapotranspiration was lowest in January (63.5 mm) and the highest was reported in July (95.5 mm) (Table 1). Evapotranspiration rates at different time scales are shown in Table 3. The mean daily evapotranspiration ranged from 2.0 mm ± 0.6 (January) to 3.1 mm ± 1.1 (April and July). The maximum evapotranspiration rate was 0.86 mm h-1 and took place in the month of March. The highest values of maximum daily evapotranspiration corresponded to the months of March, April and May.
Table 3 Evapotranspiration rates per hour and per day in a forest under forest management.
| Month | Max Evapotranspirationper hour (mm h-1) | Mean daily Evapotranspiration (mm day-1 ± SD) | Max daily Evapotranspiration (mm day-1) |
|---|---|---|---|
| October | 0.74 | 3.0 ± 0.9 | 4.4 |
| November | 0.76 | 2.7 ± 0.8 | 3.9 |
| December | 0.76 | 2.2 ± 0.7 | 3.5 |
| January | 0.77 | 2.0 ± 0.6 | 3.5 |
| February | 0.72 | 2.6 ± 0.7 | 3.8 |
| March | 0.86 | 3.0 ± 0.9 | 5.0 |
| April | 0.85 | 3.1 ± 1.1 | 5.0 |
| May | 0.83 | 2.6 ± 0.7 | 4.8 |
| June | 0.70 | 2.4 ± 0.5 | 3.4 |
| July | 0.71 | 3.1 ± 0.6 | 4.4 |
| August | 0.77 | 2.8 ± 0.6 | 3.7 |
| September | 0.82 | 2.7 ± 0.6 | 3.7 |
Evapotranspiration and its response to weather conditions
According to Spearman's correlation analysis (p <0.01), net radiation (0.76) and photosynthetically active radiation (0.73) were the variables that had the highest relationship with evapotranspiration. The correlation was lower, although significant, with air temperature (0.42), relative humidity (-0.27,) and vapor pressure deficit (0.34) (Figure 5). The results of the multiple linear regression analysis showed that evapotranspiration was more influenced by the soil water content, the net radiation, the air temperature, and the vapor pressure deficit (Table 4). To support this result, in Table 1 it can be observed that the highest evapotranspiration values corresponded to the highest average values of net radiation and vapor pressure deficit (March, April and May). The model explained 61 % of the variability of evapotranspiration. According to the F test, the model is significant with a P value <2.2e-16. The correlations between the independent variables used in the model and the value of the variance inflation factor are indications that there is no linear relationship between the independent variables.
Table 4 Summary of the multiple linear regression model.
| Parameter | Coefficient | Std. Error | t | Pr(>|t|) | VIF |
|---|---|---|---|---|---|
| Intercept | -0.3552 | 0.0711 | -4.99 | 9.66e-07 | |
| Nr | 0.0035 | 0.0003 | 11.97 | < 2e-16 | 1.37 |
| T | 0.0316 | 0.0042 | 5.41 | 6.66e-13 | 1.48 |
| VPD | 0.2487 | 0.0460 | 7.49 | 1.25e-07 | 1.47 |
| SWC | 2.2001 | 0.2283 | 9.64 | < 2e-16 | 1.14 |
Where Nr- net radiation, T- air temperature, VPD- water pressure deficit, SWC- soil water content
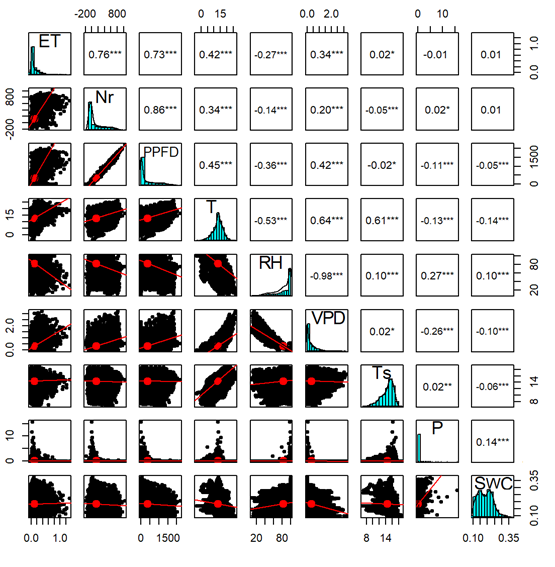
Figure 5 Spearman correlation matrix of evapotranspiration and meteorological variables. ET- Evapotranspiration, Nr- Net Radiation, PPFD- Photosynthetically Active Radiation, T- Air Temperature, RH- Relative Humidity, VPD- Vapor Pressure Deficit, Ts- Soil Temperature, P-Precipitation, SWC- Soil Water Content.
Seasonal variation of evapotranspiration
La prueba de Kruskal - Wallis (p < 0.001) indicó diferencias significativas en la evapotranspiración entre las estaciones. De acuerdo con la prueba de Mann-Whitney-Wilcoxon (p < 0.05), la evapotranspiración en el periodo de “nortes” fue significativamente más baja en comparación con la evapotranspiración de la época de lluvia y de seca, donde no se encontraron diferencias significativas. El mismo análisis se hizo para las variables que resultaron tener mayor influencia en la evapotranspiración. En la Tabla 5 se muestran las variaciones de evapotranspiración y las variables que resultaron tener mayor control sobre la evapotranspiración y se resumen los resultados de las pruebas de comparación.
The Kruskal-Wallis test (p <0.001) indicated significant differences in evapotranspiration among season. According to the Mann-Whitney-Wilcoxon test (p <0.05), evapotranspiration in the "Nortes" period (cold front season) was significantly lower compared to evapotranspiration in the rainy and dry seasons, where no significant differences were found. The same analysis was done for the variables that turned out to have the greatest influence on evapotranspiration. Table 5 shows the variation of evapotranspiration and the variables that resulted in greater control over evapotranspiration. The results of the comparison tests are summarized.
Table 5 Seasonal variation of evapotranspiration and main control factors.
| Variable | Season | ||
|---|---|---|---|
| “Nortes” | Dry | Rainy | |
| ET | 2.4±0.7 (b) | 2.9±0.9 (a) | 2.8±0.7 (a) |
| SWC | 0.19±0.04 (b) | 0.13±0.02 (c) | 0.21±0.06 (a) |
| T | 10.4±3.69 (b) | 14.5±3.15(a) | 14.2±1.54 (a) |
| Nr | 108.5±33.0 (c) | 153.9±49.2 (a) | 127.4±47.6 (b) |
| VPD | 0.33±0.29 (a) | 0.48±0.45 (a) | 0.19±0.13 (b) |
Where ET = evapotranspiration, SWC = soil water content, Ta = air temperature, Rn = net radiation and DPV = vapor pressure deficit. Same letters indicate that there were no significant differences (p <0.05) between the seasons.
Discussion
Energy balance
Forest management and the availability of soil moisture have an important control in the partition of energy (Gholz & Clark, 2002; Sun et al., 2010). In temperate forests, during the growing season, the availability of soil moisture is usually not limiting; therefore, during this period, it is common for the latent heat flux to be higher than the sensible heat (Yan et al., 2017). In this study, only in the months of June, August, September and October did latent heat showed higher values than sensible heat. Several authors relate these two energy variables through the Bowen ratio (H / LE) (Gholz & Clark, 2002; Giambelluca et al., 2009; Tudoroiu et al., 2018).
It was found that for this site the Bowen ratio was lower in October (0.60) and a higher value was obtained for May (1.65) (Table 2). In such month the monthly means of net radiation and maximum air temperature were higher and the soil water content was lower. It is possible that under these conditions the trees are stressed and consequently generate significant changes in the productivity of the ecosystem. However, this will depend on the response and tolerance mechanisms that the plants have developed in such situations (Méndez-Espinoza & Vallejo-Reyna, 2019). Generally, stomatal closure is the main response mechanism to water deficit and high temperatures. If only high temperatures are the problem, the trees will continue transpiring, since its cooling effect it will maintain an adequate leaf surface temperature (Harfouche, Meilan, & Altman, 2014). This is probably the case at the study site, since no differences were found in the evapotranspiration rates of the rainy season and the dry season. It was also found that the ground heat flux was low, which is a common characteristic in soils under an evergreen forest cover, and it is reflected in reduced variations in soil temperature.
Evapotranspiration
The results of this study showed that the evapotranspiration of the forest under forest management was variable during the study period. Annual evapotranspiration (980 mm) was similar to those reported in a Pinus taeda L. forest plantation (1076 ± 104 mm / year) in North Carolina, USA (Sun et al., 2010). In general, these sites showed similar temperature ranges, had no problem in the availability of soil water and the soil had a high organic matter content. According to evaluations of the evapotranspiration rates assumed for temperate forests (710.8 mm mean), these are lower than in those exhibited by tropical forests (1502.2 mm) (Levia, Carlyle-Moses, & Tanaka, 2011). In the case of arid and semi-arid regions, the magnitude of evapotranspiration is much lower than those reported in this study. In this type of ecosystems, one of the main factors that drives the dynamics of evapotranspiration is precipitation and there is also a clear influence of vegetation (Bierderman et al., 2016). In drought conditions the transpiration process is limited by water stress in plants, due to the high demand for atmospheric evaporation and the restricted water content in the soil (Meza, Montes, Bravo-Martínez, Serrano-Ortiz, & Kowalski, 2018).
The processes that control evapotranspiration involve the combined effects of physical and biological factors (Novick et al., 2015) controlled by environmental conditions (Xu et al., 2014). In general, in sites located in medium and high latitudes, net radiation and air temperature are the variables that dominate in the control of evapotranspiration (Chen, Xue, & Hu, 2018). This is because radiation provides the energy available to evaporate water (Izadifar & Elshorbagy, 2010). Furthermore, the capacity of the atmosphere to retain water increases as the air temperature increases (Pan et al., 2015; Wagle et al., 2016). However, when soil moisture is limiting, the vapor pressure deficit increases, which affects the physiological response of plants. Therefore, the vapor pressure deficit becomes more relevant in the control of evapotranspiration (Zha et al., 2013). When the soil moisture is not sufficient, the plant would be expected to close the stomata to avoid excessive water loss (Landsberg & Sands, 2011). But the responses of plants to climatic conditions depend on the species, their life history, and management, therefore, there may be a genetic component in the climatic responses, which causes differential physiological responses to similar stimuli (Qaderi, Martel, & Dixon, 2019). The role of vegetation has been evaluated by monitoring the Leaf Area Index, leaf or canopy conductance, or normalized difference vegetation indices (NDVI) (Cabral, Da-Rocha, Gash, Freitas, & Ligo, 2015; Mo et al., 2018; Yang et al., 2017). But less studies evaluate the effects of environmental factors on the structures responsible for water transport, especially the xylem (Qaderi et al., 2019).
In a plantation dominated by Pinus tabuliformis, in China, low soil water content (0.1 m3 / m3) in combination with net radiation (~ 200W / m2) and high temperatures (~ 25 °), caused a low evapotranspiration (51.7 mm, in the driest month) (Ma et al., 2018). In contrast, here it is reported that the highest evapotranspiration rates (89.5mm / month, on average), occurred in the dry season (Table 1). This suggests that during this period the vegetation did not have restrictions in water supply and that perhaps the conductance of the canopy is not a factor that limits the evapotranspiration process. Moisture availability conditions reduce the sensitivity of canopy conductance to changes in VPD (Liu et al., 2018). Furthermore, climatic variables explained most (61 %) of the evapotranspiration variability. The null problem of water limitation, during the dry season, can be attributed to the ability of trees to access deeper water sources as pointed out by Thompson et al. (2011). Another possibility is that the precipitation events, during the “Nortes” period, provided sufficient humidity to counteract the impacts of the dry season.
The effects of forest management on evapotranspiration were not evaluated. However, a thinning with an intensity of 50 % carried out in a Pinus taeda L. plantation showed small interannual variations in net radiation, and a slight decrease in evapotranspiration. Based on the results, Liu et al. (2018) suggested that the forests were relatively insensitive to management activities, as the rapid growth of the understory and the canopy closure allowed a fast recovery of evapotranspiration rates. The effects of forest management become more noticeable during dry periods in systems with limited water, but tend to decrease as the stand age increases (Sun et al., 2010; Yang et al., 2017).
The findings shown here represent information on the main climatic factors that controlled water exchange in a managed forest. These results were based on continuous monitoring over a year. During this period, precipitation was 20 % lower than that observed of previous years. It may suggest that these variations have caused changes in evapotranspiration. However, Zha et al. (2013) indicated that interannual variations in evapotranspiration tend to be lower in conifer forests (7-14 %) compared to broadleaved deciduous forests, where interannual ranges of ~ 30 % have been reported. In spite of these results, long-term studies are necessary, which also involve other parameters, to clarify and expand the understanding of water exchange processes in Mexican temperate forests.
Conclusions
The greatest partition of net radiation to sensible heat flux was observed in periods where the temperature was higher and the soil water content was low. Latent heat flux was higher than sensible heat mainly during the rainy season.
Evapotranspiration was controlled by soil water content, air temperature, net radiation, and the vapor pressure deficit. Together these factors explained 61 % of the variability of evapotranspiration. Measurement and analysis of other parameters such as leaf area index, canopy conductance, water potential, soil moisture at different depths can clarify and broaden the understanding of this process.
The total evapotranspiration was 980 mm. Minimum evapotranspiration values occurred during the period known as "nortes" in winter season. Despite seasonal changes in net radiation and soil water content, no significant differences were found between evapotranspiration that occurred during the rainy season and the dry season.
The measurements of the exchanged of energy and water vapor reported in this study represent the first continuous observations made in a forest under forest management in Mexico. This information allowed us to characterize the patterns of the distribution of radiation and the evapotranspiration variability.
Acknowledgments
This study was partially funded by the Sustainable Landscapes Program of the Agency for International Development of the United States of America, through the Office of International Programs of the USDA Forest Service, project “Reducing Greehouse Gas Emissions and Improving Forest Management in Mexico” (Agreement No. 12-IJ-11242306-033). It was also funded by the National Council of Science and Technology of Mexico, through the project “The role of forests under community forest management on the climate change mitigation” (PN 2017-6231).
REFERENCES
Aguirre-Salado, C. A., Valdez-Lazalde, J. R., Ángeles-Pérez, G., De Los Santos-Posadas, H. M., Haapanen, R., & Aguirre-Salado, A. I. (2009). Mapping aboveground tree carbon in managed Patula pine forests in Hidalgo, México. Agrociencia, 43, 209-220. [ Links ]
Alvarado-Barrientos, M. S., Holwerda, F., Asbjornsen, H., Dawson, T. E., & Bruijnzeel, L. A. (2014). Suppression of transpiration due to cloud immersion in a seasonally dry Mexican weeping pine plantation. Agricultural and Forest Meteorology, 186, 12-25. DOI: 10.1016/j.agrformet.2013.11.002 [ Links ]
Ángeles-Pérez, G., Méndez-López, B., Valdez-Lazalde, R., Plascencia-Escalante, F. O., De-Los-Santos-Posadas, H. M., Chávez-Aguilar, G., & Maldonado-Montero, V. (2015). Estudio de Caso del Sitio de Monitoreo Intensivo del Carbono en Hidalgo. Montecillo, México: Proyecto México-Noruega-Colegio de Postgraduados. [ Links ]
Aubinet, M., Vesala, T., & Papale, D. (2012). Eddy Covariance: A Practical Guide to Measurement and Data Analysis. DOI: 10.1007/978-94-007-2351-1. New York, USA: Springer. [ Links ]
Baldocchi, D. D. (2003). Assessing the eddy covariance technique for evaluating carbon dioxide exchange rates of ecosystems: Past, present and future. Global Change Biology, 9(4), 479-492. DOI: 10.1046/j.1365-2486.2003.00629.x [ Links ]
Baldocchi, D. D. (2019). How eddy covariance flux measurements have contributed to our understanding of Global Change Biology. Global Change Biology, 26, 242-260. DOI:10.1111/gcb.14807 [ Links ]
Berry, Z. C., Gotsch, S. G., Holwerda, F., Muñoz-Villers, L. E., & Asbjornsen, H. (2016). Slope position influences vegetation-atmosphere interactions in a tropical montane cloud forest. Agricultural and Forest Meteorology, 221, 207-218. DOI: 10.1016/j.agrformet.2016.02.012 [ Links ]
Biederman, J. A., Scott, R. L., Goulden, M. L., Vargas, R., Litvak, M. E., Kolb, T. E., Yepez, E. A., Oechel, W. C., Blanken, P. D., Bell, T. W., Garatuza‐Payan, J., Maurer, G. E., Dore, S., & Burns, S. P. (2016). Terrestrial carbon balance in a drier world: The effects of water availability in southwestern North America. Global Change Biology, 22, 1867-1879. DOI: 10.1111/gcb.13222 [ Links ]
Bonan, G. (2016). Ecological climatology: Concepts and applications. (3rd ed.). Boulder & New York, USA: Center for Atmospheric Research / Cambridge University Press. [ Links ]
Brümmer, C., Black, T. A., Jassal, R. S., Grant, N. J., Spittlehouse, D. L., Chen, B., Nesic. Z., Amiro, B. D., Arain, M. A., Barr, A. Bourqueg, C. P., Coursolle, C., Dunn, A. L., Flanagan, L. B., Humphreysk, E. R., Lafleur, P. M., Margolish, H. A., McCaughey, J. H., & Wofsyn, S. C. (2012). How climate and vegetation type influence evapotranspiration and water use efficiency in Canadian forest, peatland and grassland ecosystems. Agricultural and Forest Meteorology, 153, 14-30. DOI: 10.1016/j.agrformet.2011.04.008 [ Links ]
Burba, G. (2013). Eddy covariance method: For scientific, industrial, agricultural, and regulatory applications. Lincoln, USA: LI-COR Biosciences. [ Links ]
Cabral, O. M. R., Da-Rocha, H. R., Gash, J. H., Freitas, H. C., & Ligo, M. A. V. (2015). Water and energy fluxes from a woodland savanna (cerrado) in southeast Brazil. Journal of Hydrology: Regional Studies, 4(PB), 22-40. DOI: 10.1016/j.ejrh.2015.04.010 [ Links ]
Canny, M. J. (1998). Transporting water in plants that possible by protecting the stretched water and repairing it when it breaks. American Scientist, 86(2), 152-159. [ Links ]
Chen, Y., Xue, Y., & Hu, Y. (2018). How multiple factors control evapotranspiration in North America evergreen needleleaf forests. Science of the Total Environment, 622-623, 1217-1224. DOI: 10.1016/j.scitotenv.2017.12.038 [ Links ]
Conafor, Comisión Nacional Forestal. (2012). Manual y procedimientos para el muestreo de campo. En: Inventario nacional forestal y de suelos. México, DF, México: Comisión Nacional Forestal. [ Links ]
Cristiano, P. M., Campanello, P. I., Bucci, S. J., Rodriguez, S. A., Lezcano, O. A., Scholz, F. G., Madanes, N., Di Francescantonio, D., Carrasco, L. O., Zhang, Y. J., & Goldstein, G. (2015). Evapotranspiration of subtropical forests and tree plantations: A comparative analysis at different temporal and spatial scales. Agricultural and Forest Meteorology, 203, 96-106. DOI: 10.1016/j.agrformet.2015.01.007 [ Links ]
Delgado-Balbuena J., Yépez, E. A., Paz-Pellat, F., Ángeles-Pérez, G., Alvarado-Barrientos, M. S., Bullock, S. H., … & Watts, C. J. (2019). Flujos verticales de carbono en ecosistemas terrestres. En: Paz-Pellat, F., Hernández-Ayon, J. M., Sosa-Avalos, R., & Velázquez-Rodríguez, A. S. (eds.). Estado del ciclo del carbono en México Agenda Azul y Verde (pp. 605-625). Texcoco, México: Programa Mexicano del Carbono. [ Links ]
Dolman, A. J., Moors, E. J., Grundwald, P. B., & Bernhofer, C. (2003). Factors controlling forest atmosphere exchange of water, energy, and carbon. In: Valentini, R. (ed.). Fluxes of carbon, water and energy of European forests. Ecological studies (analysis and synthesis) (pp. 207-224). Berlin & Heidelberg, Germany: Springer. DOI: 10.1007/978-3-662-05171-9_6 [ Links ]
Ellison, D., Morris, C. E., Locatelli, B., Sheil, D., Cohen, J., Murdiyarso, D., & Sullivan, C. A. (2017). Trees, forests and water: Cool insights for a hot world. Global Environmental Change, 43, 51-61. DOI: 10.1016/j.gloenvcha.2017.01.002 [ Links ]
Falge, E., Baldocchi, D. D., & Olson, R. (2001). Gap filling strategies for defensible annual sums of net ecosystem exchange. Agricultural and Forest Meteorology , 107, 43-69. DOI: 10.1016/S0168-1923(00)00225-2 [ Links ]
García, A. G., Campos, A. N., Di Bella, C. M., & Posse, G. (2008). Evolución de la evapotranspiración en diferentes coberturas vegetales de la Argentina utilizando productos derivados del sensor MODIS. Buenos Aires, Argentina: Instituto Nacional de Tecnología Agropecuaria. [ Links ]
Gholz, H. L., & Clark, K. L. (2002). Energy exchange across a chronosequence of slash pine forests in Florida. Agricultural and Forest Meteorology , 112(2), 87-102. DOI: 10.1016/S0168-1923(02)00059-X [ Links ]
Giambelluca, T. W., Martin, R. E., Asner, G. P., Huang, M., Mudd, R. G., Nullet, M. A., & Foote, D. (2009). Evapotranspiration and energy balance of native wet montane cloud forest in Hawai’i. Agricultural and Forest Meteorology , 149(2), 230-243. DOI: 10.1016/j.agrformet.2008.08.004 [ Links ]
Harfouche, A., Meilan, R., & Altman, A. (2014). Molecular and physiological responses to abiotic stress in forest trees and their relevance to tree improvement. Tree Physiology, 34, 1181-1198. DOI: 10.1093/treephys/tpu012. [ Links ]
Hollinger, D. Y. (2008). Defining a landscape-scale monitoring tier for the North American Carbon Program. In: Hoover, C. M. (ed.). Field Measurements for Forest Carbon Monitoring (pp. 3-16). Durham, USA. DOI: 10.1007/978-1-4020-8506-2_1 [ Links ]
Holwerda, F., Alvarado-Barrientos, M. S., & González-Martínez, T. M. (2016). Surface energy exchange in a tropical montane cloud forest environment: Flux partitioning, and seasonal and land cover-related variations. Agricultural and Forest Meteorology , 228-229, 13-28. DOI: 10.1016/j.agrformet.2016.06.011 [ Links ]
Huryna, H., & Pokorný, J. (2016). The role of water and vegetation in the distribution of solar energy and local climate: A review. Folia Geobot, 51(3), 191-208. DOI: 10.1007/s12224-016-9261-0 [ Links ]
Izadifar, Z., & Elshorbagy, A. (2010). Prediction of hourly actual evapotranspiration using neural networks, genetic programming, and statistical models. Hydrological Processes, 24(23), 3413-3425. DOI: 10.1002/hyp.7771 [ Links ]
Kljun, N., Calanca, P., Rotach, M. W., & Schmid, H. P. (2015). A simple two-dimensional parameterisation for Flux Footprint Prediction (FFP). Geoscientific Model Development, 8, 3695-3713. DOI: 10.5194/gmd-8-3695-2015 [ Links ]
Landsberg, J., & Sands, P. (2011). Physiological Ecology of Forest Production. USA. DOI: 10.1016/S1936-7961(11)04007-3 [ Links ]
Law, B. E., Falge, E., Gu, L., Baldocchi, D. D., Bakwin, P., Berbigier, P., & Wofsy, S. (2002). Environmental controls over carbon dioxide and water vapor exchange of terrestrial vegetation. Agriculture and Forest Meteorology, 113(113), 97-120. [ Links ]
Levia, D. F., Carlyle-Moses, D., & Tanaka, T. (2011). Forest hydrology and biogeochemistry: Synthesis of past research and future directions. Analysis and synthesis, (216), 407-423. DOI: 10.1007/978-94-007-1363-5 [ Links ]
LI-COR, Inc. (2016). EddyPro® Software (Version 6.2). Recuperado de https://www.licor.com/env/support/EddyPro/software.html [ Links ]
Liu, X., Sun, G., Mitra, B., Noormets, A., Gavazzi, M. J., Domec, J., & Mcnulty, S. G. (2018). Drought and thinning have limited impacts on evapotranspiration in a managed pine plantation on the southeastern United States coastal plain. Agricultural and Forest Meteorology , 262, 14-23. DOI: 10.1016/j.agrformet.2018.06.025 [ Links ]
Liu, Y., & El-Kassaby, Y. A. (2018). Evapotranspiration and favorable growing degree-days are key to tree height growth and ecosystem functioning: Meta-analyses of Pacific Northwest historical data. Nature, 8228(8), 1-12. DOI: 10.1038/s41598-018-26681-1 [ Links ]
Ma, J., Zha, T., Jia, X., Tian, Y., Bourque, C. P. A., Liu, P., & Chen, W. (2018). Energy and water vapor exchange over a young plantation in northern China. Agricultural and Forest Meteorology , 263, 334-345. DOI: 10.1016/j.agrformet.2018.09.004 [ Links ]
Martínez-Yrízar, A., Álvarez-Sánchez, J., & Maass, M. (2017). Análisis y perspectivas del estudio de los ecosistemas terrestres de México: dinámica hidrológica y flujos de nitrógeno y fósforo. Revista Mexicana de Biodiversidad, 88, 27-41. DOI: 10.1016/j.rmb.2017.10.008 [ Links ]
Matsumoto, K., Ohta, T., Nakai, T., Kuwada, T., Daikoku, K., Iida, S., & Hattori, S. (2008). Energy consumption and evapotranspiration at several boreal and temperate forests in the Far East. Agricultural and Forest Meteorology , 148(12), 1978-1989. DOI: 10.1016/j.agrformet.2008.09.008 [ Links ]
Mauder, M., & Foken, T. (2006). Impact of post-field data processing on eddy covarianceflux estimates and energy balance closure. Meteorologische Zeitschrift, 15(6), 597-609 [ Links ]
Méndez-Espinoza, C., & Vallejo-Reyna, M. Á. (2019). Mecanismos de respuesta al estrés abiótico: hacia una perspectiva de las especies forestales. Revista Mexicana de Ciencias Forestales, 10(56), 33-64. DOI: 10.29298/rmcf.v10i56.567 [ Links ]
Meza, F. J., Montes, C., Bravo-Martínez, F., Serrano-Ortiz, P., & Kowalski, A. S. (2018). Soil water content effects on net ecosystem CO2 exchange and actual evapotranspiration in a Mediterranean semiarid savanna of Central Chile. Scientific Reports, 8(1), 1-11. DOI: 10.1038/s41598-018-26934-z [ Links ]
Miyazaki, S., Ishikawa, M., Baatarbileg, N., Damdinsuren, S., Ariuntuya, N., & Jambaljav, Y. (2014). Interannual and seasonal variations in energy and carbon exchanges over the larch forests on the permafrost in northeastern Mongolia. Polar Science, 8(2), 166-182. DOI: 10.1016/j.polar.2013.12.004 [ Links ]
Mo, X., Liu, S., Chen, X., & Hu, S. (2018). Variability, tendencies, and climate controls of terrestrial evapotranspiration and gross primary productivity in the recent decade over China. Ecohydrology, 11(4), 1-13. DOI: 10.1002/eco.1951 [ Links ]
Monarrez-González, J. C., Perez-Verdin, G., López-González, C., Márquez-Linarez, M. A., & González-Elizondo, M. del S. (2018). Efecto del manejo forestal sobre algunos servicios ecosistémicos en los bosques templados de México. Madera y Bosques, 24(2), 1-16. DOI: 10.21829/myb.2018.2421569 [ Links ]
Moncrieff, J. B. (2004). Averaging, detrending and filtering of eddy covariance time series. In: Lee, X., Massman, W. J., & Law, B. E. (eds.). Handbook of micrometeorology: A guide for surface flux measurements. Dordrecht, The Netherlands: Kluwer Academic. [ Links ]
Moncrieff, J. B. (1997). A system to measure surface fluxes of momentum sensible heat, water vapor and carbon dioxide. Journal of Hydrology, 589-611. [ Links ]
Novick, K. A., Oishi, A. C., Ward, E. J., Siqueira, M. B. S., Juang, J. Y., & Stoy, P. C. (2015). On the difference in the net ecosystem exchange of CO2 between deciduous and evergreen forests in the southeastern United States. Global Change Biology, 21(2), 827-842. DOI: 10.1111/gcb.12723 [ Links ]
Özhan, S., Gökbulak, F., Serengil, Y., & Özcan, M. (2010). Evapotranspiration from a mixed deciduous forest ecosystem. Water Resources Management, 24(10), 2353-2363. DOI: 10.1007/s11269-009-9555-6 [ Links ]
Pan, S., Tian, H., Dangal, S. R. S., Yang, Q., Yang, J., Lu, C., & Ouyang, Z. (2015). Responses of global terrestrial evapotranspiration to climate change and increasing atmospheric CO2 in the 21st century. Earth’s Future, 3(1), 15-35. DOI: 10.1002/2014EF000263 [ Links ]
Pérez-Ruiz, E. R., Garatuza-Payan, J., Watts, C. J., Rodriguez, J. C., Yepez, E. A., & Scott, R. L. (2010). Carbon dioxide and water vapour exchange in a tropical dry forest as influenced by the North American Monsoon System (NAMS). Journal of Arid Environments, 74(5), 556-563. DOI:10.1016/j.jaridenv.2009.09.029 [ Links ]
Perez-Verdin, G., Monarrez-González, J. C., Tecle, A., & Pompa-Garcia, M. (2018). Evaluating the multi-functionality of forest ecosystems in northern Mexico. Forests, 9(4), 1-14. DOI: 10.3390/f9040178 [ Links ]
Qaderi, M. M., Martel, A. B., & Dixon, S. L. (2019). Environmental factors influence plant vascular system and water regulation. Plants, 8(3), 1-23. DOI: 10.3390/plants8030065 [ Links ]
R Core Team. (2018). R: A language and environment for statistical computing. R Foundation for Statistical Computing. Vienna, Austria. Recuperado de http://www.R-project.org/ [ Links ]
Reichstein, M., Falge, E., Baldocchi, D., Papale, D., Aubinet, M., Berbigier, P., & Valentini, R. (2005). On the separation of net ecosystem exchange into assimilation and ecosystem respiration: Review and improved algorithm. Global Change Biology, 11(9), 1424-1439. DOI: 10.1111/j.1365-2486.2005.001002.x [ Links ]
Sanwangsri, M., Hanpattanakit, P., & Chidthaisong, A. (2017). Variations of energy fluxes and ecosystem evapotranspiration in a young secondary dry dipterocarp forest in Western Thailand. Atmosphere, 8(8). DOI: 10.3390/atmos8080152 [ Links ]
Soriano-Luna, M. de los Á., Ángeles-Pérez, G., Guevara, M., Birdsey, R., Pan, Y., Vaquera-Huerta, H., & Vargas, R. (2018). Determinants of above-ground biomass and its spatial variability in a temperate forest managed for timber production. Forests, 9(8), 1-20. DOI: 10.3390/f9080490 [ Links ]
Sun, G., Noormets, A., Gavazzi, M. J., Mcnulty, S. G., Chen, J., Domec, J., & Skaggs, R. W. (2010). Energy and water balance of two contrasting loblolly pine plantations on the lower coastal plain of North Carolina, USA. Forest Ecology and Management, 259, 1299-1310. DOI: 10.1016/j.foreco.2009.09.016 [ Links ]
Sun, G., Domec, J. C., & Amatya, D. M. (2016). Forest evapotranspiration: Measurement and modelling at multiple scales. In: Forest hydrology: Processes, management and assessment (pp. 32-50). DOI: 10.1079/9781780646602.0032 [ Links ]
Sun, X., Zou, C. B., Wilcox, B., & Stebler, E. (2018). Effect of vegetation on the energy balance and evapotranspiration in tallgrass prairie: A Paired study using the eddy-covariance method. Boundary-Layer Meteorology. DOI: 10.1007/s10546-018-0388-9 [ Links ]
Thompson, S. E., Harman, C. J., Konings, A. G., Sivapalan, M., Neal, A., & Troch, P. A. (2011). Comparative hydrology across AmeriFlux sites: The variable roles of climate, vegetation, and groundwater. Water Resources Research, 47(7), 1-17. DOI: 10.1029/2010WR009797 [ Links ]
Tsuruta, K., Kosugi, Y., Takanashi, S., & Tani, M. (2016). Inter-annual variations and factors controlling evapotranspiration in a temperate Japanese cypress forest. Hydrological Processes, 30(26), 5012-5026. DOI: 10.1002/hyp.10977 [ Links ]
Tudoroiu, M., Genesio, L., Gioli, B., Schume, H., Knohl, A., Brümmer, C., & Miglietta, F. (2018). Solar dimming above temperate forests and its impact on local climate. Environmental Research Letters, 13(6). DOI: 10.1088/1748-9326/aac4e0 [ Links ]
Ussiri, D. A. N., & Lal, R. (2017). Carbon sequestration for climate change mitigation and adaptation. Springer, USA. DOI: 10.1007/978-3-319-53845-7 [ Links ]
Vickers, D., & Mahrt, L. (1997). Quality control and flux sampling problems for tower and aircraft data. Journal of Atmospheric and Oceanic Technology, 14, 512-526. [ Links ]
Wagle, P., Xiao, X., Kolb, T. E., Law, B. E., Wharton, S., Monson, R. K., & Gowda, P. H. (2016). Differential responses of carbon and water vapor fluxes to climate among evergreen needleleaf forests in the USA. Ecological Processes, 5(1). DOI: 10.1186/s13717-016-0053-5 [ Links ]
Webb, E. K., Pearman, G. I., & Leuning, R. (1980) Correction of flux measurements for density effects due to heat and water vapour transfer. Quarterly Journal of the Royal Meteorological Society, 106, 85-100. [ Links ]
Wilczak, J. M., Oncley, S. P., & Stage, S. A. (2001). Sonic anemometer tilt correction algorithms. Boundary-Layer Meteorology, 99, 127-150 DOI: 10.1023/A:1018966204465 [ Links ]
Wilson, K. B., & Baldocchi, D. D. (2000). Seasonal and interannual variability of energy fluxes over a broadleaved temperate deciduous forest in North America. Agricultural and Forest Meteorology , 102, 83-103. [ Links ]
Wilson, K., Goldstein, A., Falge, E., Aubinet, M., Baldocchi, D., Berbigier, P., & Verma, S. (2002). Energy balance closure at FLUXNET sites. Agricultural and Forest Meteorology , 113, 223-243. [ Links ]
Wutzler, T., Lucas-Moffat, A., Migliavacca, M., Knauer, J., Sickel, K., Šigut, L., & Reichstein, M. (2018). Basic and extenx|sible post-processing of eddy covariance flux data with REddyProc. Biogeosciences, 15, 5015-5030. DOI:10.5194/bg-15-5015-2018 [ Links ]
Xu, M., Wen, X., Wang, H., Zhang, W., Dai, X., Song, J., & Yu, G. (2014). Effects of climatic factors and ecosystem responses on the inter-annual variability of evapotranspiration in a coniferous plantation in subtropical China. PLoS ONE, 9(1), 1-14. DOI: 10.1371/journal.pone.0085593 [ Links ]
Yan, C., Zhao, W., Wang, Y., Yang, Q., Zhang, Q., & Qiu, G. Y. (2017). Effects of forest evapotranspiration on soil water budget and energy flux partitioning in a subalpine valley of China. Agricultural and Forest Meteorology, 246, 207-217. DOI: 10.1016/j.agrformet.2017.07.002 [ Links ]
Yang, Y., Anderson, M. C., Gao, F., Hain, C. R., Semmens, K. A., Kustas, W. P., & Sun, G. (2017). Daily Landsat-scale evapotranspiration estimation over a forested landscape in North Carolina, USA, using multi-satellite data fusion. Hydrology and Earth System Sciences, 21(2), 1017-1037. DOI: 10.5194/hess-21-1017-2017 [ Links ]
Zha, T., Li, C., Kellomaki, S., Peltola, H., Wang, K., & Zhang, Y. (2013). Controls of evapotranspiration and CO2 Fluxes from Scots pine by surface conductance and abiotic factors. PLoS ONE, 8(7). DOI: 10.1371/journal.pone.0069027 [ Links ]
Received: February 10, 2020; Accepted: July 22, 2020
 Este es un artículo publicado en acceso abierto bajo una licencia Creative Commons
