


 nueva página del texto (beta)
 Inglés (pdf)
 Artículo en XML
 Referencias del artículo
 Enviar artículo por email
 Citado por SciELO
  Similares en
SciELO
Similares en
SciELO 
 Permalink
Introduction
Economic impact of hydrometeorological events
The risk of natural hazards has increased worldwide, causing human and economic losses. The UNISDR points out that disasters caused by hydrometeorological events have the greatest socio-economic impact in cities every year. Costs have reached an average of 200 billion dollars per year (Figure 1), with hydrometeorological events accounting for 74 % of these economic losses (Figure 2), the number of people affected annually by disasters exceeds 226 million (UN, 2012). Of these the phenomena, floods cause the most damages and deaths each year (followed by droughts), which in 2015 exceeded its annual average number of damages from previous years by 40 % (CRED, 2016). Each year, there are 102 million people affected by floods, which are responsible for 15 % of all deaths caused by natural-hazard-related disasters. These damages are compounded by tropical cyclones, which affect 37 million people every year (UN, 2012).
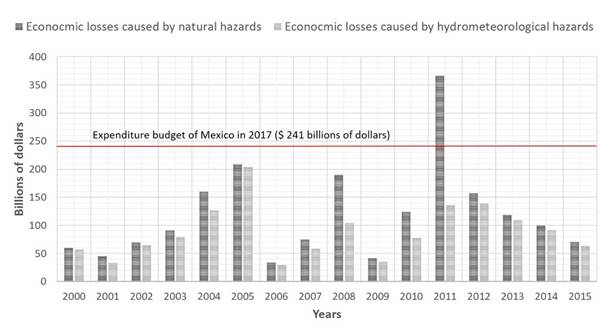
Figure 1 Economic impact caused by natural phenomena and hydrometeorological events for the period between 2000 and 2015, worldwide. Source: Author's own with data from the Centre for Research on the Epidemiology of Disasters (CRED).
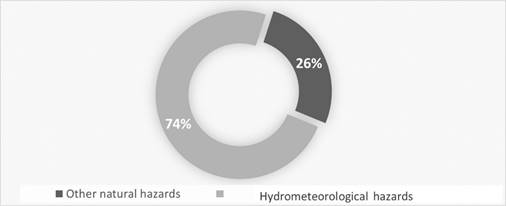
Figure 2 Percentage that represents the economic impact caused by hydrometeorological events worldwide. Source: Author's own with data from the CRED.
According to the International Federation of the Red Cross, of the eleven types of actions it carries out, each year, more than half are the result of a natural-hazard-related events, the highest percentage of which is due to hydrometeorological events. Of these events, floods are the disasters that are behind most of their first-aid efforts, followed very closely by epidemics (IFRC, 2015).
Mexico’s latitude and large coastlines along the Pacific and Atlantic oceans exposes many of its cities to hazards such as tropical cyclones, severe storms, and floods, this same latitude also places it on the largest desert strip in the world. Both factors create irregular spatial and temporal distributions of water, as well as increasingly frequent droughts (Arreguín-Cortés, López, & Marengo, 2016a; Arreguín-Cortés, López, Ortega-Gaucin, & Ibañez, 2016b).
Mexican cities face challenges that are similar to many parts of the world: dealing with natural-hazard-related events caused by hydrometeorological phenomena which generate the greatest human and economic losses in the country; no other type of manifestation, be it geological, chemical, sanitary, or socio-organizational generates as much damage to the nation as hydrometeorological events (Figure 3). From 2000 to 2016 these events have accounted for 92 % of the total losses (Figure 4) that the country has had due to different kinds of phenomena (Cenapred, 2017). The record for economic losses caused by natural hazard related events hydrometeorological events was set in the year 2010, at $4480 billion dollars, with hydrometeorological phenomena responsible for $4005 billion dollars of those losses (Cenapred, 2011).
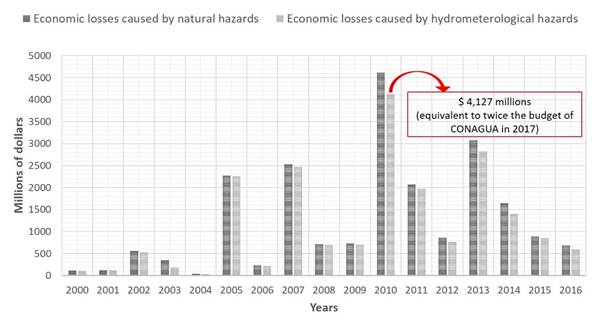
Figure 3 Economic impact due to different types of phenomena and to hydrometeorological events in the period 2000-2016 in Mexico. Source: Author's own with data from Cenapred.
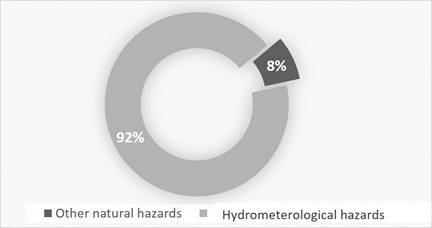
Figure 4 Percentage that represents the economic impact caused by hydrometeorological events in Mexico. Source: Author's own with data from Cenapred.
Originally, the term resilience was used in engineering to denote the ability of some materials to absorb elastic energy and return to their original state after being exposed to forces that tried to deform them (Gere & Goodno, 1972). In 1973, CS Holling incorporated this concept in studies on the ecology, such as the one on "Resilience and Stability of Ecological Systems", where he identifies the capacity of environmental systems and of certain organisms to resist, adapt to, and recover from unusual situations (Holling, 1973).
Urban resilience
This article adopts the concept that the United Nations Office for Disaster Risk Reduction (UNISDR) established in Geneva in 2004, defining resilience as “The capacity of a system, community or society potentially exposed to hazards to adapt, by resisting or changing in order to reach and maintain an acceptable level of functioning and structure. This is determined by the degree to which the social system is capable of organizing itself to increase this capacity for learning from past disasters for better future protection and to improve risk reduction measures” (UNISDR, 2005).
This conceptualization is very similar to the one posed by The Committee on Increasing National Resilience to Hazards and Disasters of the National Academies, in his 2012 study Disaster Resilience: A National Imperative, which defines resilience as: "The ability to prepare and plan for, absorb, recover from or more successfully adapt to actual or potential adverse events" (The National Academies, 2012).
These are the qualities that should be assessed to determine the level of resilience of a system (Parsons et al., 2017; Sharifi & Yamagata, 2016). Resistance is the opposition to the effects caused by a hazard, reducing or avoiding the possible impacts. It is generally by physical means that this is accomplished. Adaptation is the adjustment to systems in response to changing environmental conditions due to the impact and aftermath of a hazard. Recovery is the restoration and improvement of the functioning and physical structure of the systems that make up an entity. Preparedness encompasses the part of risk analysis, learning, and planning, as well as the way in which integrated risk management is carried out (UNISDR, 2009).
In recent years, in the area of urban development, the concept of city resilience or urban resilience has been developed (UN HABITAT, 2017; UNISDR, 2015; UNISDR, 2005) and has been used to denote the ability of cities to resist, adapt to, recover from, and prepare against hazards that can damage the integrity of their physical and systemic structure (UN HABITAT, 2017).
There are several tools in the literature to assess resilience in cities by means of an index (Parsons et al., 2016); many of them jointly assess the multiple components present in a city, such as health, welfare, the economy, society, organization, strategy, infrastructure, and ecosystems, and their behavior in the face of different critical situations or disturbing agents it can face. Some others evaluate these components in certain situations, such as earthquakes, epidemics, tsunamis or terrorism, to name a few. All these assessment tools can be classified according to the components’ resilience that are being evaluated and the sort of hazard to which is resilient. Currently, there is no tool for assessing the urban resilience to hydrometeorological hazards and its technical components.
This paper proposes a methodology to assess the resilience level of a city to hydrometeorological hazards, called the City Resilience Index (CRI), that is based on two assessment tools: one quantitative, called Technical Resilience Index and the other, which is called Technical Profile of Resilience, that is a qualitative analysis of the characteristics of the city, specifically technical factors such as infrastructure, land-use planning, ecological programs, building codes and risk assessment. The purpose of these tools is to measure and monitor the capacity of resistance, adaptation, recovery and preparedness in the face of hydrometeorological events, which, according to the classification of the National Center for Disaster Prevention in Mexico (Cenapred), include tropical cyclones, droughts, floods, severe storms, and frosts. For this analysis the city of Cuernavaca, Mexico, was selected as a case study.
Urban resilience and risk integration
Cities concentrate more than 50 % of the world's population, while occupying only 3 % of the earth's surface (UN DESA, 2016). It is estimated that by 2050, the population settled in cities will account for almost 70 % of the world population (UN DESA, 2016). Moreover, developing countries have the largest number of inhabitants settled in cities, with more than 80 % of the world's urban population (UN HABITAT, 2012). Mexico, will go from having 384 cities in 2016 to 961 in 2030, with a concentration of 83.2 % of its population in urban areas (UN HABITAT, 2016).
Of the 33 megacities in the world (UN DESA, 2018); i.e., the cities with more than 10 million inhabitants, 19 are coastal cities. Nine of the 10 cities projected to become megacities between 2018 and 2030 are located in developing countries (UN DESA, 2018), usually with less organization and financing capabilities in the face of disasters. Furthermore, coastal cities are the most exposed and vulnerable to disasters caused by hydrometeorological events (UNISDR, 2012b). These cities constantly suffer the impact of phenomena such as tropical cyclones, severe storms and floods. The need to consider coastal cities has increased because from 1970 to 2010, worldwide settlements in river basins with flooding risks increased by 114 %, and those in coastal areas prone to the impact of cyclonic threats increased by 192 % (UN, 2012). In Mexico alone, there are about 80 coastal cities with populations between 100 000 and 1 000 000 inhabitants (INEGI, 2015).
A risk is the result of the junction of three main elements: a hazard, an exposure of the population and its assets, and a situation of vulnerability of the population and its assets (UNISDR, 2012b). Therefore, the worldwide growth of urban population leads to an increase of exposure, in developing countries this more commonly affects the population living in conditions of vulnerability.
Since resilience has recently been acknowledged in the risk assessment literature, its integration will be represented in the following way (Figure 5).
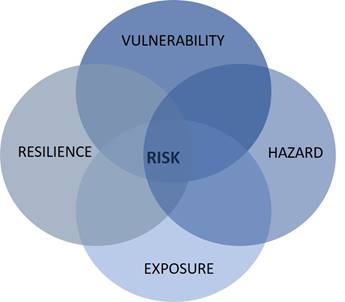
Resilience, as a new element of risk assessment, is a reduction coefficient. The interaction of resilience with the risk and the elements that integrate it is expressed by the following function (UNISDR, 2012b):
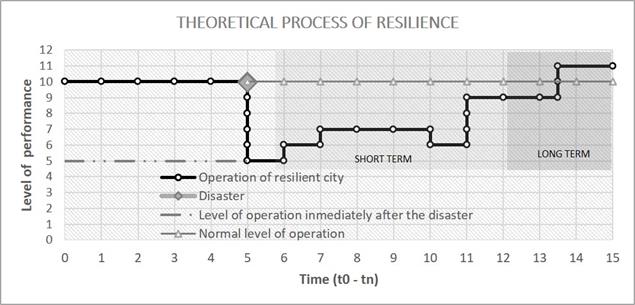
The main objective of creating resilience in cities is that their comprising systems maintain an acceptable level of functioning in a critical and unusual situation while a process is being carried out to restore normal conditions. Figure 6 shows the operation of resilience under the normal conditions of a city ( Y n ) and the operation immediately after the occurrence of a phenomenon ( 𝑌 𝑑 ). It can be observed that the recovery pattern is not always an ascending one, and that there may be a lapse where the level of functioning decreases; in the operation this is interpreted as a possible trial-and-error period. In the long term, it is expected that the implementation of strategies that favor resilience will allow the pre and post-phenomenon level of operations of the city to exceed the conditions
Methodology
The first step before defining strategies and measures to help create or enhance current resilience in cities is to assess key aspects that define the resilience of a city in order to know which of these need to be enhanced. Assessing the resilience of a city is a complex process that involves various aspects, variables, and hazards; therefore, it is necessary to rely on appropriate tools. In this work, two tools are presented: the Technical Resilience Index, with a numerical nature and the Technical Profile of Resilience, which complements the first one through a detailed analysis of the elements that can increase the resilience of a city to hydrometeorological events, in addition to contemplating the proposal of structural and non-structural measures, and laying the groundwork for developing a resilience strategy in the face of hydrometeorological events. The purpose of the index is to measure and monitor, by means of indicators, the four characteristics that render a system resilient: resistance, adaptation, recovery, and preparedness.
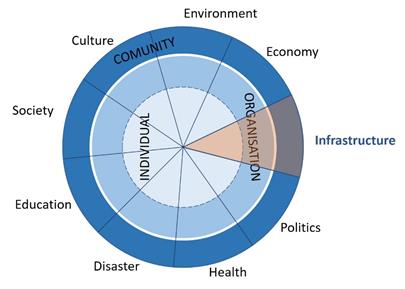
Since resilience is multifactorial, with environmental, social, and economic elements (Figure 7), as well as multifunctional, having action in the face of different perturbing agents-i.e. there can be resilience to hydrometeorological events, earthquakes or other perturbing agents, each dependent on certain factors-it is necessary to limit the dominion and scope of the assessment so that the index may give results on each element to be analyzed (Parsons et al., 2016). This constraint is related to the purpose of the assessment, the hierarchical analysis, the scale of the assessment, the design structure, the selection of indicators, data analysis and calculation process, and data reporting and interpreting (Parsons et al., 2016).
The Technical Resilience Index
The technical index of resilience is a tool that allows for the identification of geographical units that are resilient to hydrometeorological events and gives the basis to carry out specific studies and develop strategies.
In the case of resilience, it is necessary to use a certain number of proxy indicators. Each indicator will help obtain the data that should be taken at an appropriate scale to order them.
Indicators selection and calculation process for case study
Indicators can be a function of one or more variables. The idea here is to evaluate the technical component of a city in the face of the impact of hydrometeorological events (Figure 8).
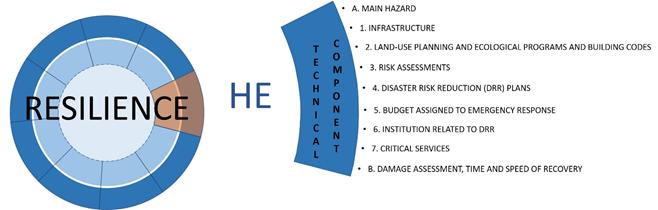
Figure 8 The technical component is part of the resilience wheel, focused on hydrometeorological events (HE). Source: Author's own, adapted from the UNISDR's Resilience Wheel.
This paper proposes a Technical Resilience Index, which includes seven indicators: Infrastructure, land-use planning and ecological programs and building codes, risk assessments, disaster risk reduction (DRR) plans, budget assigned to emergency response, institution related to disaster risk reduction (DRR) and critical services; these indicators are estimated using two levels of sub-indicators (33 sub-indicator level 1 and 34 sub-indicators level 2). For evaluating each sub-indicator twenty-eight equations were designed, some of them are used for more than one sub-indicator, so that, in total, there are 52 values for calculating the index (Figure 9). Additionally, the Technical Profile of Resilience is proposed. It consists of two indicators (A and B), these complementary indicators serve to characterize the approach that the resilience profile should have (according to the main hazard) and to assess the speed of recovery, respectively. From the analysis performed, it is a break down of the indicators that make up the technical component and are as follows:
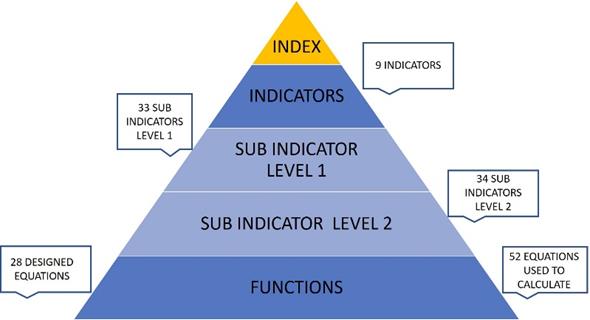
Table 1 specifies how each indicator relates to the characteristics of resilience. The selection of indicators was based on the UN's proposal (UNISDR, 2012b).
Table 1 Structure of the indicators that make up the technical index and their corresponding contribution to the fundamental characteristics of resilience. Source: Author's own, adapted from Sharifi and Yamagata (2016).
| Indicators | Weight | Preparedness | Resistance | Recovery | Adaptation |
|---|---|---|---|---|---|
| A. Main hazard indicator | |||||
| A.1 Droughts | _ _ | ü | ü | ||
| A.2 Tropical cyclones | ü | ü | |||
| A.3 Floods | ü | ü | |||
| A.4 Severe storms | ü | ü | |||
| A.5 Frosts | ü | ü | |||
| 1. Infrastructure | |||||
| 1.1 Investment in new infrastructure | 30 | ü | ü | ü | ü |
| 1.2 Investment in maintenance | ü | ü | ü | ||
| 1.3 Supervision of the physical conditions of infrastructure | ü | ||||
| 1.4 Critical infrastructure | ü | ü | ü | ü | |
| 1.4.1 Hospitals | |||||
| 1.4.2 Schools | |||||
| 2. Planning programs and building codes | |||||
| 2.1 Land-use | 10 | ü | ü | ü | |
| 2.1.1 Existence | |||||
| 2.1.2 Update | |||||
| 2.2 Ecological | ü | ü | ü | ||
| 2.2.1 Existence | |||||
| 2.2.2 Update | |||||
| 2.3 Regulation and building codes | ü | ü | ü | ||
| 2.3.1 Existence | |||||
| 2.3.2 Update | |||||
| 2.4 Application of regulatory plans and codes | ü | ü | ü | ||
| 3. Risk assessments | |||||
| 3.1 Climate risk projections and trends | 10 | ü | ü | ||
| 3.1.1 Existence | |||||
| 3.1.2 Update | |||||
| 3.2 Hazard, exposure, and risk maps | ü | ü | |||
| 3.2.1 Existence | |||||
| 3.2.2 Update | |||||
| 3.3 Insurance coverage statistics | ü | ü | |||
| 3.3.1 Existence | |||||
| 3.3.2 Update | |||||
| 3.4 History of socio-economic impacts | ü | ü | |||
| 3.4.1 Existence | |||||
| 3.4.2 Update | |||||
| 3.5 Population in risk areas | ü | ü | |||
| 4. Disaster Risk Reduction (DRR) plans | |||||
| 4.1 Proactive | 10 | ü | ü | ü | |
| 4.1.1 Existence | |||||
| 4.1.2 Update | |||||
| 4.2 Reactive | ü | ü | |||
| 4.2.1 Existence | |||||
| 4.2.2 Update | |||||
| 4.3 Post-disaster | ü | ü | |||
| 4.3.1 Existence | |||||
| 4.3.2 Update | |||||
| 5. Budget assigned to emergency response | |||||
| 5.1 Budget assigned to emergencies | 10 | ü | ü | ü | |
| 5.2 Budget assigned to prevention programs | ü | ||||
| 6. Institution related to DRR | |||||
| 6.1 Qualified personnel (emergency response) | 10 | ü | ü | ü | ü |
| 6.2 Equipment * | ü | ü | ü | ||
| 6.3 Units * | ü | ü | ü | ||
| 6.4 Early-Warning System | ü | ü | |||
| 7. Critical services | |||||
| 7.1 Drinking water | 20 | ü | ü | ü | |
| 7.1.1 Service coverage | |||||
| 7.1.2 24-h service coverage | |||||
| 7.1.3 PIGOO overall efficiency | |||||
| 7.1.4 Water stress degree PRONACOSE* | |||||
| 7.1.5 Supply | |||||
| 7.2 Sanitation | ü | ü | ü | ||
| 7.2.1 Sewerage service coverage | |||||
| 7.2.2 Wastewater vs treated water | |||||
| 7.2.3 Wastewater treatment plants | |||||
| 7.3 Energy | ü | ü | ü | ||
| B. Damage assessment and time and speed of recovery | |||||
| B.1 Damaged infrastructure | _ _ | ü | |||
| B.1.1 Update of the number of the affected structures | |||||
| B.1.2 Updated execution time | |||||
| B.2 Global assessment | ü | ||||
| B.2.1 Cost of disaster | |||||
| B.2.2 Estimated recovery time | |||||
| B.3 Recovery speed | ü | ||||
Global technical resilience level
The process of estimating the nine indicators that have been presented, leads to the identification of the main hazard or threat, the condition of urban Infrastructure, the existing documents regarding to land-use planning, ecological programs, building codes, risk assessments and disaster Risk Reduction (DRR) plans , as well as making a review of the adequacy of the budget assigned to emergency response, response capacity of the institution related to disaster risk reduction (DRR), the critical services condition, and speed of recovery.
Once the nine indicators are established it is necessary to give them a representative value for their subsequent display, and for that we use the study’s Global technical resilience level, which is the weighted sum of the numerical indicators and has a range of 0 to 100. For geospatial representations, it has been divided into 5 levels (Table 2), very high, high, medium, low and very low levels of resilience can be identified on a map.
Table 2 Resilience level according to the index rating. Source: Author's own.
| Range | Level of resilience | |
|---|---|---|
| 81 to 100 | Very high | |
| 61 to 80 | High | |
| 41 to 60 | Medium | |
| 21 to 40 | Low | |
| 0 to 20 | Very low |
The UNISDR considers that resilience is a risk reduction factor (UNISDR, 2012a); therefore, it is necessary to carry out an adjustment of its estimation to make it possible to obtain the map of the expected level of impact, which is the merging of the risk map and the resilience map based on the qualitative and schematic criterion of Table 3.
Table 3 Criterion matrix to obtain the expected level of impact. Source: Author's own.
| Level of expected impact | ||||||
|---|---|---|---|---|---|---|
| Level | Risk | |||||
| Very low | Low | Medium | High | Very high | ||
| Resilience | Very low | Medium | Medium | High | High | Very high |
| Low | Low | Medium | Medium | High | High | |
| Medium | Low | Low | Medium | Medium | High | |
| High | Very low | Low | Low | Medium | Medium | |
| Very high | Very low | Very low | Low | Low | Medium | |
An open-code platform was designed as a tool to make the city resilience index to hydrometeorological events calculation. To carry out the assessment, it is necessary to enter the data collected into the system. This interface provides a report on the rating of the index and of each indicator. The data of the report can be processed in a pre-designed spreadsheet to obtain a radial graph, as well as in a geographic information system to obtain a map of resilience and expected impact.
Technical profile of resilience
To understand the study area’s singularities and to enable the identification of the traits that the city needs to enhance its resilience, a city resilience technical profile is proposed.
The Technical Profile of Resilience is a tool for analyzing existing information, such as the socioeconomic impacts it has suffered, the planning instruments it has, the building codes, the existing hazard assessments, the risk, as well as the vulnerabilities of the population. It covers the proposal of structural and non-structural measures and lays the foundations for developing a resilience-building or enhancing strategy, that complements the index assessment. This tool also proposes the generation of non-existing information, such as maps and records, and its main objective is to feed the decision-making process.
The analysis that is carried out is aimed at identifying whether or not the existing information covers the building of resilience or if the information and planning instruments, such as building codes, can enhance the resilience of the city in the technical component.
This methodology includes the following steps:
Analysis of the socio-economic impacts of the city in the face of hydrometeorological events.
Analysis of information on existing vulnerability, hazard, and risk in the city.
Analysis of the predominant hazard.
Analysis of water availability studies.
Analysis of land-use and ecological planning instruments, as well as of the regulation codes of the city.
Statistics generation and updating and their representation by means of maps, tables, and graphs.
Proposal of non-structural and structural measures to enhance resilience.
The city resilience technical profile details the attributes that are analyzed for assessing resilience, such as hydrographic and physiographic traits, basic and critical infrastructure, and governmental and non-governmental institutions related to disaster risk reduction.
Resilience level of Cuernavaca, Mexico
In order to measure the system’s real impact of hydrometeorological phenomena and the need to increase its resilience, the city of Cuernavaca was chosen as a case study because of its experience with impacts of this kind, as well as the accessibility of information for this municipality along with some strategies and tools for their management.
In the aftermath of the 1985 earthquake that affected Mexico City, part of the population of the affected area, as well as public and private institutions, migrated to the city of Cuernavaca, causing an accelerated and disorganized growth, with scarce urban planning. This, coupled with a rugged topography, makes planning and mobility difficult.
Technical Resilience Index for the city of Cuernavaca
The next nine tables show the indicators, sub-indicators and equations that make up the index, the value obtained with each equation was multiplied by the weight assigned to it, remembering that the range is between 0 and 1. The results of their application to the City of Cuernavaca are included.
This index system starts with a hydrometeorological events indicator because once the sorts of hazards threating the region are identified, therein will be a guideline for the information and key aspects to be evaluated in the next indicators. In some latitudes, it may be irrelevant to look for information about frosts and in very wet regions the information about droughts could be limited.
This indicator is used to identify the hydrometeorological event (HE) that has the greatest impact in the city. The HE with the highest value within the range is the one with the greatest potential impact and is the one in which the resilience profile analysis, along with the measures and strategies to be implemented should be focused. This indicator has not been assigned a weight, since its function is to prioritize the most harmful event for the city being studied (Table 4).
Table 4 Hydrometeorological events indicator.
| Indicator | |||
|---|---|---|---|
| A. Main hazard indicator | Weight | Equation | Qualification Cuernavaca |
| A.1 Droughts | -- |
|
-- |
| A.2 Tropical cyclones | -- |
|
-- |
| A.3 Floods | -- |
|
-- |
| A.4 Severe storms | -- |
|
-- |
| A.5 Frosts | -- |
|
-- |
The next consideration for this assessment tool is infrastructure indicator (Table 5), since infrastructure is the main physical medium for urban resilience, regardless the main hazard, this has the highest value within the index (30 %) since it takes a lead role in keeping the critical services going during a disaster.
The value of 30 % was assigned through an analysis of the information contained in Cenapred's "Socioeconomic Impacts of Disasters in Mexico" reports on the resources allocated by the Natural Disaster Fund (FONDEN) from 1996 to 2014, for responses in the urban infrastructure sector, without taking roads or houses into account.
Table 5 Infrastructure indicator.
| Indicator | |||
|---|---|---|---|
| 1. Infrastructure. Weigth=30 | Weight | Equation | Qualification Cuernavaca |
| 1.1 Investment in new infrastructure* | 7.00 |
|
4.97 |
| 1.2 Investment in maintenance* | 7.00 |
|
0.00 |
| 1.3 Supervision of the physical conditions of infrastructure * | 7.00 |
|
0.00 |
| 1.4 Critical infrastructure | 9.00 | ||
| 1.4.1 Hospitals* | 5.00 |
|
3.35 |
| 1.4.2 Schools* | 4.00 |
|
3.24 |
|
|
11.56 | ||
The indicator of planning programs and building codes considers the existent land-use planning and environmental tools, its updating and implementation, as well as the building codes (Table 6). This legal and management instruments, lead to balanced development, reduce the exposure, prevent the increase of risk and contribute to resilience. The weight of this indicator is 10 %. This indicator serves to identify land-use zoning and legally relevant features.
Table 6 Indicators of planning programs and building codes.
| Indicator | |||
|---|---|---|---|
| 2. Planning programs and building codes. Weigth=10 | Weight | Equation | Qualification Cuernavaca |
| 2.1 Land-use | 2.50 | ||
| 2.1.1 Existence | 1.25 |
|
1.25 |
| 2.1.2 Update* | 1.25 |
|
0.70 |
| 2.2 Ecological | 2.50 | ||
| 2.2.1 Existence | 1.25 |
|
1.25 |
| 2.2.2 Update* | 1.25 |
|
1.25 |
| 2.3 Regulation and building codes | 2.50 | ||
| 2.3.1 Existence | 1.25 |
|
1.25 |
| 2.3.2 Update* | 1.25 |
|
1.25 |
| 2.4 Application of regulatory plans and codes | 2.50 |
|
2.50 |
|
|
9.45 | ||
The next consideration for this assessment tool is an indicator of risk assessments, which rates the existing documents for risks in the city and whether or not they are up-to-date, as well as the percentage of population settled in risk areas. Identifying the hazards, vulnerabilities and level of exposure, allows for the delineation of actions aimed at enhancing urban resilience.
The analysis of this information enables the development of measures and plans that help to mitigate the risk of disaster. Therefore, assessing its presence and its being up-to-date is relevant to designing adequate resilience strategies based on real conditions. The weight of this indicator is 10 % (Table 7).
Table 7 Indicator of risk assessments.
| Indicator | |||
|---|---|---|---|
| 3. Risk assessments. Weigth=10 | Weight | Equation | Qualification Cuernavaca |
| 3.1 Climate risk projections and trends | 2.00 | ||
| 3.1.1 Existence | 1.00 |
|
1.00 |
| 3.1.2 Update* | 1.00 |
|
1.00 |
| 3.2 Hazard, exposure, and risk maps | 2.00 | ||
| 3.2.1 Existence | 1.00 |
|
1.00 |
| 3.2.2 Update* | 1.00 |
|
0.50 |
| 3.3 Insurance coverage statistics | 2.00 | ||
| 3.3.1 Existence | 1.00 |
|
1.00 |
| 3.3.2 Update* | 1.00 |
|
1.00 |
| 3.4 History of socio-economic impacts | 2.00 | ||
| 3.4.1 Existence | 1.00 |
|
0.00 |
| 3.4.2 Update* | 1.00 |
|
0.00 |
| 3.5 Population in risk areas | 2.00 |
|
0.00 |
|
|
5.50 | ||
The indicator of Disaster Risk Reduction (DRR) plans considers the existing disaster risk reduction plans and their updating. A resilient city is proactive before the impact of a hazard, as well as reactive during and after it.
The regulatory framework that determines how to prevent a disaster, how to respond to it, and what to do after it happens influences disaster response potential, since it offers the guidelines and the actions needed to ensure an adequate preparedness before the impact. The UN's guide "Towards the construction of resilient municipalities: post-disaster recovery" (UNDP, 2015b) establishes the importance of these documents. This indicator was assigned a weight of 10 %, as were other indicators that assess the existence and updating of information (Table 8).
Table 8 Indicator of Disaster Risk Reduction (DRR) plans.
| Indicator | |||
|---|---|---|---|
| 4. Disaster Risk Reduction (DRR) plans. Weigth=10 | Weight | Equation | Qualification Cuernavaca |
| 4.1 Proactive | 3.50 | ||
| 4.1.1 Existence | 1.75 |
|
0.00 |
| 4.1.2 Update* | 1.75 |
|
0.00 |
| 4.2 Reactive | 3.00 | ||
| 4.2.1 Existence | 1.50 |
|
1.50 |
| 4.2.2 Update* | 1.50 |
|
1.50 |
| 4.3 Post-disaster | 3.50 | ||
| 4.3.1 Existence | 1.75 |
|
0.00 |
| 4.3.2 Update* | 1.75 |
|
0.00 |
|
|
3.00 | ||
The next consideration for this assessment tool is the Indicator of budget assigned to emergency response, which assesses the allocated financial support, from the general budget, for emergency response and prevention programs. Disaster funds allow to a nimble first response and are indicative of a more proper urban organization. The analysis of information from Cenapred regarding the distribution of FONDEN funds for emergency response, established that it is on average 9 %; therefore, the weight assigned to this indicator was rounded to 10 % (Table 9).
Table 9 Indicator of budget assigned to emergency response.
| Indicator | |||
|---|---|---|---|
| 5. Budget assigned to emergency response. Weigth=10 | Weight | Equation | Qualification Cuernavaca |
| 5.1 Budget assigned to emergencies | 5.00 |
|
0.00 |
| 5.2 Budget assigned to prevention programs* | 5.00 |
|
0.00 |
|
|
0.00 | ||
The indicator of institution related to DRR evaluates the potential of the organization dedicated to the emergency response, considering the trained personnel, equipment, ambulances, and early warning system availability.
From the analysis of information by Cenapred regarding the distribution of FONDEN funds for emergency response it was determined that the average is 9 %, plus the percentage allotted for the acquisition of specialized equipment, representing an additional 2.4 %; therefore, the weight assigned to this indicator is rounded down to 10 % (Table 10).
Table 10 Indicator of institution related to DRR.
| Indicator | |||
|---|---|---|---|
| 6. Institution related to DRR. Weigth=10 | Weight | Equation | Qualification Cuernavaca |
| 6.1 Qualified personnel (emergency response)* | 2.50 |
|
0.83 |
| 6.2 Equipment * | 2.50 |
|
0.00 |
| 6.3 Units * | 2.50 |
|
2.50 |
| 6.4 Early-Warning System | 2.50 |
|
0.00 |
|
|
3.33 | ||
The next consideration for this assessment tool is the indicator of vital services which assesses the quality and coverage of the basic services provided by the municipal government. A city with an efficient basic services provision, such as water supply, sanitation and electricity, will have more opportunities during disaster situations for resist and recover.
A city with an efficient basic services provision, such as water supply, sanitation and electricity, will have more opportunities during disaster situations to resist and recover. This indicator was assigned a weight of 20 % as a result of the analysis of the distribution of resources allocated by FONDEN, obtaining 5 % for each service (drinking water, sewerage, sanitation, and electricity) (Table 11).
Table 11 Indicator of vital services.
| Indicator | |||
|---|---|---|---|
| 7. Critical services. Weigth=20 | Weight | Equation | Qualification Cuernavaca |
| 7.1 Drinking water | 7.00 | ||
| 7.1.1 Service coverage | 1.00 |
|
0.87 |
| 7.1.2 24-h service coverage | 1.00 | 0.00 | |
| 7.1.3 PIGOO overall efficiency | 2.00 | 0.88 | |
| 7.1.4 Water stress degree PRONACOSE* | 2.00 |
|
2.00 |
| 7.1.5 Supply | 1.00 |
|
0.62 |
| 7.2 Sanitation | 7.00 | ||
| 7.2.1 Sewerage service coverage | 3.00 |
|
1.47 |
| 7.2.2 Wastewater vs treated water | 2.00 |
|
0.24 |
| 7.2.3 Wastewater treatment plants | 2.00 |
|
0.66 |
| 7.3 Energy | 6.00 |
|
5.94 |
|
|
12.68 | ||
The final consideration for this assessment tool is the indicator that evaluates the speed of disaster recovery. In the reviewed literature it is mentioned as being among the important characteristics of a resilient city, despite this, there is no standard tool or scale for its evaluation. A significant contribution of this indicator is to provide a good estimation to classify the speed of disaster recovery as slow, enough or quick.
This indicator was not assigned a weight, since its function is to classify whether a recovery is slow, average or quick. Sub-indicators B1 and B2 are necessary to calculate B3, which is the one that determines the speed of recovery. It has a range of 0 to 1. A rating of 0 to 0.33 is considered a slow recovery speed, a range of 0.34 to 0.66 is considered an average recovery speed, and a range of 0.67 to 1 is a quick recovery speed (Table 12).
Table 12 Indicator of damage assessment, time and speed of recovery.
| Indicator | |||
|---|---|---|---|
| B. Damage assessment and time and speed of recovery | Equation | Qualification Cuernavaca | |
| B.1 Damaged infrastructure | |||
| B.1.1 Update of the number of the affected structures |
|
- | |
| B.1.2 Updated execution time |
|
- | |
| B.2 Global assessment | |||
| B.2.1 Cost of disaster |
|
- | |
| B.2.2 Estimated recovery time |
|
- | |
| B.3 Recovery speed |
|
- | |
Cuernavaca’s Technical Resilience Index exhibits shortcomings, there are many interventions the city can make to increase its resilience however, in this case, most of them are not carried out. According to the information and data collected, the following assessment was made of the resilience level for the technical component of a city to hydrometeorological events.
The institutions related to disaster risk reduction do not have a record of socioeconomic impact; so for this case study, this indicator was selected qualitatively based on information gathered from other sources of information, such as journalistic notes, revealing that floods and water-management droughts were the main hazards faced by the city.
From the information provided by the institutions that generate infrastructure related to disaster risk reduction a selection was made of the works and actions that enhance resilience, such as watercourse sanitation, wastewater treatment plant rehabilitation, increased drinking water and sanitation network coverage, and protection dikes along watercourses.
Table 5 shows that in Cuernavaca, both the supervision of physical conditions of existing infrastructure and the resources allocated for its maintenance had sub-indicator ratings of zero, while the rating of critical infrastructure sub-indicators was acceptable. The value of the infrastructure indicator is 11.56 out of 30. It is therefore concluded that Cuernavaca requires a greater investment in infrastructure in order to enhance its resilience.
Indicator of planning programs and building codes: The city has Ecological Planning Programs, Conurbation Area Planning Programs, and a Building Code; thus, this indicator had a high rating, 9.45 out of 10.
Indicator of risk assessments: The city of Cuernavaca does not have information on the impact of hydrometeorological and climatological phenomena, nor does it have a Municipal Risk Atlas, or a socioeconomic impact log. The rating of this indicator was 5.5 out of 10, due to the lack of adequate and current information, which affects decision-making in the city. Not knowing the risks to which the city is exposed, or its vulnerabilities, makes it impossible to identify the elements of resilience that need to be enhanced.
Indicator of Disaster Risk Reduction (DRR) plans: The city of Cuernavaca has only a reactive action plan. The development of a proactive plan makes it possible to be prepared for a catastrophe by enhancing the resilience capacity of a city, while a post-disaster plan can allow for an adequate recovery from the impact of a hydrometeorological event; therefore, developing these documents is an important part of an integrated risk management. This indicator had a low rating of 3 out of 7, since the city of Cuernavaca does not have the above-mentioned documents. Authorities, therefore, do not know how to be prepared for an emergency or how to recover from a disaster. This situation causes a bad coordination in the management, distribution, and optimization of resources and support for rehabilitating services, rebuilding infrastructure, and attending affected people.
Indicator of budget assigned to emergency response: The information gathered revealed that no budget is set aside for either an emergency response, or for the development of documents, such as prevention strategies, programs, or plans. Cuernavaca's 2015 and 2016 Annual Operational Programs did not consider a budget for civil protection. Little or no investment in risk management reduces the resilience of the city.
Indicator of institution related to DRR: Cuernavaca has a Civil Protection Agency, in charge of contributing to disaster prevention and mitigation, but since no resources are directly allocated, it does not have the capacity to respond to emergency situations the city might face; therefore, the rating of this indicator is low: 3.33 out of 10.
Indicator of vital services: This indicator had a rating of 12.60 out of 20. Sub-indicators were: energy coverage, drinking water and sewerage coverage, and level of water stress, which evaluates the conditions of the aquifer that supplies the city. Another important factor is that the percentage of treated water is proportionally very low compared to that of wastewater. Of the six existing wastewater treatment plants (WWTP) only two are operating.
Indicator of damage and time and speed of recovery: This indicator can only be implemented in the aftermath of a disaster, and the speed sub-indicator can only be estimated after a few months of the event. In the absence of a catastrophic event during the analysis period, this indicator could not be analyzed.
Technical Profile of Resilience of the city of Cuernavaca
According to the methodology proposed for the technical resilience profile, information was collected and analyzed, and missing information was generated.
One of the main problems in the face of hydrometeorological events in the city of Cuernavaca are floods, which is due to scant urban planning, the invasion of regulated areas, and the narrowing of streams. Settlements at the banks of ravines are exposed to high-speed runoff, soil softening, and landslides that put the inhabitants, the houses, and the little service infrastructure installed in those areas at risk.
Poor water resources management has led to the existence of water-management droughts, which in some cases result in socioeconomic droughts. Neither the authorities nor the population at large are fully aware of the importance of an integrated water resources management in the city, where water utilities' network and the drainage system have proven to be insufficient due to the intensity of the storms that occur every year. Little attention is given to the sanitation system since several of the treatment plants are not in operation. It should be noted that even with 100 % of the installed WWTPs operating, only a small percentage of the water used by the city can be treated.
The lack of a budget for maintaining the existing infrastructure and the absence of supervision for physical conditions of the infrastructure are other problems that were detected. These two aspects are important, since creating new infrastructure is not enough to enhance resilience; it is also necessary to check the physical conditions of existing infrastructure and to determine whether it is necessary to carry out maintenance work to assure it is in optimal conditions, especially during the impact of a hydrometeorological event which would prevent a failure resulting in a disaster.
Moreover, it is important to have guidelines for the actions that authorities and the population should take and these documents need to be updated based on the provisions of the current legal framework. Such is the case of land-use and ecological planning programs.
The United Nations Organization recommends having disaster risk reduction plans in place, showing what to do before, during, and after a disaster (UNDP, 2015b), as instruments for increasing resilience. Cuernavaca has only a reactive plan; therefore, the measures taken by institutions related to disaster risk reduction are short-term, aimed at temporarily correcting risk situations.
In order to develop these plans, it is necessary to have reliable information, with homogeneous and comparable systematic records, measurements, and data that offer orientation as to where plans, programs, and strategies should be oriented to enhance short- and long-term resilience.
Cuernavaca does not have a budget for civil protection, which reduces its capacity for prevention and response. Authorities should become aware of the fact that investing in disaster risk reduction means ensuring that the level of development reached by a city is maintained and is not lost to the impact of a natural phenomenon. Thus, institutions related to disaster risk reduction should be in place, with trained personnel, specialized equipment, and adequate units.
One of the most important elements for having high-level resilience is the provision of basic public services, such as water, electricity, sewerage, and sanitation in sufficient quantity and quality. Ensuring the supply of these services will guarantee long-term resilience. A city with a sound water resources management is a city with a future prepared to face phenomena of any kind. A city without water is a city destined to disappear. Both authorities and citizens should give water its proper value; a fair price should be paid for the water that is consumed, and only the necessary water should be consumed, avoiding waste. Water issues should not be politicized. Authorities should set fair water rates and citizens should analyze that investing in a better water supply service translates into a better quality of life.
The methodology of the resilience index of the technical component applied to the city of Cuernavaca showed that it was at high risk with an index result of 45.52 %, which according to Table 2 corresponds to a medium-range level. The technical index of resilience to hydrometeorological events in the city of Cuernavaca is summarized in Table 13.
Table 13 Results of the resilience assessment of the city of Cuernavaca - technical component. Source: Author's own, with results obtained from the City Resilience Index (CRI) program.
| Cuernavaca resilience index - technical component | |||
|---|---|---|---|
| Indicator | Weight | Rating | Rate to weight ratio |
| A. Main hazard | - | Floods and water-management droughts | - |
| 1. Infrastructure | 30.00 | 11.56 | 38.53 |
| 2. Planning Programs and Building Codes | 10.00 | 9.45 | 94.50 |
| 3. Risk assessments | 10.00 | 5.50 | 55.00 |
| 4. Disaster Risk Reduction (DRR) plans | 10.00 | 3.00 | 30.00 |
| 5. Budget assigned to emergency response | 10.00 | 0.00 | 0.00 |
| 6. Disaster risk reduction (DRR) institutions | 10.00 | 3.33 | 33.30 |
| 7. Critical services | 20.00 | 12.68 | 63.40 |
| B. Recovery speed | - | - | - |
| 100.00 | 45.52 | ||
The results were obtained from the City Resilience Index (CRI) interface report for cities in the face of hydrometeorological events-the technical component. Index, indicator, and sub-indicator ratings help identify the strengths and weaknesses of the technical component of the city of Cuernavaca. Result analysis shows that the main contributions to the index are indicators 2. Planning Programs and Building Codes, 7. Critical services, 3. Risk assessments, and 1. Infrastructure. All the elements that make up the seven indicators must be enhanced to achieve higher levels of technical resilience, especially indicators 5. Budget assigned to emergency response, 4. Disaster Risk Reduction (DRR) plans and 6. Disaster risk reduction (DRR) institution. Although the assessment shows a medium-range resilience, it is important to note that the rating is very close to a low-range level, and if no corrective actions are taken, such as monitoring the conditions of existing infrastructure and its maintenance or the development of documents, such as the Municipal Risk Atlas, and the respective adjustments and updates to existing documents, the resilience level of Cuernavaca, according to this 2017 assessment, will decrease in future assessments.
The indicator ratings were used to develop a radial graph (Figure 10), which shows the medium-range level obtained.
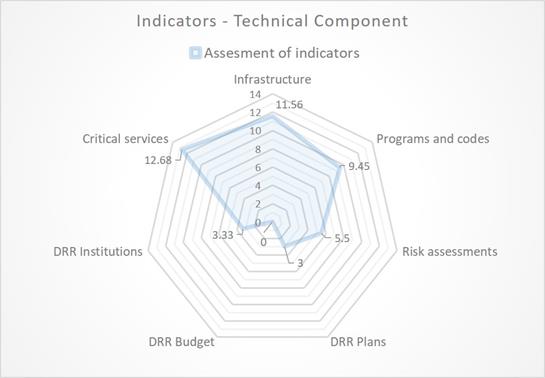
Figure 10 Graph showing the results of the assessment of the city of Cuernavaca. Source: Author's own, with data obtained from the City Resilience Index (CRI) program.
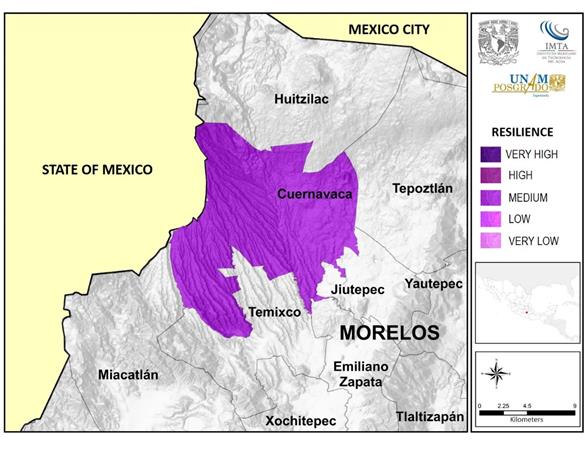
The results of the assessment for the city of Cuernavaca were used for developing the resilience map below (Figure 11).
Discussion and conclusions
The assessment tool presents a very easy methodology and a calculation tool along with a clear description of indicators that have the possibility of being applied to different cities, that can prevent urban centres from reach high vulnerability levels and thus a serious risk of disaster.
The methodology designed for determining the resilience level of the technical component of a city in the face of hydrometeorological events is based on the development of two tools: the main one is the Technical Resilience Index, which has a quantitative approach, and a complementary one, called Technical Profile of Resilience, which has a qualitative approach. The index is composed of nine indicators, 67 sub-indicators, and 52 functions.
The proposed methodology and the assessment tools that were designed represent a reliable method for obtaining the resilience level of the technical component of cities. Based on the index result and the profile analysis, it was possible to identify the weaknesses of the city in the face of hydrometeorological events. Resilience is a dynamic process (Sharifi, 2016); therefore, the resilience level calculated for Cuernavaca is not permanent, and it shows a tendency towards a low-range resilience. If the resilience level is to be improved, it will be necessary to take action soon.
The computer program for calculating the resilience index of cities in the face of hydrometeorological events enables governmental and non-governmental organizations to perform an analysis of the technical resilience of a given city in order to identify strengths and weaknesses, making it a valuable tool for decision makers. The CRI can evolve into a tool that considers all the resilience components of a city and that makes it possible to perform an integrated assessment from technical, economic, social, political, and environmental perspectives.
In order to assess the performance of the Technical Resilience Index for the city of Cuernavaca, this was compared with the Resilience Index at Municipal Level of the National Risk Atlas. The National Center for Disaster Prevention in 2015, designed the Resilience Index at Municipal Level for natural threats with a socio-economic approach (Cenapred, 2015). This index is divided into five sections: 1. Governability, 2. Risk Assessment, 3. Knowledge and education, 4. Risk management and reduction of vulnerability and 5. Disaster preparedness and response; each section includes five indicators. The results of this index, for every municipality of Mexico, is shown in the National Risk Atlas website (Cenapred, 2020).
According to the Resilience Index at Municipal Level of Cenapred, the municipality of Cuernavaca has a very high level of resilience, in contrast with the result of the Technical Resilience Index, which resulted in a medium level of resilience.
As part of this study, the events of 12th July of 2017 were analyzed, when a sinkhole opened in the highway connecting Mexico City and the Pacific coast city of Acapulco, specifically in the stretch named Paso Express located in the City of Cuernavaca; partly as a result of the soil softening caused by rain in the precedent days. In addition, the 19th September earthquake, which caused multiple damaged in the city, was examined.
Those events revealed the level of response from the institutions and their capacity to deal with this sort of emergencies, which is far from corresponds to a very high level of resilience and it is closer to a medium level. In the first case, this is supported by the recommendation No. 34/2018 of the National Commission of Human Rights for the case of the sinkhole of the Paso Express (CNDH, 2018) where is pointed out an unsuitable planning of the project, a lack of decision making from authorities to mitigate the risk before the event, an inadequate protocol implementation during the emergency, an insufficient coordination between institutions belonging to the three levels of government, among other problems. With regard to the earthquake of 19th September, some authors claim that authorities were overtaken by the incident, and in some cases an absence of government aid (García-Carrera, Mena-Hernández, & Bermúdez-Alarcón, 2018; Monroy-Ortiz et al., 2018).
Resilience is a concept that will change the traditional way of looking at risk, by going from a reactive to a proactive approach and by considering risk management as an investment for integrated development. There should be a consensus on what a resilient entity comprises and the characteristics it should have. Governmental and non-governmental, international, national, and local organizations agree that it is essential to create resilience in cities to reduce the probability of catastrophes and prevent risks from becoming disasters. In the next few years there will be dense urban concentrations that will potentiate the effects of hydrometeorological events, causing the probability of socioeconomic losses to grow exponentially. Resilience is a solution for reducing this type of losses, based on the understanding that there is no such thing as zero risk. The characteristics of resilience (resistance, adaptation, recovery, and preparedness), make it ideal to create safer, more efficient, and dynamic cities.
There are three priority aspects that should be addressed in order to enhance the capacity of cities to cope with a disaster situation: one is urban planning, another one is sustainability and the last one is resilience. If these three axes are taken care of, it will be possible to build safe, dynamic, smart, functional, and aesthetic cities, capable of facing whatever crises they might face in the different sectors. This is especially so regarding water security, since a city with water is a city with future. Therefore, water reuse and rainwater harvesting are and will continue to be recurrent topics to provide sustainability and resilience to cities, as well as to generate value in them. We should be prepared for the coming decades, since a greater water stress is expected, where demand will exceed supply (UN-WWAP, 2015).
Resilience strategies should consider the development of sustainable and multipurpose infrastructure, i.e., having one investment solve several problems at a time from social, economic, and environmental perspectives. Infrastructure development and its design, location, and operation should ensure long-term resilience. Poorly planned, poorly constructed, and poorly operated infrastructure leads to risk. Building resilience in cities is already part of some global agenda of governments because urban development projects should consider the risk of hydrometeorological events and climate change in order to give certainty for the continuity of investments.
Mexico is a country with a history of dealing with emergencies with a reactive approach, which has led to managing disasters rather than risk, which is more costly. Therefore, it should evolve to having a proactive approach for an integrated risk management. Greater investments should be made for developing plans that enhance resilience in urban centres that guide the actions that should be implemented for reducing losses due to natural phenomena. Authorities in the three tiers of government should be aware of the fact that the actions taken in the present in relation to urban planning, sustainability, and resilience will ensure future well-being. With the implementation of programs such as the National Program against Drought (PRONACOSE) and the National Program against Hydraulic Contingencies (PRONACCH), Mexico is moving towards a proactive and resilient attitude.
Annexed 1. Values and symbology
|
𝑓𝑎𝑐𝑡𝑜𝑟 𝑓𝑜𝑟 𝑝𝑟𝑒𝑣𝑒𝑛𝑡𝑖𝑜𝑛 𝑝𝑟𝑜𝑔𝑟𝑎𝑚𝑠 |
|
𝑓𝑎𝑐𝑡𝑜𝑟 𝑓𝑜𝑟 𝑒𝑚𝑒𝑟𝑔𝑒𝑛𝑐𝑦 𝑟𝑒𝑠𝑝𝑜𝑛𝑠𝑒 |
|
𝑝𝑒𝑟𝑐𝑒𝑛𝑡𝑎𝑔𝑒 𝑜𝑓 𝑑𝑎𝑚𝑎𝑔𝑒 (%) |
|
ℎ𝑖𝑠𝑡𝑜𝑟𝑖𝑐 𝑝𝑒𝑟𝑐𝑒𝑛𝑡𝑎𝑔𝑒 𝑜𝑓 𝑖𝑛𝑣𝑒𝑠𝑡𝑚𝑒𝑛𝑡 𝑜𝑛 𝐷𝑅𝑅 (%) |
|
𝑦𝑒𝑎𝑟 𝑖𝑛 𝑤ℎ𝑖𝑐ℎ 𝑡ℎ𝑒 𝑎𝑠𝑠𝑒𝑠𝑠𝑚𝑒𝑛𝑡 𝑖𝑠 𝑝𝑒𝑟𝑓𝑜𝑟𝑚𝑒𝑑 (years) |
|
𝑦𝑒𝑎𝑟 𝑜𝑓 𝑖𝑛𝑓𝑟𝑎𝑠𝑡𝑟𝑢𝑐𝑡𝑢𝑟𝑒 𝑐𝑜𝑛𝑠𝑡𝑟𝑢𝑐𝑡𝑖𝑜𝑛 (years) |
|
𝑦𝑒𝑎𝑟 𝑖𝑛 𝑤ℎ𝑖𝑐ℎ 𝑑𝑖𝑠𝑎𝑠𝑡𝑒𝑟 𝑜𝑐𝑢𝑟𝑟𝑒𝑑 (years) |
|
𝑦𝑒𝑎𝑟 𝑡ℎ𝑒 𝑑𝑜𝑐𝑢𝑚𝑒𝑛𝑡 𝑤𝑎𝑠 𝑖𝑠𝑠𝑢𝑒𝑑 (years) |
|
economic impact due to tropical cyclones in the city ($) |
|
𝑠𝑢𝑝𝑝𝑙𝑦 𝑝𝑒𝑟 𝑖𝑛ℎ𝑎𝑏𝑖𝑡𝑎𝑛𝑡 𝑝𝑒𝑟 𝑑𝑎𝑦 𝑖𝑛 𝑡ℎ𝑒 𝑐𝑖𝑡𝑦 (l (/inhab)⁄day) |
|
economic impact due to droughts in the city ($) |
|
S𝑢𝑝𝑝𝑙𝑦 𝑝𝑒𝑟 𝑖𝑛ℎ𝑎𝑏𝑖𝑡𝑎𝑛𝑡 𝑝𝑒𝑟 𝑑𝑎𝑦 𝑟𝑒𝑐𝑜𝑚𝑚𝑒𝑛𝑑𝑒𝑑 𝑏𝑦 𝑡ℎ𝑒 𝑊𝑜𝑟𝑙 𝐻𝑒𝑎𝑙𝑡ℎ 𝑂𝑟𝑔𝑎𝑛𝑖𝑧𝑎𝑡𝑖𝑜𝑛 (l (/inhab)⁄day) |
|
𝑑𝑒𝑚𝑎𝑛𝑑 𝑓𝑜𝑟 𝑢𝑟𝑏𝑎𝑛 𝑠𝑢𝑝𝑝𝑙𝑦 (hm3) |
|
𝑖𝑛𝑑𝑖𝑐𝑎𝑡𝑜𝑟 𝑜𝑓 𝑔𝑙𝑜𝑏𝑎𝑙 𝑒𝑓𝑓𝑖𝑐𝑖𝑒𝑛𝑐𝑦 𝑜𝑓 𝑡ℎ𝑒 𝑊𝑎𝑡𝑒𝑟 𝑈𝑡𝑖𝑙𝑖𝑡𝑖𝑒𝑠 𝑀𝑎𝑛𝑎𝑔𝑒𝑚𝑒𝑛𝑡. 𝐼𝑛𝑑𝑖𝑐𝑎𝑡𝑜𝑟 𝑃𝑟𝑜𝑔𝑟𝑎𝑚 (PIGOO) |
|
economic impact due to floods in the city ($) |
|
𝑐o𝑛𝑛𝑒𝑐𝑡𝑖𝑛𝑔 𝑓𝑎𝑐𝑡𝑜𝑟 𝑖𝑛 𝐴𝑚𝑒𝑟𝑖𝑐𝑎 𝑏𝑒𝑡𝑤𝑒𝑒𝑛 𝑡ℎ𝑒 𝑛𝑢𝑚𝑏𝑒𝑟 𝑜𝑓 ℎ𝑜𝑠𝑝𝑖𝑡𝑎𝑙 𝑏𝑒𝑑𝑠 𝑎𝑛𝑑 𝑡ℎ𝑒 𝑝𝑜𝑝𝑢𝑙𝑎𝑡𝑖𝑜𝑛 |
|
𝑐𝑜𝑛𝑛e𝑐𝑡𝑖𝑛𝑔 𝑓𝑎𝑐𝑡𝑜𝑟 𝑛𝑎𝑡𝑖𝑜𝑛𝑤𝑖𝑑𝑒 𝑜𝑓 𝑠𝑡𝑢𝑑𝑒𝑛𝑡 𝑝𝑜𝑝𝑢𝑙𝑎𝑡𝑖𝑜𝑛 𝑎𝑛𝑑 𝑛𝑢𝑚𝑏𝑒𝑟 𝑜𝑓 𝑠𝑐ℎ𝑜𝑜𝑙𝑠 |
|
𝑐𝑜𝑛𝑛𝑒𝑐𝑡𝑖𝑛𝑔 𝑓𝑎𝑐𝑡𝑜r 𝑏𝑒𝑡𝑤𝑒𝑒𝑛 𝑡ℎ𝑒 𝑝𝑜𝑝𝑢𝑙𝑎𝑡𝑖𝑜𝑛 𝑎𝑛𝑑 𝑡𝑟𝑎𝑖𝑛𝑒𝑑 𝑝𝑒𝑟𝑠𝑜𝑛𝑛𝑒𝑙 |
|
𝑐𝑜𝑛𝑛𝑒𝑐𝑡𝑖𝑛𝑔 𝑓𝑎𝑐𝑡𝑜𝑟 𝑏𝑒𝑡𝑤𝑒𝑒𝑛 𝑡ℎ𝑒 𝑝𝑜𝑝𝑢𝑙𝑎𝑡𝑖𝑜𝑛 𝑎𝑛𝑑 𝑛𝑢𝑚𝑏𝑒𝑟 𝑜𝑓 𝑢𝑛𝑖𝑡𝑠 |
|
economic impact due to frosts in the city ($) |
|
𝑎𝑚𝑜𝑢𝑛𝑡 𝑜𝑓 𝑤𝑎𝑡𝑒𝑟 𝑡𝑟𝑒𝑎𝑡𝑒𝑑 𝑖𝑛 𝑡ℎ𝑒 𝑐𝑖𝑡𝑦 (hm3) |
|
𝑎𝑚𝑜𝑢𝑛𝑡 𝑜𝑓 𝑤𝑎𝑡𝑒𝑟 𝑢𝑠𝑒𝑑 𝑏𝑦 𝑡ℎ𝑒 𝑐𝑖𝑡𝑦 (hm3) |
|
economic impact due to hydrometeorological events in the city ($) |
|
𝑖𝑛𝑣𝑒𝑠𝑚𝑒𝑛𝑡 𝑜𝑛 𝑖𝑛𝑓𝑟𝑎𝑠𝑡𝑟𝑢𝑐𝑡𝑢𝑟𝑒 𝑖𝑛 𝑡ℎ𝑒 𝑐𝑢𝑟𝑟𝑒𝑛𝑡 𝑝𝑒𝑟𝑖𝑜𝑑 ($) |
|
𝑖𝑛𝑣𝑒𝑠𝑚𝑒𝑛𝑡 𝑜𝑛 𝑖𝑛𝑓𝑟𝑎𝑠𝑡𝑟??𝑐𝑡𝑢𝑟𝑒 𝑖𝑛 𝑡ℎ𝑒 𝑝𝑟𝑒𝑣𝑖𝑜𝑢𝑠 𝑝𝑒𝑟𝑖𝑜𝑑 ($) |
|
𝑏𝑢𝑑𝑔𝑒𝑡 𝑎𝑙𝑙𝑜𝑐𝑎𝑡𝑒𝑑 𝑓𝑜𝑟 𝑒𝑞𝑢𝑖𝑝𝑚𝑒𝑛𝑡 𝑎𝑐𝑞𝑢𝑖𝑠𝑖𝑡𝑖𝑜𝑛 ($) |
|
𝑡𝑎𝑘𝑒𝑠 𝑣𝑎𝑙𝑢𝑒𝑠 𝑓𝑟𝑜𝑚 1 𝑡𝑜 𝑛 |
|
𝑖𝑛𝑣𝑒𝑠𝑚𝑒𝑛𝑡 𝑜𝑛 𝑚𝑎𝑖𝑛𝑡𝑒𝑛𝑎𝑛𝑐𝑒 𝑖𝑛 𝑡ℎ𝑒 𝑐𝑢𝑟𝑟𝑒𝑛𝑡 𝑝𝑒𝑟𝑖𝑜𝑑 ($) |
|
𝑖𝑛𝑣𝑒𝑠𝑚𝑒𝑛𝑡 𝑜𝑛 𝑚𝑎𝑖𝑛𝑡𝑒𝑛𝑎𝑛𝑐𝑒 𝑖𝑛 𝑡ℎ𝑒 𝑝𝑟𝑒𝑣𝑖𝑜𝑢𝑠 𝑝𝑒𝑟𝑖𝑜𝑑 ($) |
|
𝑜𝑟𝑖𝑔𝑖𝑛𝑎𝑙 𝑎𝑚𝑜𝑢𝑛𝑡 𝑜𝑓 𝑤𝑜𝑟𝑘 ($) |
|
𝑛𝑢𝑚𝑏𝑒𝑟 𝑜𝑓 𝑖𝑛𝑓𝑟𝑎𝑠𝑡𝑟𝑢𝑐𝑡𝑢𝑟𝑒 𝑑𝑎𝑚𝑎𝑔𝑒 |
|
𝑚𝑎𝑥𝑖𝑚𝑢𝑚 𝑛𝑢𝑚𝑏𝑒𝑟 𝑜𝑓 𝑦𝑒𝑎𝑟𝑠 𝑓𝑜𝑟 𝑐𝑜𝑛𝑠𝑖𝑑𝑒𝑟𝑖𝑛𝑔 𝑎 𝑑𝑜𝑐𝑢𝑚𝑒𝑛𝑡 𝑡𝑜 𝑏𝑒 𝑢𝑝𝑑𝑎𝑡e𝑑 (years) |
|
𝑛𝑢𝑚𝑏𝑒𝑟 𝑜𝑓 𝑎𝑚𝑏𝑢𝑙𝑎𝑛𝑐𝑒𝑠 (ambulances) |
|
𝑛𝑢𝑚𝑏𝑒𝑟 𝑜𝑓 ℎ𝑜𝑠𝑝𝑖𝑡𝑎l 𝑏𝑒𝑑𝑠 𝑖𝑛 𝑡ℎ𝑒 𝑐𝑖𝑡𝑦 (beds) |
|
𝑒𝑞𝑢𝑎𝑙𝑠 0 |
|
𝑛𝑢𝑚𝑏𝑒𝑟 𝑜𝑓 𝑡𝑟𝑎𝑖𝑛𝑒𝑑 𝑝𝑒𝑟𝑠𝑜𝑛𝑛𝑒𝑙 |
|
𝑛𝑢𝑚𝑏𝑒𝑟 𝑜𝑓 𝑏𝑎𝑠𝑖𝑐 𝑒𝑑𝑢𝑐𝑎𝑡𝑖𝑜𝑛 𝑠𝑐ℎ𝑜𝑜𝑙𝑠 𝑖𝑛 𝑡ℎ𝑒 𝑐𝑖𝑡𝑦 (schools) |
|
𝑛𝑢𝑚𝑏𝑒𝑟 𝑜𝑓 w𝑜𝑟𝑘𝑠 𝑒𝑥𝑒𝑐𝑢𝑡𝑒𝑑 𝑢𝑛𝑑𝑒𝑟 𝑠𝑢𝑝𝑒𝑟𝑣𝑖𝑠𝑖𝑜𝑛 𝑜𝑓 𝑎 𝐶ℎ𝑖𝑒𝑓 𝐶𝑜𝑛𝑠𝑡𝑟𝑢𝑐𝑡𝑖𝑜𝑛 𝑀𝑎𝑛𝑎𝑔𝑒𝑟 |
|
𝑜𝑡ℎ𝑒𝑟 𝑑𝑒𝑚𝑎𝑛𝑑𝑠 (hm3) |
|
𝑛𝑢𝑚𝑏𝑒𝑟 𝑜𝑓 𝑤𝑜𝑟𝑘𝑠 𝑒𝑥𝑒𝑐𝑢𝑡𝑒𝑑 |
|
𝑛𝑢𝑚𝑏𝑒𝑟 𝑜𝑓 𝑖𝑛ℎ𝑎𝑏𝑖𝑡𝑎𝑛𝑡𝑠 𝑤𝑖𝑡ℎ 24−ℎ 𝑑𝑟𝑖𝑛𝑘𝑖𝑛𝑔 𝑤𝑎𝑡𝑒𝑟 𝑠𝑒𝑟𝑣𝑖𝑐𝑒𝑠 (inhab) |
|
𝑛𝑢𝑚𝑏𝑒𝑟 𝑜𝑓 𝑖𝑛ℎ𝑎𝑏𝑖𝑡𝑎𝑛𝑡𝑠 𝑤𝑖𝑡ℎ 𝑒𝑙𝑒𝑐𝑡𝑟𝑖𝑐𝑖𝑡𝑦 𝑠𝑒𝑟𝑣𝑖𝑐𝑒 (inhab) |
|
𝑛𝑢𝑚𝑏𝑒𝑟 𝑜𝑓 𝑖𝑛ℎ𝑎𝑏𝑖𝑡𝑎𝑛𝑡𝑠 𝑖𝑛 𝑡ℎ𝑒 𝑐𝑖𝑡𝑦 (inhab) |
|
𝑏𝑢𝑑𝑔𝑒𝑡 𝑜𝑓 𝑡ℎ𝑒 𝑐𝑖𝑡𝑦 ($) |
|
𝑏𝑢𝑑𝑔𝑒𝑡 𝑎𝑙𝑙o𝑐𝑎𝑡𝑒𝑑 𝑓𝑜𝑟 𝑒𝑚𝑒𝑟𝑔𝑒𝑛𝑐𝑦 𝑟𝑒𝑠𝑝𝑜𝑛𝑠𝑒 ($) |
|
𝑛𝑢𝑚𝑏𝑒𝑟 𝑜𝑓 𝑖𝑛ℎ𝑎𝑏𝑖𝑡𝑎𝑛𝑡𝑠 𝑠𝑒𝑡𝑡𝑙𝑒𝑑 𝑖𝑛 𝑟𝑖𝑠𝑘 𝑎𝑟𝑒𝑎s 𝑤𝑖𝑡ℎ𝑖𝑛 𝑡ℎ𝑒 𝑐𝑖𝑡𝑦 (inhab) |
|
𝑏𝑢𝑑𝑔𝑒𝑡 𝑎𝑙𝑙𝑜𝑐𝑎𝑡𝑒𝑑 𝑡𝑜 𝑡ℎ𝑒 𝑑𝑒𝑣𝑒𝑙𝑜𝑝𝑚𝑒𝑛𝑡 𝑜𝑓 𝐷𝑅𝑅 𝑝𝑙𝑎𝑛𝑠 𝑎𝑛𝑑 𝑝𝑟𝑜𝑔𝑟𝑎𝑚𝑠 ($) |
|
𝑛𝑢𝑚𝑏𝑒𝑟 𝑜𝑓 𝑖𝑛ℎ𝑎𝑏𝑖𝑡𝑎𝑛𝑡𝑠 𝑤𝑖𝑡ℎ 𝑠𝑒𝑤𝑒𝑟𝑎𝑔𝑒 𝑠𝑒𝑟𝑣𝑖𝑐𝑒𝑠 (inhab) |
|
𝑛𝑢𝑚𝑏𝑒𝑟 𝑜𝑓 𝑏𝑎𝑠𝑖𝑐 𝑒𝑑𝑢𝑐𝑎𝑡𝑖𝑜𝑛 𝑠𝑡𝑢𝑑𝑒𝑛𝑡𝑠 𝑖𝑛 𝑡ℎ𝑒 𝑐𝑖𝑡𝑦 (students) |
|
𝑛𝑢𝑚𝑏𝑒𝑟 𝑜𝑓 𝑖𝑛ℎ𝑎𝑏𝑖t𝑎𝑛𝑡𝑠 𝑤𝑖𝑡ℎ 𝑑𝑟𝑖𝑛𝑘𝑖𝑛𝑔 𝑤𝑎𝑡𝑒𝑟 𝑠𝑒𝑟𝑣𝑖𝑐𝑒s (inhab) |
|
𝑛𝑢𝑚𝑏𝑒𝑟 𝑜𝑓 𝑠𝑢𝑝𝑒𝑟𝑣𝑖𝑠𝑖𝑜𝑛𝑠 𝑚𝑎𝑑𝑒 𝑝𝑒𝑟 𝑦𝑒𝑎𝑟 |
|
𝑎𝑣𝑎𝑖𝑙𝑎𝑏𝑙𝑒 𝑔𝑢𝑎𝑟𝑎𝑛𝑡𝑒𝑒𝑑 𝑟𝑒𝑠𝑜𝑢𝑟𝑐𝑒𝑠 (hm3) |
|
economic impact due to severe storms in the city ($) |
|
𝑔𝑟𝑜𝑤𝑡ℎ 𝑟𝑎𝑡𝑒 𝑖𝑛 𝑡ℎ𝑒 𝑐𝑢𝑟𝑟𝑒𝑛𝑡 𝑝𝑒𝑟𝑖𝑜𝑑 (%) |
|
𝑔𝑟𝑜𝑤𝑡ℎ 𝑟𝑎𝑡𝑒 𝑖𝑛 𝑡ℎ𝑒 𝑝𝑟𝑒𝑣𝑖𝑜𝑢𝑠 𝑝𝑒𝑟𝑖𝑜𝑑 (%) |
|
𝑡𝑖𝑚𝑒 𝑜𝑓 𝑒𝑥𝑒𝑐𝑢𝑡𝑖𝑜𝑛 𝑜𝑓 𝑡ℎ𝑒 𝑖𝑛𝑓𝑟𝑎𝑠𝑡𝑟𝑢𝑐𝑡𝑢𝑟𝑒 (months) |
|
𝑟𝑒𝑐𝑜𝑛𝑠𝑡𝑟𝑢𝑐𝑡𝑖𝑜𝑛 𝑡𝑖𝑚𝑒 (months) |
|
𝑛𝑢𝑚𝑏𝑒𝑟 𝑜𝑓 𝑡𝑟𝑒𝑎𝑡𝑚𝑒𝑛𝑡 𝑝𝑙𝑎𝑛𝑡𝑠 𝑖𝑛 𝑜𝑝𝑒𝑟𝑎𝑡𝑖𝑜 |
|
𝑛𝑢𝑚𝑏𝑒𝑟 𝑜𝑓 𝑡𝑟𝑒𝑎𝑡𝑚𝑒𝑛𝑡 𝑝𝑙𝑎𝑛𝑡𝑠 𝑖𝑛 𝑡ℎ𝑒 𝑐𝑖𝑡𝑦 (months) |
|
𝑒𝑛𝑣𝑖𝑟𝑜𝑛𝑚𝑒𝑛𝑡𝑎𝑙 𝑑𝑒𝑚𝑎𝑛𝑑 (hm3) |
|
𝑒𝑞𝑢𝑎𝑙𝑠 1 |

