


 texto en
  Inglés (pdf)
 Artículo en XML
 Referencias del artículo
 Enviar artículo por email
 Citado por SciELO
  Similares en
SciELO
Similares en
SciELO 
 Permalink
Introduction
Mountain forests at elevations of 2 500 m or more account for 23 % of the Earth's forested area, covering about 9 000 000 km2 (Price et al., 2011), which is crucial in regulating climate and water cycles. However, their capacity to store carbon (C) under cooler temperatures remains less understood. Globally, forests store 1.146 petagrams (Pg) of C, with two-thirds of this amount contained within the soil (Dixon et al., 1994). Mountain soils hold greater carbon reserves than forests at lower elevations (below 1 000 m) due to lower temperatures that reduce decomposition rates (Swetnam et al., 2017; Wiesmeier et al., 2019).
As sensitive terrestrial ecosystems, mountain forests face significant risks from climate change (Pepin et al., 2015). Increasing temperatures could impact soil carbon stocks, especially in tropical regions with more intense warming at higher elevations (Field et al., 2014). Temperature increases in mountain ecosystems may simultaneously enhance soil organic carbon (SOC) inputs and outputs (Davidson & Janssens, 2006; Wiesmeier et al., 2019).
Two hypotheses explain these effects. The first proposes that higher temperatures enhance the decomposition of soil organic matter (SOM), leading to increased CO2 emissions from the soil, thereby creating a positive feedback loop (Kirschbaum, 2000). The second posits that faster SOM decomposition boosts soil nitrogen (N) availability, enhancing plant productivity, litter production, and SOC input (negative feedback) (Berg & Meentemeyer, 2002). The net warming effect remains uncertain, this is influenced by the spatial heterogeneity of mountain forests, which is driven by both biotic factors (such as plant species) and abiotic factors (including soil type, depth, slope, and elevation), along with their interactions (Kumar et al., 2012; Salomé et al., 2010).
SOC stability depends on physical protection (e. g., aggregates), chemical reactions, and soil biota activity (e. g., fungi, bacteria, roots) (Wiesmeier et al., 2019). Elevation gradients, used as proxies for temperature, provide realistic conditions to assess warming impacts on SOC (Körner, 2007; Tito et al., 2020). Research has revealed varying SOC-elevation relationships: negative (Kumar et al., 2012; Sheikh et al., 2009), positive (Du et al., 2014; Tashi et al., 2016), or none (Tewksbury & Van Miegroet, 2007; Zhu et al., 2010). High-elevation SOC accumulation is often linked to lower temperatures (Tashi et al., 2016), while factors like harvesting and logging strongly affect lowland forests (Jafari et al., 2013). Logging reduces SOC by 8-11.2 % globally, with effects lasting up to 45 years (Chiti et al., 2016; James & Harrison, 2016).
More than 50 % of Mexico's land area is situated at elevations exceeding 1 000 m (Challenger, 1998). Pinus hartwegii Lindl., a dominant mountain pine found at 3 500-4 000 masl, offers a unique opportunity to study ecological processes across elevation gradients. Climate change is driving an upward redistribution of this species, reducing its environmental suitability and potentially affecting ecosystem services like climate regulation and SOC storage (Cruz-Cárdenas et al., 2016; Gómez-Mendoza & Arriaga, 2007). These forests mainly thrive on Andosols, volcanic soils known for their high content of SOM, and their considerable potential for SOC sequestration (Neall, 2006). Including SOC stored in these soils in national carbon inventories is essential, as past efforts have focused mainly on above-ground carbon (Santini et al., 2019). This research aimed to determine how edaphic, climatic and vegetation variables influence the distribution of soil organic carbon (SOC) stocks along an elevation gradient in the P. hartwegii forest at Nevado de Toluca, Mexico, using elevation as a temperature proxy to understand warming's impact on mountain forest SOC stocks.
Materials and Methods
Study sites
The study took place in Nevado de Toluca Flora and Fauna Protected Area (FFPA) (19°06′06″ N, 99°46′03″ W), about 23 km Southwest of Toluca City, State of Mexico. Andosols cover 90 % of the area (Körner & Paulsen, 2004). The isothermal climate has a mean annual temperature (MAT) of -2 to 5 °C (García, 1990). Based on historical precipitation records from 1961 to 2016, rainfall in Toluca occurs mainly from May to October. July was the month with the most abundant rainfall, exceeding 200 mm (Figure 1).
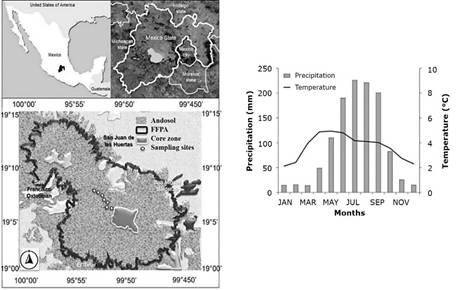
San Francisco Oxtotilpan = San Francisco Oxtotilpan town; San Juan de las Huertas = San Juan de las Huertas town; San Miguel Balderas = San Miguel Balderas town. The region is dominated by Andosol soil (Organización de las Naciones Unidas para la Alimentación y la Agricultura [ONUAA], 2008). The climate diagram shows data for the 1961-2016 period from a meteorological station at 4 139 m (19°07'33" N, 99°46'15" W).
Figure 1 The geographical location of Mexico and the Nevado de Toluca Flora and Fauna Protected Area in the State of Mexico, where sampling was conducted.
Vegetation varies with altitude. P. hartwegii forests dominate the range between 3 500 and 4 000 m and typically reach heights of 25-35 m, but their size becomes smaller at higher elevations (Alfaro-Ramírez et al., 2017). Other tree species, such as Pinus L., Quercus L., Arbutus L. and Juniperus L. are occasionally interspersed. Understory includes grasses such as Penstemon gentianoides (Kunth) Poir., Eupatorium glabratum Kunth, Baccharis conferta Kunth, Muhlenbergia quadridentata (Kunth) Trin., M. macroura (Kunth) Hitchc., Festuca tolucensis Kunth, F. hephaestophila (Nees) Nees and patches of Lupinus sp. (Rzedowski, 1991).
Fieldwork sampling
Stratified random sampling was performed along an elevation gradient from 3 400 to 4 000 m on the Northeastern slope of Nevado de Toluca (Figure 1; Table 1). Seven elevation plots were established at 100 m intervals, ensuring homogeneity in slope and forest conditions. Soil sampling and vegetation measurements were done by plot after choosing ten healthy P. hartwegii trees with normal diameters (ND) between 10 and 30 cm.
Table 1 General characteristics of sampling sites in Pinus hartwegii Lindl. forest along an elevation gradient from 3 400 to 4 000 m at Nevado de Toluca, State of Mexico, Mexico.
| Elevation plots (m) |
Average slope (%) | Slope face |
Canopy cover (%) |
Tree density (trees ha-1) |
Tree height (m) |
Tree diameter (m) |
Grass cover (%) |
Herb and shrub density (plants ha-1) |
|---|---|---|---|---|---|---|---|---|
| 4 000 | 13.44 (±0.94) |
Northeast | 45 | 306.25 (±131.10) |
10.61 (±2.76) |
0.30 (±0.01) |
73 | 0 |
| 3 900 | 14.37 (±3.16) |
Northeast | 43 | 243.75 (±90.36) |
10.35 (±0.69) |
0.23 (±0.01) |
80 | 0 |
| 3 800 | 10.94 (±1.86) |
Northeast | 103 | 1 400.00 (±619.67) |
9.99 (±3.92) |
0.20 (±0.06) |
49 | 0 |
| 3 700 | 17.81 (±3.08) |
Northeast | 48 | 1 250.00 (±459.09) |
5.63 (±0.65) |
0.11 (±0.02) |
31 | 250 (±135.02) |
| 3 600 | 11.04 (±1.96) |
Northeast | 87 | 706.25 (±336.24) |
6.66 (±1.15) |
0.16 (±0.03) |
84 | 37.50 (±37.50) |
| 3 500 | 25.94 (±3.51) |
Northeast | 50 | 425.00 (±186.63) |
8.48 (±2.12) |
0.18 (±0.04) |
70 | 37.50 (±37.50) |
| 3 400 | 17.19 (±1.48) | Northeast | 69 | 406.25 (±69.97) | 7.16 (±1.20) | 0.23 (±0.04) | 73 | 31.25 (±31.25) |
Two soil samples, each 15 cm deep, were taken from the base of each tree and 50 cm from the trunk base (upslope and downslope), using a 10 cm diameter PVC pipe (20 samples per site; a total of 140 soil samples were obtained). PVC tubes were used to collect undisturbed soil samples, which were taken to the laboratory of the Institute of Agricultural and Rural Sciences of the Autonomous University of the State of Mexico, where they were processed.
In regard to vegetation sampling, it followed the National Forest and Soil Inventory (Infys) (Comisión Nacional Forestal [Conafor], 2025) method, organized in clusters following an inverted "Y" pattern. Each cluster covered one hectare (56.42 m radius) and included four permanent 400 m2 plots (11.28 m radius). Within 400 m2 plots, all woody plants with ND≥5 cm were measured, including stem ND (model 283D/5m Forestry Suppliers Inc® diameter tape), total height (model FP550 Nikon Forestry Pro II® laser hypsometer), crown diameter (model 283D/5m Forestry Suppliers Inc® diameter tape) and condition (alive, dead, or damaged). In 80 m2 plots (5.04 m radius), shrubs and trees with ND between 2.5 and 5 cm were measured (model 283D/5m Forestry Suppliers Inc® diameter tape) to characterize the shrub layer. Herbaceous strata were evaluated in 9 m2 plots (0.3 m radius).
Soil analysis
Each of the 140 soil samples was weighed (model AX423E Ohaus Adventurer® precision balance) for total weight. The cylinder method determined the bulk density (BD) of undisturbed soil samples (Elliott et al., 1999). The soil samples were carefully extracted from the PVC pipes. Rocks and visible organic material were removed by hand, and each component was weighed. The soil samples were then passed through a 2 mm sieve (Grainger® stainless steel sieve). SOM content was determined following the oxide-reduction method (Walkley & Black, 1934), and subsequently, the SOC content (%) was estimated. SOC stocks were obtained using the Equation 1, considering a 15 cm depth sample:
Where:
SOC = Soil organic carbon
SOC (%) = Soil organic carbon percentage
BD = Bulk density (g cm-3)
Results are reported in Mg C ha-1. Soil pH was measured with 1:2 solutions of 1-N KCl using a model pH/CON 500 OAKTON® potentiometer (Robertson et al., 1999). Soil texture was determined following the Bouyoucos method (Bouyoucos, 1962) and characterized according to the United States Department of Agriculture’s textural triangle (United States Department of Agriculture [USDA], 2014). Climate data, including mean annual temperature (MAT) and precipitation (MAP), were derived from the ClimateNA model v5.10 (Wang et al., 2016).
Data analysis
To evaluate differences among elevation plots, one-way analysis of variance (ANOVA) was conducted for soil variables (SOC, BD, pH, sand, clay and silt), validating the normal distribution of residuals for all. Linear regressions analyzed elevation's effects regarding SOC stocks and related variables (Kutner et al., 2005). Soil samples from uphill and downhill positions near each tree were averaged, providing 70 data points per variable.
Pearson’s correlations examined relationships between soil variables, tree structure variables, grass cover, herb and shrub density, MAT and MAP. Principal Component Analysis (PCA) was conducted using 70 data points to analyze variation among trees within the plots, excluding one variable from each pair with a high correlation (r>0.90) to avoid multicollinearity (Chen, 2012). The logging impact was assessed using one-way ANOVA with a dichotomous variable ("logged" vs. "unlogged"). Logged plots were between 3 400 and 3 800 m, whereas unlogged plots were from 3 900 to 4 000 m. Analyses were conducted in R (v4.4.3) (R Core Team, 2017) and JMP (v9.1) (Statistical Analysis System [SAS], 2004), with a 95 % confidence level (α≤0.05), except for Pearson correlations, which were tested at a 99 % confidence level.
Results and Discussion
SOC stocks and soil characteristics along the elevation gradient
Soil characteristics varied significantly with elevation. SOC stocks were highest at 4 000 m, with a value of 173.0±5.2 Mg C ha-1, and lowest at 3 700 m, where SOC stocks were 146.8±5.72 Mg C ha-1, representing 16 % decrease (Figure 2). This aligns with the role of SOM derived from aboveground litter as the primary organic carbon source in soils (de la Cruz-Amo et al., 2020; Six et al., 2004).
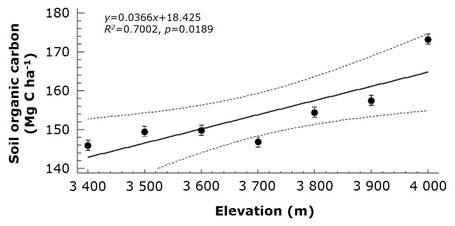
The data are presented as means±standard error (SE), with the dotted lines indicating the 95 % confidence interval.
Figure 2 SOC stocks in the topsoil from 0 to 15 cm beneath the Pinus hartwegii Lindl. forest along a 600 m elevation gradient (3 400 to 4 000 masl).
The decline in MAT along the elevation gradient (0.5 °C per 100 m, ClimateNA), coupled with increased SOM and SOC stocks, specifies that lower temperatures at higher elevations reduce litter decomposition rates, slow turnover, and prolong SOC residence times (Becker et al., 2019; Tashi et al., 2016). Salinas et al. (2010) found that temperature accounts for up to 95 % of the variability in organic matter (OM) decomposition in forests at high elevations. In a similar way, Garten and Hanson (2006) reported SOC stocks increase with elevation in the Appalachian Mountains, with residence times rising from 11 to 31 years due to slower SOM decomposition. Tian et al. (2016) highlighted that the residence time of SOC also depends on labile SOC fractions, suggesting both factors likely affect SOC dynamics in P. hartwegii forests, though specific studies are lacking. At higher elevations (3 900-4 000 m), soil pH was lowest, reaching 4.92±0.11 at 3 900 m. Sand content increased with elevation, peaking at 63.30±1.40 % at 4 000 m; clay content was lowest at 3 900 m, measuring 13.7±0.97 %, while silt at 3 800 m (23.12±1.15 %). SOC stocks, SOM, and sand content positively correlated with elevation (r 2 =0.70, p=0.02; r 2 =0.55, p=0.01; r 2 =0.72, p=0.01, respectively). Other variables, including BD, pH, clay, and silt, showed no significant elevation-related trends. These results suggest that SOC stocks at higher elevations are more influenced by accumulation than stabilization processes (Figure 3).
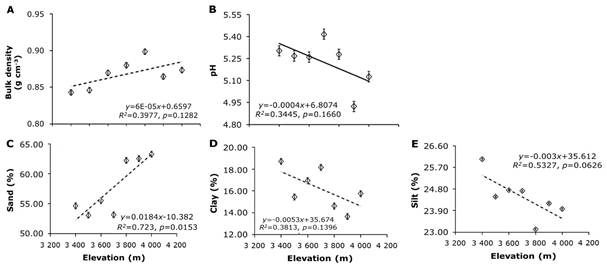
A = BD; B = pH; C = Sand content; D = Clay content; E = Silt content. The data are presented as means±standard error (SE), with the dotted lines indicating the 95 % confidence interval.
Figure 3 Variables of topsoil under Pinus hartwegii Lindl. forest along a 600 m elevation gradient (3 400 to 4 000 m).
Soil texture influences both SOC and BD: soils with a high sand content generally exhibit higher BD and lower SOC, whereas soils with lower BD tend to have higher organic carbon content (Lukac & Godbold, 2011). In mountain volcanic soils, sand content tends to increase with elevation due to the presence of volcanic ash and diminished rock weathering, resulting in shallower and coarser soils (Simon et al., 2018). Andosols, characterized by low BD (<0.9 g cm-3) due to the weathering of volcanic glass in the sand and silt fractions (Delmelle et al., 2015), display BD variations driven by the arrangement of minerals and organic matter (Neall et al., 2006). These soils store 42-207 Mg OC ha-1, stabilized by aluminum-organic matter complexes in upper horizons (Covaleda et al., 2011; Msanya et al., 2007). The role of sand content in the stabilization of SOC in young soils derived from volcanic ash remains underexplored. PCA revealed variability across elevation plots: PC1 (38.56 % of variability) was driven by tree height, sand content, and SOC stocks, while PC2 (17.06 %) was influenced by clay, silt, and pH. High-elevation trees (3 800-4 000 m) showed greater dispersion along PC1, mid-elevation trees (3 700 m) clustered tightly, and lower-elevation trees (3 400-3 600 m) grouped along PC2 (Figure 4).
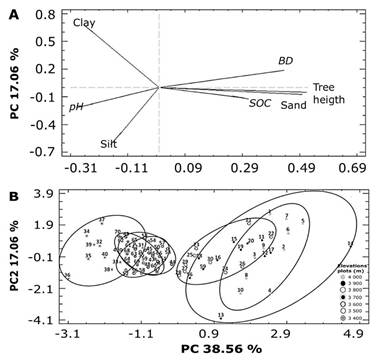
A = Orientation of the variable groups toward PC1 or PC2; B = Spatial variation of the sampling points about the first two PCs illustrates the structure and pattern of variation of the original variables assessed at the sampling sites.
Figure 4 The relationship between the primary original variables and the first two principal components (PCs) is shown.
Larger trees at higher elevations likely contributed to higher SOM levels due to increased litterfall, which could explain the higher SOC stocks observed in these plots. However, environmental constraints such as low CO2 partial pressure, short growing seasons, soil nutrient limitations, and low temperatures typically restrict tree growth at higher elevations (Alfaro-Ramírez et al., 2017; Correa-Díaz et al., 2019).
Relationship between elevation, soil characteristics, climate and vegetation structure
Elevation exhibited a positive correlation with SOC stocks (r=0.84, p=0.04), sand content (r=0.85, p=0.03), and tree density of the sampled trees (r=0.83, p=0.04), but a negative correlation with MAT (r=-0.99, p=0.00). SOC stocks showed a positive correlation with sand content (r=0.80, p=0.04) and tree density of the sampled trees (r=0.95, p=0.00), and an inverse correlation with MAT (r=-0.84, p=0.04). Sand content was negatively correlated with clay content (r=-0.71, p=0.05) and MAT (r=-0.85, p=0.01). MAT and MAP displayed a strong negative relationship (r=-0.99, p=0.03). Grass cover increased as tree density (r=-0.82, p=0.02) and herb and shrub cover decreased (r=-0.75, p=0.04). Herb and shrub cover were reduced with the increase in tree height (r=-0.75, p= 0.04) (Table 2).
Table 2 Pearson correlations between physical and chemical properties of topsoil, climatic variables (MAT and MAP), and vegetation structure variables observed along the elevation gradient in the Pinus hartwegii Lindl. forest at Nevado de Toluca, State of Mexico, Mexico.
| SOC | Elevation | BD | pH | Sand | Clay | Silt | MAT | MAP | Canopy cover |
Tree density |
Trees diameter |
Tree height |
Grass cover |
Herb and shrub density |
|
|---|---|---|---|---|---|---|---|---|---|---|---|---|---|---|---|
| Elevation | 0.84* | 1 | |||||||||||||
| BD | 0.29 | 0.64 | 1 | ||||||||||||
| pH | -0.59 | -0.59 | 0.08 | 1 | |||||||||||
| Sand | 0.80* | 0.85* | 0.51 | -0.71* | 1 | ||||||||||
| Clay | -0.5 | -0.62 | -0.3 | 0.74* | -0.71* | 1 | |||||||||
| Silt | -0.53 | -0.73* | -0.77* | 0.28 | -0.67 | 0.78* | 1 | ||||||||
| MAT | -0.84* | -0.99** | -0.63 | 0.59 | -0.85* | 0.62 | 0.73* | 1 | |||||||
| MAP | -0.51 | 0.24 | -0.21 | 0 | -0.36 | 0.24 | 0.42 | -0.99** | 1 | ||||||
| Canopy cover | -0.28 | -0.23 | 0.45 | 0.35 | 0.06 | 0.04 | -0.21 | 0.23 | -0.46 | 1 | |||||
| Tree density | -0.35 | 0.01 | 0.7 | 0.64 | -0.12 | 0.15 | -0.38 | -0.01 | 0.04 | 0.58 | 1 | ||||
| Trees diameter | 0.95** | 0.83* | 0.33 | -0.65 | 0.82* | -0.69 | -0.67 | -0.83* | -0.58 | -0.18 | -0.32 | 1 | |||
| Tree height | 0.77* | 0.68 | 0.21 | -0.75* | 0.88* | -0.84* | -0.65 | -0.68 | -0.45 | -0.09 | -0.33 | 0.83* | 1 | ||
| Grass cover | 0.26 | -0.06 | -0.53 | -0.62 | 0.21 | -0.25 | 0.23 | 0.06 | -0.32 | -0.05 | -0.82* | 0.34 | 0.33 | 1 | |
| Herb and
shrub density |
0.46 | 0.18 | 0.13 | 0.63 | -0.6 | 0.58 | 0.25 | 0.18 | 0.63 | -0.26 | 0.5 | -0.56 | -0.75* | -0.75* | 1 |
SOC = Soil Organic Carbon (Mg C ha-1); Elevation = masl; BD = Bulk density (g cm-3); Sand = %; Clay = %; Silt = %; MAT = Mean annual temperature (°C); MAP = Mean annual precipitation (mm); Canopy cover = %; Tree density = Trees ha-1; Trees diameter = cm; Tree height = m; Grass cover = %; Herb and shrub density = Plants ha-1. * Significant correlation at 95 % confidence (α≤0.05); ** Significant correlation at 99 % confidence (α≤0.01).
Logging negatively impacted soil (SOC stocks) and vegetation structure (ND of sampled trees) (Figure 5).
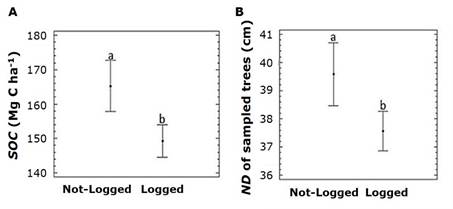
A = Effect of logging on SOC mean values; B = ND of sampled trees.
Figure 5 Effect of logging on SOC mean values and ND of sampled trees along the elevation gradient in the Pinus hartwegii Lindl. forest.
Smaller SOC stocks at lower elevations are due to the widespread harvesting of P. hartwegii, often illegal, for use in furniture and construction (Franco et al., 2006). Logging reduces OM input, alters decomposition rates, and changes litter quality and microsite conditions (Nave et al., 2010; Pérez-Suárez et al., 2012). Canopy gaps promote secondary succession, increasing degradable herbs and shrubs and reducing SOM pools (Bomfim et al., 2020; Cepáková & Frouz, 2015). Increased light and temperature exposure accelerates decomposition and CO2 emissions for as much as 45 years (Chiti et al., 2016; Coletta et al., 2017). At lower elevations (≤3 700 m), smaller trees, noticeable degradation, and weak law enforcement exacerbate illegal logging, particularly near the Nevado de Toluca FFPA buffer zone. This reduces the forest's capacity to store organic carbon (OC). SOC stocks vary with elevation, influenced by MAT and soil texture. Higher SOC at high elevations reflects cooler temperatures and conservation practices, while lower SOC at low elevations is linked to human-driven forest structure changes. Mountain forest soils should be included in carbon inventories and reforestation strategies addressing elevation gradients.
Conclusions
SOC stocks along altitude are influenced by temperature (MAT) and BD. As elevation increases, MAT decreases, while SOM pools, sand content, and tree diameter rise. At lower elevations (around 3 700 m), selective logging can modify microsite conditions, potentially leading to increased SOC outputs. Conversely, at higher elevations from 3 900 to 4 000 m, the reduced MAT slows decomposition, resulting in higher SOC stocks. Understanding the dynamics of SOM and SOC along elevational gradients, as well as how temperature and factors like tree removal impact SOC regulation and stabilization in mountain forests, is crucial in the context of global warming projections.

