


Servicios Personalizados
Revista
Articulo
 texto en
  Inglés (pdf)
 Artículo en XML
 Referencias del artículo
 Enviar artículo por email
Indicadores
-
 Citado por SciELO
 -
 Accesos
Links relacionados
-
 Similares en
SciELO
Similares en
SciELO
Compartir

 Permalink
Revista mexicana de ciencias pecuarias
versión On-line ISSN 2448-6698versión impresa ISSN 2007-1124
Rev. mex. de cienc. pecuarias vol.15 no.4 Mérida oct./dic. 2024 Epub 21-Mar-2025
https://doi.org/10.22319/rmcp.v15i4.6551
Bibliographic Revisions
Characteristics of lactation curves in ewes and factors influencing their variation: A review
a Colegio de Postgraduados-Campus Montecillo. Programa de Ganadería. 56264, Montecillo, Edo. de México. México.
b Universidad Autónoma de San Luis Potosí. Facultad de Química. San Luis Potosí. México.
c Iniciativa Privada. San Luís Potosí. México.
d Instituto Nacional de Investigaciones Forestales, Agrícolas y Pecuarias. Campo Experimental La Laguna. Coahuila. México.
Dairy sheep breed genetic improvement programs have responded to the increasing market demand and popularity, especially for cheeses made from sheep's milk. These milk derivatives are an important source of bioactive substances for human health. Therefore, it is very important to learn about milk production (MPROD) and the factors that influence its variation. The typical pattern of MPROD during the period when an ewe is lactating is known as the lactation curve (LC), and this can be typical (TLC) or atypical (ACL). TLCs are characterized by reaching a maximum MPROD (lactation peak, LP) within a few days after parturition, and then gradually decreasing until the end of lactation, or lactation drying, is reached. ALCs are those that show some deviation from the normal pattern. It is important to know the graphical representation of lactation behavior, as, in addition to predicting MPROD, it makes it possible to identify health and feeding issues, as well as to select females that will excel in MPROD. Persistence of lactation (PER) has been defined as the rate of decline in MPROD after the LP was reached, and it is highly desirable for ewes to have a high PER. Mathematical models have been developed for the study of LCs and PER. There are genetic and environmental factors that influence LCs.
Keywords Milk production; Peak lactation; Persistence; Typical curves; Sheep breeds
Los programas de mejoramiento genético de las razas de ovejas lecheras han respondido a una creciente demanda y popularidad del mercado, especialmente para quesos elaborados con leche de oveja. Estos derivados de la leche son una fuente importante de sustancias bioactivas para la salud humana. Por lo tanto, el conocimiento de la producción de leche (PRODL) es muy importante y los factores que influyen en su variación. El patrón típico de la PRODL durante el período que una oveja está lactando se conoce como curva de lactación (CL), y éstas pueden ser típicas (CLT) o atípicas (CLA). Las CLT se caracterizan por alcanzar una PRODL máxima (pico de lactación, PL) a los pocos días después del parto, y posteriormente disminuye gradualmente hasta llegar al final de la lactación, o secado. Las CLA son aquellas que muestran alguna desviación del patrón normal. Es importante conocer la representación gráfica del comportamiento de la lactación, ya que, además de predecir la PRODL, permite identificar problemas de salud y alimentación, así como la posibilidad de seleccionar hembras que sobresalen en la PRODL. La persistencia de la lactación (PER) se ha definido como la tasa de disminución en la PRODL después de que se alcanzó el PL, y es muy deseable que las ovejas tengan una alta PER. Se han desarrollado modelos matemáticos para el estudio de las CL y PER. Existen factores genéticos y ambientales que influyen en las CL.
Palabras clave Razas de ovinos; Producción de leche; Curvas típicas; Pico de lactación; Persistencia
Introduction
Over the last 150 yr, genetic selection and improvements in management have led to improved breeds of sheep for milk production (MPROD), responding to growing market demand and popularity, especially for cheeses made from sheep's milk1. There are currently an estimated 1 billion sheep in the world2; the main breeding areas are located within latitudes 35-55 degrees north in Europe and Asia, as well as between 30 and 45 degrees south in South America, Australia and New Zealand3. Products derived from sheep's milk, such as cheese, cottage cheese, yogurt, etc., constitute the typical diet of sheep farmers4 and are an important source of bioactive substances that benefit human health5. About 1,500 sheep breeds have been described; of these, only 180 are identified as milking breeds because of their zootechnical purpose (milk), although many are local breeds used for meat, wool, and milk production where milk is not the main product of interest6. Some of the most important breeds of dairy sheep in the world are East Friesian7, Lacaune8, Chios9, Sarda10, and Manchega11.
The productive level of the ewe is the most important economic characteristic in the flock, as it provides information used in the estimation of biological indexes that facilitate selection decisions in genetic improvement programs12. Therefore, one of the most important criteria for evaluating female productivity is MPROD, since it directly affects the efficiency of the production system and has very important effects on farm profitability13. Therefore, knowledge of the behavior of the lactation curve (LC) is very important, since it will allow adequate planning of general management and genetic improvement programs. The objective of this review is to describe the main characteristics of LCs and to enumerate the factors that influence their variation. This review has included studies conducted in sheep; however, the vast majority of studies in the scientific literature that address this topic are focused on describing LCs in dairy cattle.
Definition of lactation curve
MPROD during the lactation period in mammals and domestic ruminants is the result of physiological processes developed by specialized cells of the mammary gland, which synthesize and secrete organic and inorganic compounds through active and passive blood filtration14. MPROD begins when gestation is nearing completion through expansion of the mammary gland tissue, and ends when the mammary gland volume decreases, due to secretory regression that ends with the cessation of lactation, or drying15. All these physiological mechanisms result in a typical pattern of MPROD over time known as the “lactation curve” (LC), which can be defined as the graphical representation of the time period in which MPROD occurs, although it is also expressed as a continuous physiological function describing milk secretion over time16. According to the criteria of certain authors17, and taking Assaf dairy ewes as an example, lactation can be divided into three periods: early lactation, which considers the period from lambing until month 2, mid lactation, which covers months 3 to 7, and late lactation, from month 8 to dry-off.
Importance of knowing lactation curves
Knowledge of a LC allows prediction of the total milk production18, the characteristics of the curve (discussed below), and, finally, the future performance of the breeding animals (cattle, sheep, goats) or their progeny19. In addition, by understanding the behavior of the LC’s shape, it is possible to make decisions regarding such aspects as nutrition, health, and management of the herd. Above all, knowledge of these curves is useful for identifying and selecting superior ewes for MPROD and, therefore, valuable for the producers20.
Lactation curve types
According to their shape, there are two types of LCs: typical (TLC) and atypical21 (ALC). A TLC reaches its maximum milk production (peak production, lactation peak, LP) a few days after lambing (2-6 weeks), and thereafter shows a steady decline until it reaches the drying stage, or end of lactation22. The typical pattern of a LC (Figure 1) is regular and continuous, and constitutes the expression of physiological mechanisms from the onset of MPROD23. An ALC is one represented by slight deviations from the TLC due, for example, to the presence or absence of an inflection point in the decreasing lactation; others decline steadily and lack the LP24, as shown in Figure 2; they are represented by deviations from the regular pattern, which can be attributed to various factors such as nutrition, health status of the animal, and environmental disturbances23. For example, in Wood's model25, a characteristic that differentiates TLCs from ALCs is that the “b” and “c” parameters are positive in TLCs, and negative in ALCs26.
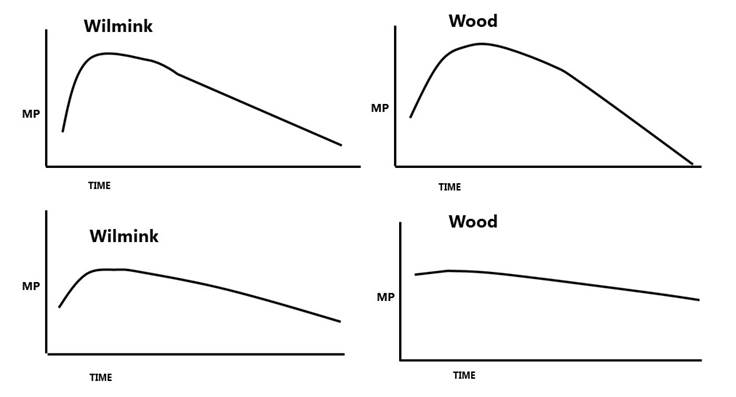
Adapted from Palacios Espinosa et al21
Figure 1 Schematization of typical lactation curves, according to Wilmink’s and Wood's models
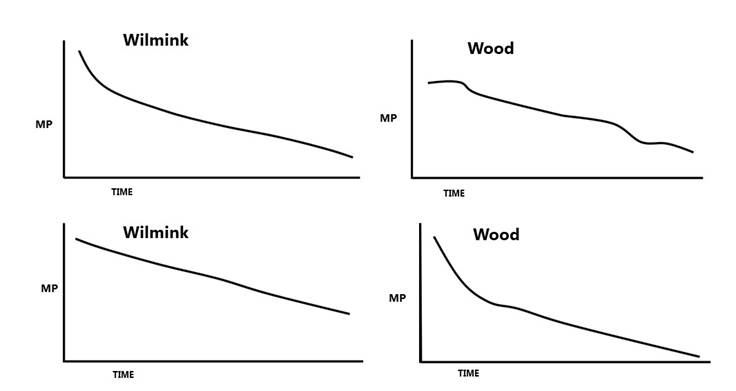
Adapted from Palacios Espinosa et al21
Figure 2 Schematization of atypical lactation curves, according to Wilmink and Wood's models
Stages (phases) of a lactation curve
The typical stages of a LC are: an initial gradual increase from lambing until reaching a point of maximum milk production that represents the LP is reached, which occurs within the first days after lambing (or days in milk), generally in the range between 2 and 6 wk, and which is also a criterion used in the selection of breeding females28. Subsequently, the decreasing phase begins until the MPROD ceases, or until the drying of the animal, when the MPROD is minimal. Drying, in dairy sheep breeds such as the East Friesian, generally takes between 180 and 210 d, and, in exceptional cases, it can take up to 260 d29. Great care must be taken with the method used to dry the animal, due to the possibility of infections in the mammary gland, such as mastitis30,31. Drying can be abrupt: stopping milking on a given day, or gradual, with a reduction of the frequency of milking over days or weeks32. In dairy cows, some management practices have been recommended to carry out the drying process33,34, which could also be put into practice with sheep. At the end it has a CL that graphically represents the total MPROD, which can be estimated based on the area under the curve, defined as the total amount of milk produced during the whole lactation and determined by the shape of the curve35.
Lactation curve models
The first mathematical models to characterize LCs were developed in studies of dairy cows; however, several of these have also been used to characterize LCs of sheep and goats. These models are classified as a) empirical and b) mechanistic. In relation to lactation, empirical models are based on actual MPROD data; e.g., test day records, whereas mechanistic models are based on the biology of lactation; e.g., mammary gland growth and regression, or nutrient flux36. In other words, the theory of the empirical model refers to the level of reality in which the phenomenon under consideration is expressed, while the mechanistic one is characterized by a deeper theoretical assumption37. Describing and discussing these models is not an objective of this review. Therefore, and for illustrative purposes only, Tables 1 and 2 show examples of empirical and mechanistic models, respectively.
Table 1 Examples of empirical models and their parameters used in sheep lactation curves, expressed as a function of t
| Model | Parameters | Author(s) |
|---|---|---|
|
|
2 | Brody et al. (1923) |
|
|
3 | Wood (1967) |
|
|
3 | Cobby & Le Du (1978) |
|
|
3 | Dhanoa (1981) |
|
|
4 | Wilmink (1987) |
|
|
5 | Ali & Schaeffer (1987) |
|
|
3 per phase | Grossman & Koops (1988) |
|
|
4 | Morant & Gnanasakthy (1989) |
|
|
6 | Gipson & Grossman (1989) |
|
|
3 | Cappio-Borlino et al. (1995) |
|
|
3 | Nelder (1996) |
|
|
5 | Brotherstone et al. (2000) |
Table 2 Examples of mechanistic models and their parameters used in sheep lactation curves
| Model | Parameters | Author(s) |
|---|---|---|
|
|
14 | Neal & Thornley (1983) |
| dY/dt = a{ exp[ -exp(G0 - bt)]} [exp (-ct)] | 4 | Emmans & Fisher (1986) |
| Yt = a exp[b(1-exp-ct)/c - dt] | 4 | Dijkstra et al. (1997) |
| Yt=a{1/[1+(1-b)/b exp-cn]-1/[1+(1-d)/d exp-gn]} | 5 | Pollot (2000) |
| I = SEL(de-k 2 t + l6ew 6 t + l7ew 7 t) | 8 | Vetharaniam et al. (2003) |
Source: Neal & Thornley39, Friggens et al40, Adediran et al41, Vetharaniam et al42.
In order to carry out genetic improvement programs for CL, it is necessary to know the magnitude of the additive genetic variance of CL parameters. Based on the above, some studies have been carried out in sheep to estimate the heritability (h2) of CL parameters. Pollot and Gootwine43 found in improved Awassi ewes low values of the additive genetic variance for LP and day on which the LP occurs (DPL), resulting in h2 values of 0.11 for PL and 0.032 for DPL, explaining that these results indicate that environmental factors exert a greater effect on the manifestation of these parameters. In the USA, a group of researchers(20) analyzed first lactations of Dorset, Romanov, Targhee, Rideau Arcott, Polypay, Booroola Merino, Suffolk, Rambouillet, Finnsheep and East Friesian ewe crosses to investigate genetic variation in CL parameters using a Bayesian analysis of Wood's model25. The h2 values obtained for parameters “a”, “b”, and “c” were 0.35, 0.35, and 0.27, respectively, so these authors concluded that part of the variation in lactation curves among ewes is heritable. In another study on Yankasa sheep44, and also with Wood’s model25, h2 values of 1.4, 0.3, and 0.2 were found for parameters “a”, “b”, and “c”, respectively. With respect to the irregular value of the parameter “a”, these authors explained that this value could be subject to large sampling errors and, moreover, overestimated, due to the participation of non-additive genetic effects. Reviewing the magnitude of the h2 estimators in the previous studies, it is inferred that, by virtue of being in the low-medium range, a positive response to CL selection in ewes could be expected.
Lactation persistence
A phase of lactation closely related to CL is what is known as “lactation persistency” (or milk production, PER), which was initially defined as “the rate of milk secretion indicating the initial value at parturition and its change with advancing lactation”45, and whose first numerical measure was given, in cattle, as a percentage of the MPROD in the previous month. Subsequently, it was defined as46 “a function of CL flattening”; i.e., a female has a higher PER the more flattened her CL is. One year later another definition was published in the literature47: “the ability to maintain the level of MPROD during lactation” and that it can be extended to milk components, including fat and protein. Finally, with a different approach48, PER was said to be: “the rate of decrease in MPROD after reaching the LP”.
Most of the information on lactation PER, especially mathematical models, comes from larger species, particularly dairy livestock37. However, in studies with dairy sheep, PER has been studied with the same approach as dairy livestock49,50. Under this scenario, PER has an important impact on dairy cattle, which has benefits both in feed costs51, as well as reproductive aspects52. Therefore, the current trend in MPROD in cattle is to improve the PER and extend it, rather than to increase MPROD in the LP53, which also applies to sheep and goats.
Lactation persistence models
Different criteria have been proposed to measure the PER35 which involve the use of different mathematical models. However, as in the case of the LC models, describing and discussing PER models is not an objective of this review. Therefore, for illustrative purposes, Table 3 shows some mathematical models that have been proposed for cattle, according to the definition of PER.
Table 3 Some mathematical models and their parameters for measuring lactation persistence in dairy cows
| Persistence model | Reference |
|---|---|
|
|
Ludwin (1942) |
|
|
Cole & VanRaden (2006) |
|
|
Cobuci et al. (2007) |
|
|
Harder et al. (2006) |
|
|
DeRoos et al. (2001) |
|
|
Weller et al. (2006) |
|
|
Yilmaz & Koc (2013) |
|
|
Atashi et al. (2006) |
|
|
Togashi & Lin (2004) |
|
|
Mostert et al. (2008) |
|
|
Jamrozik et al. (1997) |
|
|
Kistemaker (2003) |
|
|
Johansson & Hansson (1940) |
|
|
Jakobsen et al. (2002) |
|
|
Wood (1970) |
|
|
Kamidi (2005) |
Source: Torshizi et al54
As in the case of LCs, studies have also been carried out in sheep to estimate the h2 of PER, although for this parameter, in smaller numbers compared to dairy cows. In order to estimate the h2 of PER, a group of researchers in Greece55 used Sfakia dairy ewes using MMP2:MMPP1 (MPROD month 2:MPROD month 1), MMP3: MMP1 (MPROD month 3:MPROD month 1), MMP4: MMP1 (MPROD month 4: MPROD month 1), MPR (measure of the reduction in an ewe's MPROD relative to MPROD level in early lactation, in percent), and VC (measure associated with the variation in an ewe's MPRODs on the test day, in percent), with results, respectively, of 0. 26, 0.16, 0.14, 0.24, y 0.28. In a study with improved Awassi ewes43 the h2 of PER was estimated, measured as the daily loss of MPROD between DPL and the end of lactation, thus obtaining a value of 0.11. Kominakis et al56) estimated the h2 of PER in Boutsiko dairy ewes from Greece, for which they used three measures of PER:
Factors affecting the lactation curve
Genetic
Lactation behavior is largely determined by the genotype of the individual; i.e., the shape of the CL is genetically determined57. A group of researchers58 used a mechanistic mathematical model of the milk secretion process, based on the physiological theory of the mammary gland, where the model output can be a monoexponential or biexponential function. Using 64 Sarda dairy ewes, the biexponential function fitted regular LCs (R2=0.87), while the monoexponential fitted decayed LCs (R2=0.80). The authors concluded that LC dimorphism was not due to environmental factors (production level, type of birth, and udder health status), but did have a genetic influence.
A study using crosses between several dairy sheep breeds researched genetic variation in LC traits20 using a three-stage Bayesian hierarchy: 1) Wood's model was utilized, 2) inter-sheep variation was described, and 3) a priori distributions of all unknown parameters were included. The results showed that some of the variation in LCs between ewes is heritable. On the other hand, genetic correlations were negligible, suggesting that there is sufficient scope for modifying LCs genetically.
The MPRODs of Araucana and Romney Marsh ewes were tested59, also characterizing their LCs and relating MPROD to the growth of their lambs. The LCs in both breeds were typical; however, the MPROD of Araucana ewes was characterized by an ascending phase until d 30, with a maximum production of 2.18 L d-1, while Romney Marsh ewes reached the LP on day 20 of lactation, with a maximum MPROD of 2.47 L d-1.
Komprej et al60 analyzed the LCs for daily MPROD, fat, and protein content in Bovec, improved Bovec, and Istrian Pramenka dairy ewes, estimated with a repeatability animal model that included records of the test days. The shape of the LCs for the daily milk production of Bovec and improved Bovec ewes was a good fit (51.35 %) for the general lactation curve of dairy ewes. In Istrian Pramenka ewes, the shape of the LCs was more or less atypical, with a lower peak production and a decreasing daily MPROD during almost the whole lactation. The shapes of the LCs for fat and protein contents were opposite to those of the LCs for daily MPROD in all three breeds.
In order to determine the MPROD and the LC characteristics, 863 weekly MPROD records from 70 lactations were analyzed61 in six genetic groups of ewes: East Friesian (EF), Criollo (Cr), ½ EF x ½ Cr, – EF x ¼ Cr, ½ Suffolk x ½ Cr, and Corriedale (C). Wood's function (WF) was used to calculate the total observed MPROD (TLPobs) and the estimated 180-d MPROD (TLP180), the peak lactation (PL), the time to peak lactation (TPL), and the PER. The genetic group significantly (P<0.05) influenced the TLPobs, TLP180, LP, and parameter “b” of Wood's model, with higher values in ½ EF x ½ Cr ewes. In all cases, the LCs were typical, although with varying degrees of PER. The authors concluded that differences in productive performance due to the genetic group may be associated with the adaptability of EF ewes to local climatic conditions.
Environmental
Before addressing the results found in the literature concerning this type of factors, a group of researchers37 in dairy cattle pointed out that linear mixed models are an adequate mathematical tool for the evaluation of environmental effects, as they can take into account factors that could affect each test-day record differently. These authors presented the basic structure of these models as follows: y = HTD + F + DIM + L + e; where y= daily MPROD; HTD= interaction between herd and test date taking into account the peculiar effects of a specific date; F= fixed factor (lambing season, production region, lambing number); DIM= fixed effect of days on MPROD groups, whose least squares solutions allow generating lactation curves corrected for other effects included in the model; L= individual random effect of the cow (ewe, goat) associated with a variance component (Ϭ2L); e= residual random effect associated with the variance component Ϭ2 L.
In a study on Sarda dairy ewes62, LCs were estimated and predicted LCs by age at lambing, in addition to seasonal effects for milk, fat, and protein yields. Trends in seasonal effects showed a spring peak for MPROD, milk, fat, and protein yields. The seasonal effects on fat content were very irregular, while in the case of the protein content they were small and constant over time. The predicted LCs showed an increasing effect of age at lambing on all variables. From these results, the authors concluded that the trend of seasonal effects on milk yields within herd-years could be an important tool for improving management techniques.
Using Sarda dairy ewes with different levels of milk production (in grams), lambing type, and udder health, a modified nonlinear version63 of Wood’s model (y=atbexp(-ct)) was tested The results showed that the modified version (“a”=702.3 + 56.2, “b”=1.29 ± 0.09, “c”=0.133 ± 0.013) of the model fitted the LC very well (R2= 0.905; residual standard deviation= 145.3) with few iterations required for convergence (<5). Milk yield, production level, and lambing type influenced all the parameters, while udder health only influenced parameter “a”.
In a study on Comisana dairy ewes64, MPROD data were fitted with Wood's model, and the effect of environmental factors on the LC was assessed. The interaction between the lambing number and the lambing season had a strong influence on the lactation parameters. The LCs for winter-lambing ewes had a higher LP than for those for fall-lambing ewes. The lambing number correlated positively with the peak milk production and negatively with the milk production decrease (MPD) and PER. The lambing type did not significantly influence the shape of the LC.
In the case of Valle del Belice dairy ewes65, test-day models were used to estimate the LC and assess the influence of environmental factors on MPROD and fat and protein percentages. Three flocks were analyzed. In each flock, two groups of ewes were formed; one group received no feed supplement, while the other group received 500 g d-1 of a commercial concentrate. The lambing number affected the LC for MPROD, which was lower and flatter for first-time ewes; the effects on the fat and protein contents were smaller. The time of the lambing affected all variables. Seasonal productivity had the greatest effect on the milk composition, resulting in an imbalance between fat and protein percentages. Herd and dietary supplementation effects affected only the LC for MPROD.
A study was conducted in Mexico66 with crossbred dairy ewes from four commercial farms to research those environmental factors that influence LC parameters using Pollot's 5-parameter additive model. The crossbred ewes were the progeny of East Friesian as the paternal line, and Suffolk, Pelibuey, Blackbelly, and Hampshire as the maternal line. The parameters estimated were the maximum milk secretion potential (MSmax), the relative rate of decline in cell number (DR), and the proportion of dead parenchyma cells at delivery. The effects of birth type, lambing number, herd, and lambing season on the total milk yield (TMY), lactation length, and estimated parameters of the Pollot model were analyzed. The herd had a significant effect (P<0.05) on most of the analyzed variables; the TMY was higher (P<0.05) in double lambing lactations than in those of single lambing. First-lambing ewes had a lower TMY than fourth-lambing ewes (P<0.01).
Likewise, in order to characterize the LC of ewes from the Bulgarian synthetic dairy population, taking into account the MPROD of the test day and the number of lambing, the following MPROD records of the Agricultural Institute-Shumen during the 2009-2019 period herd were analyzed67. For this purpose, a linear mixed model was used where the analytical hypothesis included the effects of year and month of lactation, lambing number, lambing type, test day (related to the LC), lactation period, permanent effect of environmental changes, genetic value of the animal, and residual environmental effects. A typical, relatively flat curve was found, which varied according to the day of the test and the number of births.
Climatic factors such as temperature, humidity, wind speed, and radiation are environmental elements that influence animal welfare and stress68 and can affect various productive aspects such as growth, reproduction, and MPROD in ruminants69. In a study with Churra dairy ewes70, these same factors, in addition to precipitation, affected the total milk production and milk quality, which exerted a direct influence on the LC.
A study was carried out in the Mediterranean region71 to investigate the effect of heat stress on the MPROD of Valle del Belice sheep. The results indicated that there was an antagonistic effect between MPROD and heat stress, as the selection to increase the MPROD reduced the heat tolerance.
Similar results to the previous study were found in dairy cows from two regions of the USA72, given that the selection to increase the MPROD remained constant up to a certain point (threshold) and then exhibited a linear decreasing behavior as the value of the temperature-humidity index (THI), designed to measure heat stress, increased.
Cold stress has also been found to have a significant effect on the MPROD. In a study with Mediterranean Manchega dairy ewes73 the effect of the exposure to adverse climate conditions (exposure to heat and cold) on MPROD was analyzed to measure the thermotolerance capacity of the sheep, as well as the degree of decrease in MPROD outside the thermal comfort zone. The results showed that cold stress had a greater negative effect on MPROD than heat stress.
Conclusions and implications
A lactation curve is the graphical representation of the behavior of the level of milk production of an individual, or a group of individuals, throughout lactation. The knowledge of a lactation curve is of utmost importance since it allows predicting the total milk production and making decisions on nutrition, health, and farm management, but, above all, it allows identifying the superior females in terms of milk production to be used in the herd as breeders. According to their shape, lactation curves can be typical (normal) and atypical. Lactation persistency is a phase closely linked to the lactation curve and represents the rate of decline in milk production after the peak lactation has been reached. Mathematical models have been developed to characterize lactation curves and study lactation persistence, mostly in cattle, although several have also been used in sheep. For selection purposes, both for the lactation curve and persistence, the heritability estimates reported in sheep show values that are in the low-medium range, which gives the confidence to expect positive responses in genetic improvement programs; these should be designed with clear, well-defined objectives, in addition to using the appropriate program methodology, based on the characteristics of the variables to be measured, the animal population, and the environment, and, finally, they should consider the potential influence of genetic and environmental factors in the response of the sheep to lactation curves. The scarcity of information on the lactation curves in ewes indicates the need to carry out more research on this species ―not only on ewes of dairy breeds, but also on ewes of meat-producing breeds―, since the maternal ability to produce milk significantly influences the pre-weaning growth and survival of the offspring and impacts the profitability of the production system directly.
Acknowledgments
The authors are grateful to CONHACYT (National Council for Humanities, Science, and Technology of Mexico) for the scholarship granted to the first author (GCH) to pursue her PhD in Animal Science. This article belongs to the Knowledge Generation and Application Line (LGAC) “Innovación Tecnológica y Seguridad Alimentaria en Ganadería” (“Technological Innovation and Food Safety in Livestock”).
REFERENCES
1. Haenlein GFW, Wendorff WL. Sheep Milk. In: handbook of milk of non-bovine mammals. Chapter 3: Young W. Park GFH. Haenlein, and William L. Wendorff, editors. Blackwell Publishers; 2006:137-194. https://doi.org/10.1002/9780470999738.ch7. [ Links ]
2. FAOSTAT. Producción de ovinos en el mundo. 2020. Consultado 31 Ago, 2022. http://www.fao.org/faostat/es/#data/QL/visualize . [ Links ]
3. Morris ST. Overview of sheep production systems. In: Ferguson D, Lee C, Fisher A, ediytors. Advances in sheep welfare; 1st. ed. Duxford, United Kingdom. Woodhead Publishing; 2017:19-35. https://doi.org/10.1016/C2015-0-00983-2. [ Links ]
4. Pulina G, Milán MJ, Lavín MP, Theodoridis A, Morin E, Capote J, et al. Invited review: Current production trends, farm structures, and economics of the dairy sheep and goat sectors. J Dairy Sci 2018;101(8):6715-6729. https://doi.org/10.3168/jds.2017-14015. [ Links ]
5. Flis Z, Molik E. Importance of bioactive substances in sheep’s milk in human health. Int J Mol Sci 2021;22(9):4364. https://doi.org/10.3390/ijms22094364. [ Links ]
6. Thomas DL, Haenlein GFW. Sheep Milk. 3.1 Production of sheep milk. In: Handbook of milk of non-bovine mammals. Young W. Park GFH Haenlein, and William L Wendorff, editors. John Wiley & Sons Ltd; 2017:181-209. https://doi.org/10.1002/9780470999738.ch7. [ Links ]
7. Hamann H, Horstick A, Wessels A, Distl O. Estimation of genetic parameters for test day milk production, somatic cell score and litter size at birth in East Friesian ewes. Livest Prod Sci 2004;87(2-3):153-160. https://doi.org/10.1016/j.livprodsci.2003.09.015. [ Links ]
8. Barillet F, Marie C, Jacquin M., Lagriffoul G, Astruc JM. The French Lacaune dairy sheep breed: use in France and abroad in the last 40 years. Livest Prod Sci 2001;71(1):17-29. https://doi.org/10.1016/S0301-6226(01)00237-8. [ Links ]
9. Gelasakis AI, Arsenos G, Valergakis GE, Oikonomou G, Kiossis E, Fthenakis GC. Study of factors affecting udder traits and assessment of their interrelationships with milking efficiency in Chios breed ewes. Small Ruminant Res 2012;103(2-3):232-239. https://doi.org/10.1016/j.smallrumres.2011.09.045. [ Links ]
10. Sanna SR, Carta A, Casu S. Genotype by environment interaction for milk yield in Sarda dairy sheep. J Anim Breed Genet 2002:119:190-199. https://doi.org/10.1046/j.1439-0388.2002.00337.x. [ Links ]
11. Ramón M, Legarra A, Ugarte E, Garde JJ, Pérez-Guzmán MD. Economic weights for major milk constituents of Manchega dairy ewes. J Dairy Sci 2010;93(7):3303-3309. https://doi.org/10.3168/jds.2009-2787. [ Links ]
12. Pérez-Álvarez JG, Rodríguez-Almeida FA, Domínguez-Viveros J. Genetic parameter estimates for productivity of the Katahdin and Hampshire ewe and its components. J Anim Sci 2016;94(5):836-848. https://doi.org/10.2527/jam2016-1715. [ Links ]
13. Bayril T, Akdemir F, Baran MS, Orhan C, Yildirim IH, Yildiz AŞ, Çelik R. Effects of lamb sex, parity, and birth type on milk yield, lactation length, and milk components in Zom ewes raised under semi-intensive conditions. South African J Anim Sci 2023; 53(2):185-196. http://dx.doi.org/10.4314/sajas.v53i2.05. [ Links ]
14. Akers RM. Lactation and the mammary gland. Wiley-Blackwell; 2016. [ Links ]
15. Lérias JR, Hernández-Castellano LE, Suárez-Trujillo A, Castro N, Pourlis A, Almeida AM. The mammary gland in small ruminants: major morphological and functional events underlying milk production-a review. J Dairy Res 2014;81(3):304-318. https://doi.org/10.1017/S0022029914000235. [ Links ]
16. Dongre VB, Gandhi RS, Avtar S, Atul G. A brief review on lactation curve models for predicting milk yield and different factors affecting lactation curve in dairy cattle. Int J Agric Res Review 2011;1(1): 6-15. [ Links ]
17. Abecia JA, García A, Castillo L, Palacios C. The effects of weather on milk production in dairy sheep vary by month of lambing and lactation phase. J Anim Behav Biometeorol 2017;5(2):56-63. http://dx.doi.org/10.26667/2318-1265jabb.v5n2p56-63. [ Links ]
18. Wood PDP. A note on the estimation of total lactation yield from production on a single day. Anim Prod 1974;19(3):393-396. https://doi.org/10.1017/S0003356100022972. [ Links ]
19. Yépez-Ruidías H, Rúa-Bustamante CV, Idárraga-Idárraga Y, Arboleda-Zapata E, Calvo Cardona SJ, Montoya Atehortúa A, et al. Estimación de las curvas de lactancia y producción de leche de cabras del departamento de Antioquia, usando controles lecheros quincenales y mensuales. Rev CES Med Vet Zoot 2010;5(2):30-35. [ Links ]
20. Chang YM, Rekaya R, Gianola D, Thomas DL. Genetic variation of lactation curves in dairy sheep: A Bayesian analysis of Wood’s function. Livest Prod Sci 2001;71(2-3):241-251. https://doi.org/10.1016/S0301-6226(01)00185-3. [ Links ]
21. Palacios-Espinosa A, González-Peña Fundora D, Guerra-Iglesias D, Espinoza-Villavicencio JL, Ortega-Pérez R, Guillén-Trujillo A, et al. Curvas de lactancia individuales en vacas Siboney de Cuba. Rev Mex Cienc Pecu 2016;7(1):15-28. http://www.scielo.org.mx/scielo.php?. [ Links ]
22. Ángeles-Hernández JC, Aranda-Aguirre E, Muñoz-Benítez AL, Chay-Canul AJ, Albarrán-Portillo B, Pollott GE, et al. Physiology of milk production and modelling of the lactation curve. CAB Reviews 2021;60(056):1-22. doi: 10.1079/PAVSNNR202116056. [ Links ]
23. Macciotta NPP, Dimauro C, Steri R, Cappio-Borlino A. Mathematical modelling of goat lactation curves. In: Dairy goats feeding and nutrition. Cannas A, Pulina G, Dias Francesconi AH, editors. CABI International 2008:31-46. [ Links ]
24. Druet T, Jaffrézic F, Boichard D, Ducrocq V. Modeling lactation curves and estimation of genetic parameters for first lactation test-day records of French Holstein cows. J Dairy Sci 2003;86(7):2480-2490. https://doi.org/10.3168/jds.S0022-0302(03)73842-9. [ Links ]
25. Wood PDP. Algebraic model of the lactation curve in cattle. Nature 1967;216:164-165. https://doi.org/10.1038/216164a0. [ Links ]
26. Shimizu H, Umrod S. An application of the weighted regression procedure for constructing the lactation curve in dairy cattle. Jap J Zootech Sci 1976;47(12):733-738. [ Links ]
27. Waheed A, Khan MS. Lactation curve of Beetal goats in Pakistan. Arch Anim Breed 2013;56(1):892-898. https://doi.org/10.7482/0003-9438-56-089. [ Links ]
28. Aytekin I, Boztepe S. The key to successful dairy cattle: days in milk (DIM). Selcuk J Agric Food Sci 2017;31(3):184-188. doi:10.15316/SJAFS.2017.53. [ Links ]
29. Fahmy MH, Shrestha JNB. Dairy Animals/Sheep Breeds. In: Encyclopedia of dairy sciences. Roginski, H, editor. Academic Press. 2002: 598-613. https://doi.org/10.1016/B0-12-227235-8/00112-7. [ Links ]
30. Chaffer M, Leitner G, Zamir S, Winkler M, Glickman A, Ziv N, Saran A. Efficacy of dry-off treatment in sheep. Small Ruminant Res 2003;47(1):11-16. https://doi.org/10.1016/S0921-4488(02)00194-3. [ Links ]
31. Petridis IG, Mavrogianni VS, Fragkou IA, Gougoulis DA, Tzora A, Fotou K, et al. Effects of drying-off procedure of ewes’ udder in subsequent mammary infection and development of mastitis. Small Ruminant Res 2013;110(2-3):128-132. http://dx.doi.org/10.1016/j.smallrumres.2012.11.020. [ Links ]
32. Sougaris S, Brozos CN, Petridou E, Papadopoulos T, Kiossis E. Abrupt and gradual drying-off procedure and intramammary dry treatment: Impact on udder health status of Chios breed dairy sheep. J Hellenic Vet Med Soc 2022;73(2):4031-4040. https://doi.org/10.12681/jhvms.26304. [ Links ]
33. Vilar MJ, Rajala-Schultz PJ. Dry-off and dairy cow udder health and welfare: Effects of different milk cessation methods. The Veterinary J 2020;262:105503 http://dx.doi.org/10.1016/j.tvjl.2020.105503. [ Links ]
34. Persson-Waller K, Landin H, Nyman AK. Herd routines and veterinary advice related to drying-off and the dry period of dairy cows. Dairy 2022;3(2):377-399. https://doi.org/10.3390/dairy3020029. [ Links ]
35. Grossman M, Hartz SM, Koops WJ. Persistency of lactation yield: A novel approach. J Dairy Sci 1999;82(10):2192-2197. https://doi.org/10.3168/jds.s0022-0302(99)75464-0. [ Links ]
36. Grossman M, Koops WJ. Modeling extended lactation curves of dairy cattle: A biological basis for the multiphasic approach. J Dairy Sci 2003;86(3):988-998. https://doi.org/10.3168/jds.S0022-0302(03)73682-0. [ Links ]
37. Macciota NPP, Dimauro C, Rassu SPG, Steri R, Pulina G. The mathematical description of the lactation curves in dairy cattle. Italian J Anim Sci 2016;10:4. https://doi.org/10.4081/ijas.2011.e51. [ Links ]
38. Bilgin OC, Esenbuga N, Davis ME. Comparison of models for describing the lactation curve of Awassi, Morkaraman and Tushin sheep. Arch Anim Breed 2010;53(4):447-456. https://doi.org/10.5194/aab-53-447-2010. [ Links ]
39. Neal HDSC, Thornley JHM. The lactation curve in cattle: a mathematical model of the mammary gland. J Agric Sci Camb 1983;101:389-400. http://dx.doi.org/10.1017/S00218596000337710. [ Links ]
40. Friggens NC, Emmans GC, Veerkamp RF. On the use of simple ratios between lactation curve coefficients to describe parity effects on milk production. Livest Prod Sci 1999;62(1):1-13. https://doi.org/10.1016/S0301-6226(99)00110-4 . [ Links ]
41. Adediran SA, Ratkowusky DA, Donaghy DJ, Malau-Aduli AEO. Comparative evaluation of a new lactation curve model for pasture-based Holstein-Friesian dairy cows. J Dairy Sci 2012;95:5344-5356. http://dx.doi.org/10.3168//jds.2011-4663. [ Links ]
42. Vetharaniam I, Davis SR, Upsdell M, Kolver ES, Pleasants AB. Modeling the effect of energy status on mammary gland growth and lactation. J Dairy Sci 2003;86(10):3148-3156. https://doi.org/10.3168/jds.S0022-0302(03)73916-2. [ Links ]
43. Pollott GE, Gootwine E. A genetic analysis of complete lactation milk production in Improved Awassi sheep. Livest Prod Sci 2004;71:37-47. http://dx.doi.org/10.1016/ S0301-6226(01)00239-1. [ Links ]
44. Afolayan RA, Abubakar BY, Dim NI, Osinowo OA. Inheritance of growth and lactation parameters in Yankasa sheep. Nigerian J Anim Prod 2001;28(1):9-13. [ Links ]
45. Gaines WL. Measures of persistency of lactation. J Agric Res 1927;34(4):373-383. [ Links ]
46. Sturtevant EL. Influence of distance from calving on milk yield. N.Y. State Agr Expt Sta Ann Rept 1887;5:26-28. [ Links ]
47. Gengler N. Use of mixed models to appreciate the persistency of yields during the lactation of milk cows [Ph.D. Diss]. Gembloux, Belgium: Faculté Univ Sci Agron. 1995. [ Links ]
48. Gengler N. Persistency of lactation yields: a review. Interbull Bulletin 1996;12:87-96. [ Links ]
49. Cole JB, Null DJ. Genetic evaluation of lactation persistency for five breeds of dairy cattle. J Dairy Sci 2009;92(5):2248-2258. https://doi.org/10.3168/jds.2008-1825. [ Links ]
50. Gutiérrez JP, Legaz E, Goyache F. Genetic parameters affecting 180-days standardised milk yield, test-day milk yield and lactation length in Spanish Assaf (Assaf. E) dairy sheep. Small Ruminant Res 2007;70(2-3):233-238. https://doi.org/10.1016/j.smallrumres.2006.03.009. [ Links ]
51. Dekkers JCM, Ten Hag, JH, Weersink A. Economic aspects of persistency of lactation in dairy cattle. Livest Prod Sci 1998;53:237-252. https://doi.org/10.1016/S0301-6226(97)00124-3. [ Links ]
52. Dobson H, Smith RF, Royal MD, Knight CH, Sheldon IM. The high producing dairy cow and its reproductive performance. Reprod Dom Anim 2007;42(Suppl 2):17-23. https://doi.org/10.1111%2Fj.1439-0531.2007.00906.x. [ Links ]
53. Schutz MM, Hansen LB, Steuernagel GR, Kuck AL. Variation of milk, fat, protein, and somatic cells for dairy cattle. J Dairy Sci 1990;73:484-493. https://doi.org/10.3168/jds.S0022-0302(90)78696-1. [ Links ]
54. Torshizi ME, Mashhadi MH, Farhangfar H. Different aspects of lactation persistency in dairy cows. Indian J Anim Sci 2019;89(6):607-614. https://doi.org/10.56093/ijans.v89i6.91098. [ Links ]
55. Kominakis AP, Volanis M, Rogdakis E. 1999. Genetic and phenotypic parameters of milk yield in Sfakia sheep. In: Proc 15th Scient Meet Hellenic Zootech Soc Chania, Greece. November 3-5, 1999. [ Links ]
56. Kominakis AP, Rogdakis E, Koutsotolis K. Genetic aspects of persistency of milk yield in Boutsico dairy sheep. Asian-Aust J Anim Sci 2002;15(3):315-320. https://doi.org/10.5713/ajas.2002.315. [ Links ]
57. Bonnier G. Is the shape of the lactation curve genetically determined?. Hereditas 1935;10:199-213. [ Links ]
58. Cappio-Borlino A, Macciotta NPP, Pulina G. The shape of Sarda ewe lactation curve analysed by a compartmental model. Livest Prod Sci 1997;51(1-3):89-96. https://doi.org/10.1016/S0301-6226(97)00102-4. [ Links ]
59. Millanao I, Herdener N, Parada D, Sepúlveda N. Producción de leche, curvas de lactancia y crecimiento de sus corderos, en dos razas de ovejas en la región de la Araucanía, Chile. APPA - ALPA, Cusco, Perú. Sitio Argentino de Producción Animal 2007;1-4. [ Links ]
60. Komprej A, Gorjanc G, Kompan D, Kovač M. Lactation curves for milk yield, fat, and protein content in Slovenian dairy sheep. Czech J Anim Sci 2012;57(5):231-239. doi: 10.17221/5921-CJAS. [ Links ]
61. Ángeles-Hernández JC, Guerrero-Loredo A, Solís-Guzmán DA, Ramírez-Pérez AH, Ángeles-Campos S, González-Ronquillo M. Efecto del grupo genético sobre las características de la curva de lactación ovina. Ecosist Rec Agrop 2018;5(14):327-333. https://doi.org/10.19136/era.a5n14.1425. [ Links ]
62. Carta A, Sanna SR, Casu S. Estimating lactation curves and seasonal effects for milk, fat and protein in Sarda dairy sheep with a test day model. Livest Prod Sci 1995;44:37-44. https://doi.org/10.1016/0301-6226(95)00051-L. [ Links ]
63. Cappio-Borlino A, Pulina G, Rossi G. A non-linear modification of Wood's equation fitted to lactation curves of Sardinian dairy ewes. Small Ruminant Res 1995;18(1):75-79. https://doi.org/10.1016/0921-4488(95)00713-U. [ Links ]
64. Portolano B, Spatafora F, Bono G, Margiotta S, Todaro M, Ortoleva V, et al. Application of the Wood model to lactation curves of Comisana sheep. Small Ruminant Res 1997;24(1):7-13. https://doi.org/10.1016/0921-4488(95)00842-X. [ Links ]
65. Cappio-Borlino A, Portolano B, Todaro M, Macciotta NPP, Giaccone P, Pulina G. Lactation curves of Valle del Belice dairy ewes for yields of milk, fat, and protein estimated with test day models. J Dairy Sci 1997; 80(11):3023-3029. https://doi.org/10.3168/jds.S0022-0302(97)76269-6. [ Links ]
66. Ángeles-Hernández JC, Pollot G, Albarrán-Portillo B, Ramírez-Pérez AH, Lizarazo-Chaparro A, Castelán-Ortega OA, et al. The application of a mechanistic model to analyze the factors that affect the lactation curve parameters of dairy sheep in Mexico. Small Ruminant Res 2018;164:58-63. . https://doi.org/10.1016/j.smallrumres.2018.05.003 [ Links ]
67. Stancheva N, Angelova T, Yordanova D, Krastanov J. Lactation curve of the sheep from Bulgarian dairy synthetic population. Trad Mod Vet Med 2021;6(2):64-71. doi: 10.5281/zenodo.5741398. [ Links ]
68. Naskar S, Gowane GR, Chopra A, Paswan C, Prince LLL. Chapter 13: Genetic adaptability of livestock to environmental stresses. In: Sejian V, et al, editors. Environmental stress and amelioration in livestock production. Springer Berlin Heidelberg;2012:317-378. https://doi.org/10.1007/978-3-642-29205-7-13. [ Links ]
69. Silanikove N. Effects of heat stress on the welfare of extensively managed domestic ruminants. Livest Prod Sci 2000;67:1-18. https://doi.org/10.1016/S0301-6226(00)00162-7. [ Links ]
70. González-Ronquillo M, Abecia JA, Gómez R, Palacios C. Effects of weather and other factors on milk production in the Churra dairy sheep breed. J Anim Behav Biometeorol 2021:9:2125. https://doi.org/10.31893/jabb.21025. [ Links ]
71. Finocchiaro R, van Kaam JBCHM, Portolano B. Effect of weather conditions on somatic cell score in Sicilian Valle del Belice ewes. Ital J Anim Sci 2007;6(Suppl. 1):130-132. https://doi.org/10.4081/ijas.2007.1s.130. [ Links ]
72. Bohmanova J, Misztal I, Cole JB. Temperature-humidity indices as indicators of milk production losses due to heat stress. J Dairy Sci 2007;90:1947-1956. https://doi.org/10.3168/jds.2006-513. [ Links ]
73. Ramón M, Díaz C, Pérez-Guzmán MD, Carabaño MJ. Effects of exposure to adverse climatic conditions on production in Manchega dairy sheep. J Dairy Sci 2016;99(7):5764-5779. https://doi.org/10.3168/jds.2016-10909. [ Links ]
Received: September 11, 2023; Accepted: July 30, 2024
 Este es un artículo publicado en acceso abierto bajo una licencia Creative Commons
