


Servicios Personalizados
Revista
Articulo
 texto en
  Inglés (pdf)
 Artículo en XML
 Referencias del artículo
 Enviar artículo por email
Indicadores
-
 Citado por SciELO
 -
 Accesos
Links relacionados
-
 Similares en
SciELO
Similares en
SciELO
Compartir

 Permalink
Revista mexicana de ciencias agrícolas
versión impresa ISSN 2007-0934
Rev. Mex. Cienc. Agríc vol.13 no.4 Texcoco may./jun. 2022 Epub 22-Ago-2022
https://doi.org/10.29312/remexca.v13i4.2927
Articles
Physiological and numerical components of canola yield affected by density and sowing system
1Maestría en Ciencias Agropecuarias y Recursos Naturales-Universidad Autónoma del Estado de México. (koetesfwck@hotmail.com; wardndc@hotmail.com).
2Facultad de Ciencias Agrícolas-Universidad Autónoma del Estado de México. (cgmartinezr@uaemex.mx; adominguezl@uaemex.mx).
In the present work, the physiological and numerical components of canola yield affected by density and sowing system were evaluated. Two spring canola genotypes were evaluated: Hyola 61 (hybrid) and Bioaureo 2486 (open pollination) under three densities (50, 75 and 90 seeds m-2), during the 2019-2020 winter-spring cycle. The treatments were established under a randomized complete block design with four repetitions, in each of the two systems, FBS (flat bed system) and DRBS (double-row bed system), that were considered as environments. The FBS presented the highest yield (4.9 t ha-1) on average. Changes in seed yield were associated with a higher biomass production at maturity. Bioaureo 2486 exceeded by 7% the number of seeds obtained by Hyola 61 in the density of 90 plants m-2. The number of seeds per m2 was positively associated with the number of siliques per m2. However, the increase in plant density decreased the number of branches.
Keywords: Brassica napus L.; biomass; number of seeds; population density
En el presente trabajo se evaluaron los componentes fisiológicos y numéricos del rendimiento en canola afectados por la densidad y sistema de siembra. Se evaluaron dos genotipos primaverales de canola: Hyola 61 (híbrido) y Bioaureo 2486 (polinización abierta) bajo tres densidades 50, 75 y 90 semillas m-2), durante el ciclo invierno-primavera 2019-2020. Los tratamientos se establecieron bajo un diseño de bloques completos al azar con cuatro repeticiones, en cada uno de los dos sistemas SCP (sistema cama plana) y SCDH (sistema cama doble hilera) que fueron considerados como ambientes. El SCP presentó en promedio el mayor rendimiento (4.9 t ha-1). Los cambios en el rendimiento de semilla estuvieron asociados a una mayor producción de biomasa a madurez. Bioaureo 2486 superó en 7% el número de semillas obtenido por Hyola 61 en la densidad de 90 plantas m-2. El número de semillas por m2 estuvo asociado positivamente con el número de silicuas por m2. Sin embargo, el aumento en la densidad de plantas disminuyó el número de ramas.
Palabras clave: Brassica napus L.; biomasa; densidad de población; número de semillas
Introduction
Canola (Brassica napus L.) is an oilseed recognized for the quality of its edible oil, whose essential fat content can prevent heart diseases (Kirkegaard et al., 2016). The world area sown with this crop is 37 579 575 ha, with a production of more than 75 million tonnes and an average yield of 1.9 t ha-1 (FAOSTAT, 2018). In Mexico, during 2018, 2 058 ha were harvested, with a production of 1 473 t and an average yield of 0.715 t ha-1 (CONASIPRO, 2019). The most outstanding states in the production of canola in this year were Tamaulipas, State of Mexico, Tlaxcala, Hidalgo and Jalisco, with Tamaulipas standing out with 91% of the area sown and volume of production; however, this entity has had the lowest yields (0.6 t ha-1), while the State of Mexico and Hidalgo obtain the highest (2.5 t ha-1) (CONASIPRO, 2019).
Population density has an important effect on canola growth and yield, and it strongly depends on the spatial arrangement (distance between plants and between rows) and the type of cultivar (free-pollinated populations or hybrids) (Rathke et al., 2006). Worldwide, different population densities have been evaluated in canola, which range from 8 to 190 plants m-2, observing a differential effect between the factors that influence the yield, such as: the distance between rows, distance between plants, environmental factors and fertilization dose, etc.
For example, Hosseini et al. (2006) concluded that an increase in plant density significantly reduces the length of the main inflorescence and the total number of siliques per plant, but increased the plant height, these authors found that the highest seed yield was obtained with 190 plants m-2 and claim that the optimal plant density increases the competitive capacity of canola against weeds. In the same way, Mobasser et al. (2008) observed that an increase in plant density decreased plant height, stem diameter, number of siliques per plant, silique length and seed yield. The highest seed yield occurred with a density of 80 plants m-2.
Similarly, Kazemeini et al. (2010) determined that 90 plants m-2 is the optimal density for canola cultivation, stating that this density positively influences the seed weight of secondary siliques, which contributes to improving seed yield and biomass production. On the other hand, Li et al. (2014) observed that increases in density reduce plant height, the number of branches and siliques per plant and the harvest index; however, a higher density of plants can improve the adaptability of canola by regulating plant structure.
Similarly, Wang et al. (2015) concluded that the increase in plant density complemented with an adequate spatial arrangement between plots and rows can be considered as an optimal practice for increasing canola yield. On the other hand, there is evidence that, in the cultivation of canola, with low densities, it is possible to obtain seed yields comparable to those obtained with high densities (Gan et al., 2016; Rondanini et al., 2017), which may be attributable to changes in plant morphology (number of branches). The variability in the results obtained in previous studies shows that there is a need to understand the effects of genotype, plant density and sowing system on yield, in order to better channel agronomic management strategies aimed at increasing the productivity of the crop.
In the region of the high valleys of Mexico, there is no record of works where these factors are compared, so it is important to elucidate their effect on the physiological and numerical components of the yield, which allow optimizing management practices aimed at increasing the production levels of this crop and expanding their adoption in potential agricultural areas. Based on the above, the present work was carried out with the aim of evaluating the effect of two sowing systems, three densities and two genotypes on the physiological and numerical components of seed yield in canola cultivation.
Materials and methods
Location of experimental work
The experiment was carried out in the 2019-2020 winter-spring cycle at the Faculty of Agricultural Sciences, dependent on the Autonomous University of the State of Mexico, located 18 km north of the city of Toluca, with geographical coordinates of 19° 15’ 33” north latitude, 99° 39’ 38” west longitude and at an altitude of 2 640 masl. The predominant climate is type C (w2) (w) b (i), which corresponds to a subhumid temperate climate, the most humid of the subhumid climates, with rainfall in summer and little rainfall in winter (5%), little thermal oscillation, average annual temperature of 12.8 ºC and average annual rainfall of 900 mm.
The predominant soil of the region is of the pelic vertisol type of volcanic origin, it has a mineral horizon with a low content of organic matter that ranges from 1.01 to 2.36%. The color of the dry surface horizon is dark grayish-brown or dark gray with clay contents of 20 to 36.4%. In the soil profile, a horizon with tillage disturbances showing compaction due to plow floor can be distinguished, the amount of organic matter is very low, it ranges from 0.07 to 1.01 (Gil et al., 2014).
Treatments and experimental design
Two sowing systems were evaluated, DRBS: double-row bed system (24 plots) and FBS: flat bed system (24 plots). The treatments derived from the factorial arrangement of two canola genotypes, Hyola 61 (hybrid) and Bioaureo 2486 (open pollination), and 3 densities were established under a randomized complete block design with four repetitions in each of the aforementioned systems (two serial experiments) considering the two sowing systems.
General conditions of the experiment
The sowing was carried out on December 7, 2019, in two sowing systems, the first made up of plots of 3 m in length with three beds 80 cm apart with two rows, each 20 cm apart (7.2 m2) double-row bed system (DRBS), while the second had plots of 5 rows of 3 m in length and separated from each other at 0.3 m (4.8 m2) flatbed system (FBS). Three sowing densities were used, 50, 75 and 90 seeds m-2. To ensure the three sowing densities, the seed was placed on biodegradable paper tapes at a distance that would guarantee the required density. The crop was kept with moisture at field capacity during its cycle and without nutritional restrictions, so it was fertilized with a formula of 150-60-30 (NPK), using urea as source of nitrogen, triple calcium superphosphate as a source of phosphorus, potassium chloride as a source of this element.
Biomass production, yield and its components
At physiological maturity, the plants in a linear meter of the central furrow of each plot were cut and separated into branches and main stem, separating the siliques of each stratum. The dry matter of each stratum (branches, main stem and siliques) was determined after drying in a forced air oven for 72 h at 60 °C. The siliques of each stratum were counted and threshed separately to obtain the dry weight of seed (yield). The number of siliques, the number of seeds per silique and the number of seeds per m2 were determined. The weight of 1 000 seeds was determined by counting and weighing 1 000 seeds of each experimental unit.
Statistical analysis
The response variables of the experiment were subjected to a combined analysis of variance and when the F test of the analysis of variance was significant, the mean test was performed using the honest minimum significant difference (HMSD) or Tukey test at a significance level of 5% (Palaniswamy and Palaniswamy, 2006), using the statistical package R for Windows version 4.0.5 based on the following model:
Where:
is the general mean,
is the effect of the i-th system,
is the effect of the j-th block within systems and was the error term used to test systems,
is the effect of the k-th density,
is the effect of the l-th genotype,
is the effect of the interaction of the k-th density on the i-th system,
is the effect of the i-th system on the l-th genotype,
is the effect of the k-th density on the l-th genotype,
is the interaction of the i-th system in the k-th density in the l-th genotype and
is the general error term. The relationships between variables were determined by linear regression and the association between them by correlation analysis (Jandel, 1991).
Results and discussion
Climatic conditions
The climatic conditions during the development of the experiments are shown in Figure 1, in which it is observed that the emergence occurred 14 days after sowing. On the other hand, it can be seen that the beginning of the reproductive period in both genotypes coincided with favorable temperatures for the crop. It should be noted that precipitation during the reproductive period was very scarce, but this was not a limitation since the crop was established under irrigation conditions. Towards physiological maturity, an increase in the recorded precipitation levels was observed, which did not affect the development of the experiment. In general, factors such as precipitation and temperature were favorable for the development of the experiment.
The results of the analysis of variance presented in Table 1 show that for the factor sowing system, highly significant differences (p< 0.01) were only observed for the variables biomass, weight of 1 000 seeds and number of branches. On the other hand, for genotypes, highly significant differences (p< 0.01) were observed in biomass, weight of 1 000 seeds and number of branches and significant differences (p< 0.05) were only observed for harvest index. For the interactions, no significant effects were observed for most of the variables, except for the interaction system x density x genotype, which showed highly significant effects (p< 0.01) for number of siliques. Finally, the coefficients of variation ranged between 1.2 and 20.8, which correspond to the variables weight of 1 000 seeds and biomass at physiological maturity, these coefficients are considered acceptable given the nature of the experiment.
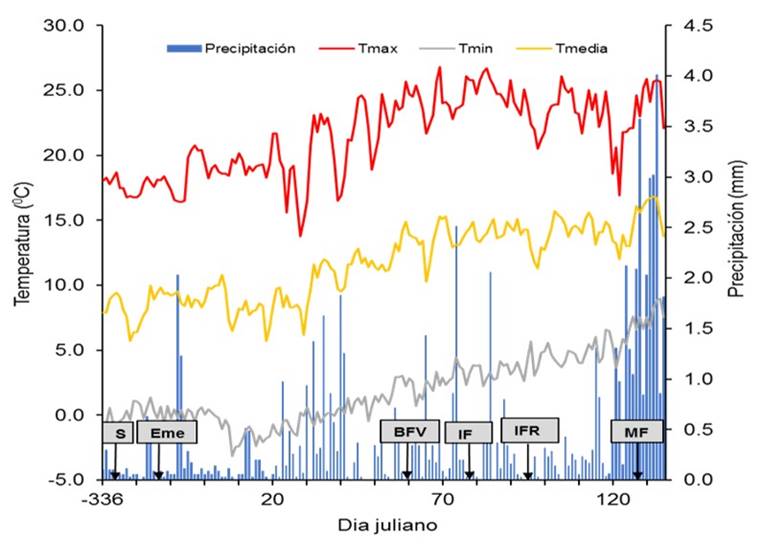
Figure 1 Agroclimatic conditions occurred during the conduct of the experimental work. (S= sowing; Eme= emergence; BFV= visible flower bud; IF= beginning of flowering; IFR= beginning of fruiting; MF= physiological maturity).
Table 1 F values and their statistical significance for the variables evaluated in the two sowing systems, three densities and two canola genotypes in Toluca, Mexico.
| Source of variation | df | YIELD (g m-2) | BIOM (g m-2) | HI | NG (m2) | W1000S (g) | NS (m2) | NSPS | NB |
| Systems(S) | 1 | 0.4 ns | 13.2 ** | 3 ns | 0.1 ns | 24.7 ** | 3.6 ns | 1.3 ns | 15.7 ** |
| Blocks (System) | 6 | 2.5 * | 0.9 ns | 0.6 ns | 2.5 * | 0.1 ns | 0.9 ns | 1.4 ns | 2.5 * |
| Densities (D) | 2 | 9.7 ** | 7.6 ** | 1.1 ns | 9.3 ** | 0 ns | 108.1 ** | 0.4 ns | 22 ** |
| Genotypes (G) | 1 | 1.3 ns | 8.2 ** | 4.6 * | 0.9 ns | 7.4 ** | 2.5 ns | 0 ns | 20.8 ** |
| S x D | 2 | 0.2 ns | 0.6 ns | 0.9 ns | 0.1 ns | 0.6 ns | 2.9 ns | 1.5 ns | 3 ns |
| S x G | 1 | 3.5 ns | 0.4 ns | 0.5 ns | 3.5 ns | 0 ns | 0.3 ns | 0 ns | 1.3 ns |
| D x G | 2 | 0.3 ns | 0.9 ns | 1.1 ns | 0.3 ns | 0.2 ns | 0.7 ns | 0.5 ns | 2.5 ns |
| S x D x G | 2 | 0.1 ns | 0.5 ns | 0.9 ns | 0.1 ns | 1.2 ns | 13.6 ** | 0.3 ns | 1 ns |
| CV (%) | 17.4 | 20.8 | 20 | 17.5 | 1.2 | 8.6 | 14.1 | 10 |
BIOM= biomass at maturity; HI= harvest index; NG= number of seeds per m2; W1000S= weight of 1 000 seeds; NS= number of siliques per m2; NSPS= number of seeds per silique; NB= number of branches; *= significant at 0.05; **= significant at 0.01; ns= not significant and df= degrees of freedom.
Table 2 shows the comparison of means for the variables evaluated, where the flat bed system (FBS) was significantly higher than the double-row bed system (DRBS) in biomass production, weight of 1 000 seeds and number of branches per plant, for the rest of the characters both sowing systems were statistically the same. The superiority of the flat bed system over the double-row bed system lies in the fact that, in the first, the separation of the rows was 30 cm, while in the second, the separation was 20 cm, but in beds 80 cm apart. Evidence in the literature shows that a smaller spacing between rows produces a higher seed yield as a result of a higher number of siliques and seeds per m2 (Shahin and Valiollah, 2009; Uzun et al., 2012).
Table 2 Mean values of the variables evaluated in two sowing systems, three densities and two canola genotypes in Toluca, Mexico.
| YIELD (g m-2) | BIOM (g m-2) | HI | NG (m2) | W1000S (g) | NS (m2) | NSPS | NB | |
| System | ||||||||
| FBS | 493.3 a | 2 609.7 a | 0.19 a | 128549 a | 3.8 a | 2 117.8 a | 19.6 a | 5.5 a |
| DRBS | 467.6 a | 2 115.6 b | 0.2 a | 124135 a | 3.7 b | 2 216.7 a | 20.7 a | 4.5 b |
| Mean | 480.4 | 2 362.6 | 0.15 | 126342 | 3.7 | 2 167.2 | 20.1 | 5 |
| Density | ||||||||
| D90 | 552.4 a | 2 692.7 a | 0.2 a | 145007 a | 3.8 a | 2 541.8 a | 19.7 a | 4.4c |
| D75 | 463.8 b | 2 381 ba | 0.18 a | 122060 b | 3.8 a | 2 343.1 b | 20.1 a | 5 b |
| D50 | 425.2 b | 2 014.2 b | 0.2 a | 111958 b | 3.8 a | 1 616.9 c | 20.6 a | 5.6 a |
| Mean | 480.4 | 2 362.6 | 0.16 | 126341 | 3.8 | 2 167.2 | 20.1 | 5 |
| Genotype | ||||||||
| Hyola 61 | 466.3 a | 2 158.6 b | 0.21 a | 123181 a | 3.7 b | 2 124.3 a | 20.2 a | 4.7 b |
| Bioaureo 2486 | 494.6 a | 2 566.6 a | 0.18 b | 129502 a | 3.8 a | 2 210.2 a | 20 a | 5.3 a |
| Mean | 480.4 | 2 362.6 | 0.19 | 126341 | 3.7 | 2 167.2 | 20.1 | 5 |
BIOM= biomass at maturity; HI= harvest index; NG= number of seeds per m2; W1000S= weight of 1 000 seeds; NS= number of siliques per m2; NSPS= number of seeds per silique; NB= number of branches. Means with the same letter within columns do not differ significantly from each other, at a significance level of 0.05 of the Tukey test.
Increases in plant density are reflected in higher biomass production and seed yield, as a result of a higher number of seeds per m2 (Shahin and Valiollah, 2009; Uzun et al., 2012). The data reveal that D90 (90 plants m-2) was statistically higher than D75 (75 plants m-2) and D50 (50 plants m-2) in most of the variables evaluated, except for the harvest index, weight of 1 000 seeds and number of seeds per silique.
The genotypic effect on population density in canola has been analyzed in many studies, where differences in seed yield have been minimal (Różyło and Pałys, 2014), while others mention that differences in yield may be due to the different structure of the plant (Waseem et al., 2014). In this sense, our data show that Hyola 61 was statistically higher (14%) than Bioaureo 2486 in harvest index, while Bioaureo 2486 was statistically higher than Hyola 61 in biomass production (18%), weight of 1 000 seeds (3%) and number of branches (11%) (Table 2). The differences in some characteristics between both cultivars may be due to the different plant structure that exists between them since Hyola 61 produces fewer branches than Bioaureo 2486.
The production of biomass at maturity and the harvest index are very important characteristics to reach high yields in grain crops and particularly in canola (Zhang and Flottmann, 2016). The contribution of both characters to seed yield strongly depends on the type of cultivar (hybrid or open pollination), but usually biomass production largely explains changes in seed yield (Li et al., 2016). The data indicate that, when considering sowing systems, densities and genotypes, seed yield was mainly explained by the changes observed in biomass production at maturity (r2= 0.81, p< 0.001) and not by the harvest index (Figure 2), apparently the latter was more stable, as has been reported in other grain crops such as triticale (Estrada et al., 2012) and wheat (Parry and Hawkesford, 2010).
It has been established that the distance between rows is a very important management factor since it affects the seed yield and the components of the yield in individual plant in canola (Uzun et al., 2012; Różyło and Pałys, 2014). Our data revealed that when densities and genotypes are considered, the flat bed system (5 rows to 30 cm) obtained a higher biomass production compared to the double-row bed system (Table 3; Figure 2a).
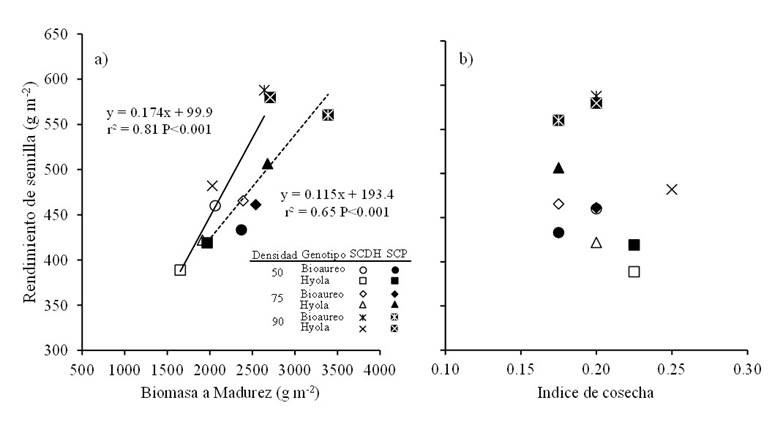
Figure 2 Relationships between seed yield and biomass produced at maturity (a) and with harvest index (b) for two canola cultivars grown under three plant densities and in two sowing systems in Toluca, Mexico. Solid and dashed lines in the graph are the regression models fitted for DRBS (SCDH) and FBS (SCP), respectively.
On the other hand, increases in sowing density significantly increased seed yield in both sowing systems, with increases of 22 and 20% when going from 50 to 90 plants m-2 in Bioaureo 2486 and Hyola 61, respectively, for the double-row bed system. While in the flat bed system, the increases in yield, when going from 50 to 90 plants m-2, were 23 and 28% for Bioaureo 2486 and Hyola 61, respectively (Table 3).
Cuadro 3 Valores medios de las variables evaluadas para sistema, densidad y genotipo en el cultivo de canola en Toluca, México.
| Density | Genotype | YIELD (g m-2) | BIOM (g m-2) | HI | NG (m2) | |||||||
| DRBS | FBS | DRBD | FBS | DRBS | FBS | DRBS | FBS | |||||
| 50 | Bioaureo | 460bA | 433bA | 2 063aA | 2370bA | 0.2aA | 0.17aB | 121992aA | 112509bA | |||
| Hyola | 388bA | 419bA | 1 653bA | 1969cA | 0.22aA | 0.22aA | 103026bA | 110304bA | ||||
| 75 | Bioaureo | 465aA | 461aA | 2 392aA | 2540bA | 0.17bB | 0.2aA | 122524aA | 119953bA | |||
| Hyola | 422bA | 506aA | 1 913aB | 2677aA | 0.2aA | 017aB | 113408bA | 132354aA | ||||
| 90 | Bioaureo | 587aA | 560aA | 2 641aB | 3390aA | 0.2aA | 0.17aB | 155491aA | 144541aA | |||
| Hyola | 482aA | 579aA | 2 029aB | 2709aA | 0.25aA | 0.2aB | 128366aA | 151628aA | ||||
| 467A | 493A | 2 115B | 2609A | 0.2A | 0.19A | 124135A | 128549A | |||||
| W1000S(g) | NS (m2) | NSPS | NB | |||||||||
| 50 | Bioaureo | 3.8aA | 3.9aA | 1 724A | 1 538cB | 21.5aA | 19.2aA | 5.7aA | 6aA | |||
| Hyola | 3.8aA | 3.8aA | 1 662A | 1 543cA | 22.1aA | 19.8aA | 5aB | 5.7aA | ||||
| 75 | Bioaureo | 3.8aA | 3.9aA | 2 620B | 2 119bA | 22.3aA | 19.0aB | 4.5bB | 6aA | |||
| Hyola | 3.7aA | 3.8aA | 2 292A | 2 340bA | 20aA | 19.1aA | 4.2bB | 5.5aA | ||||
| 90 | Bioaureo | 3.8aA | 3.9aA | 2 385B | 2 873aA | 18.6aA | 19.9aA | 4.7aA | 5.2bA | |||
| Hyola | 3.8aA | 3.8aA | 2 616B | 2 291bA | 20aA | 20.4aA | 3.2cA | 4.5bB | ||||
| 3.7A | 3.8A | 2 216A | 2 117A | 20.7A | 19.A | 4.5B | 5.5A | |||||
REND= Rendimiento; BIOM= biomasa a madurez; IC= índice de cosecha; NG= número de semillas por m2; P1 000S= peso de 1 000 semillas; NS= número de silicuas por m2; NSPS= número de semillas por silicua; NR= número de ramas; S= sistema; D= densidad; G= genotipo. Medias con la misma letra mayúscula no son diferentes entre sistemas y misma letra minúscula dentro de columnas las medias no difieren significativamente entre si, a un nivel de significancia del 0.05 de la prueba de Tukey.
Positive effects in reducing the distance between rows have been reported in numerous studies, for instance, Shahin and Valiollah (2009), when evaluating three distances between rows (12, 18 and 24 cm), found significant increases in seed yield in rows 12 cm apart. On the other hand, Uzun et al. (2012), when evaluating different spacings between plants (5, 10, 15 and 20 cm) and between furrows (10, 20, 30 and 40 cm), found a higher yield with distances between plants of 5 to 10 cm and separation between furrows of 10 cm. In the same way, Różyło and Pałys (2014), when evaluating different spacings between furrows, found that greater separation decreased both biomass production and yield per m2. Recently, French et al. (2016), when evaluating densities between 7 and 180 plants m-2, found that the optimal average density was 32 plants m-2 and as the density increased there was a positive effect on yield.
The analysis of the numerical components of yield in grain crops has shown that the most important component in determining yield is the number of grains per m2 (Cheng-dong et al., 2019). As expected, changes in seed yield, when considering sowing systems, densities and cultivars, were explained by the number of seeds per m2 (r2= 0.99, p< 0.001; Figure 3a), since no degree of association was observed for individual seed weight (Figure 3b). Between both cultivars, it was observed that the increase in sowing density positively affected the number of seeds per m2, mainly in the double-row bed system, however, this did not statistically affect the individual seed weight (Figure 3b).
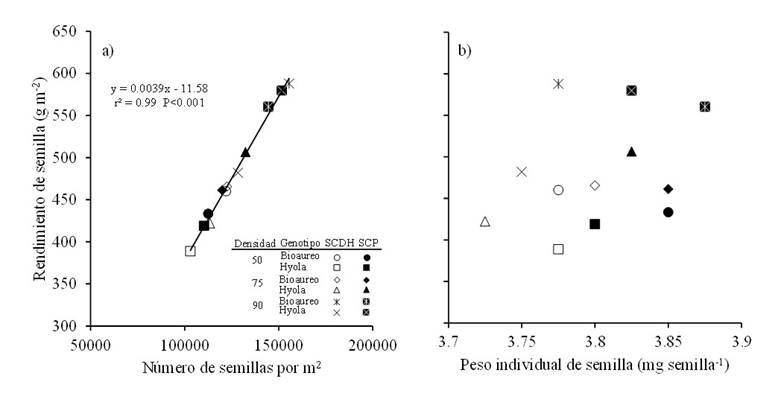
Figure 3 Relationships between seed yield and number of seeds per m2 (a) and with individual seed weight (b) for two canola cultivars grown under three population densities and in two sowing systems in Toluca, Mexico. The solid line in the graph represents the regression model fitted for both systems.
It should be noted that the number of seeds per m2 had a moderate and positive association with the number of siliques per m2 (r2= 0.41 p< 0.05) (Figure 4a) when considering the joint effect of sowing systems, densities and cultivars, while for the same number of seeds per silique, changes in the number of seeds per m2 were observed (Figure 4b). These results highlight the importance of the number of siliques as a characteristic strongly associated with seed yield through the number of seeds (Shahin and Valiollah, 2009). The number of siliques per plant depends on the number of branches, number of flower clusters and how many of these siliques set (Shahin and Valiollah, 2009; Assefa et al., 2018) and is a character that compensates for losses in yield due to low density in potentially good environments, because a greater number of siliques per productive branch is achieved when the sowing density is reduced (Assefa et al., 2018).
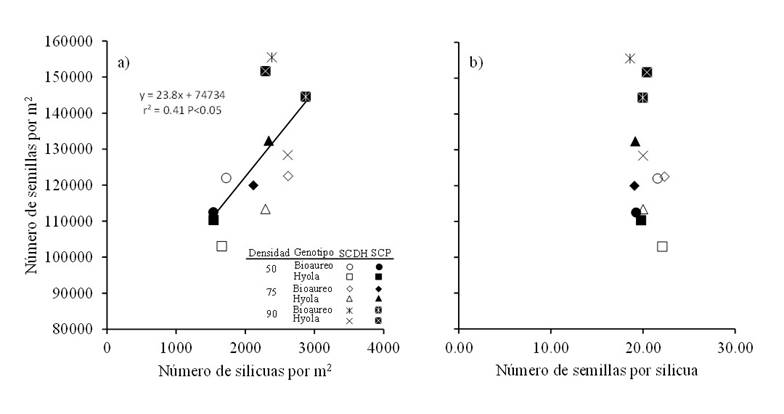
Figure 4 Relationships between the number of seeds per m2 with the number of siliques per m2 (a) and with the number of seeds per silique (b) for two canola cultivars grown under three population densities and in two sowing systems in Toluca, Mexico. The solid line in the graph represents the regression model fitted for both systems.
The number of productive branches in canola is a characteristic that is largely associated with seed yield, and it also responds significantly to changes in the environment and management practices (Shahin and Valiollah, 2009; Hua et al., 2014). In this sense, reductions in the number of branches are observed when the sowing density is increased (Uzun et al., 2012; Vincze, 2017) or when there are delays in the sowing date (Hua et al., 2014; Vincze, 2017). Our data reveal that the number of siliques per m2 was associated with the changes observed in the number of productive branches, mainly in the flat bed system (r2= 0.83, p< 0.01) (Figure 5).
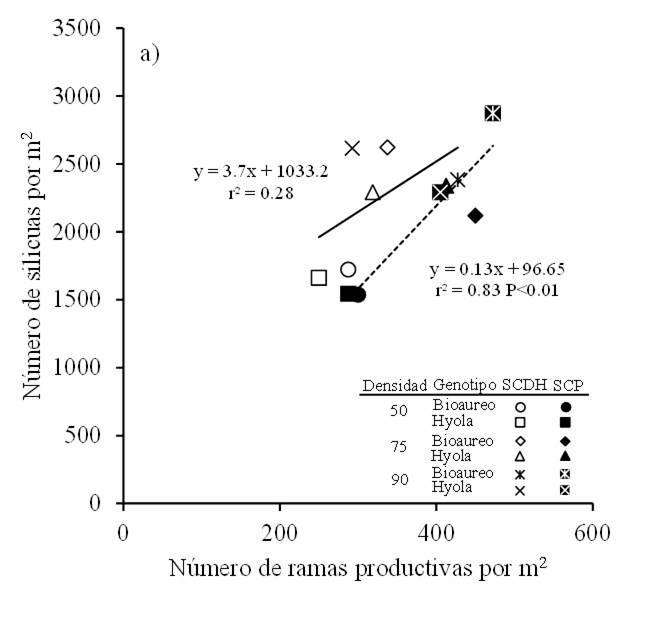
Figure 5 Relationship between the number of siliques per m2 and the number of branches per m2 for two canola cultivars grown under three population densities and in two sowing systems in Toluca, Mexico. Solid and dashed lines in the graph are the regression models fitted for DRBS (SCDH) and FBS (SCP), respectively.
Seed yield was positively associated with biomass production at physiological maturity, with the number of seeds per m2 and with the number of siliques per m2 (Table 4), which is consistent with numerous studies in the literature that indicate that these attributes are defining in canola seed yield (Shahin and Valiollah, 2009; Uzun et al., 2012; Mamun et al., 2014; Yang et al., 2014). On the other hand, the biomass at physiological maturity was positively correlated with the number of seeds, with the weight of 1 000 seeds and with the number of siliques per m2, while a negative association was observed with the harvest index.
As expected, the number of seeds per m2 was positively correlated with the number of siliques per m2, which indicates the great influence of the number of siliques in the determination of the number of seeds and the yield in canola, coinciding with previous evidence in the literature (Shahin and Valiollah, 2009; Kazemeini et al., 2010). On the other hand, there was a negative association between the number of siliques per m2 and the number of branches. This is a very important aspect to consider when varying density, since the number of productive branches tends to be affected both by density and by delays in the sowing date (Kazemeini et al., 2010; Vincze, 2017; Assefa et al., 2018). The weight of 1 000 seeds showed a positive association with the number of branches.
Table 4 Coefficients of correlation between the evaluated characters.
| YIELD | BIOM | HI | NG | W1000S | NS | NSPS | |
| Biom | 0.708** | ||||||
| HI | 0.029 | -0.453** | |||||
| NG | 0.997** | 0.68** | 0.048 | ||||
| W1000S | 0.188 | 0.473** | -0.257 | 0.117 | |||
| NS | 0.468** | 0.502** | -0.098 | 0.468** | 0.025 | ||
| NSPS | -0.106 | -0.178 | -0.067 | -0.091 | -0.211 | -0.02 | |
| NB | -0.099 | 0.14 | -0.218 | -0.13 | 0.448** | -0.444** | -0.06 |
**= Highly significant at 0.01. YIELD= seed yield (g m-2); BIOM= biomass at physiological maturity (g m-2); HI= harvest index; NG= number of seeds per m2; W1000S= weight of 1 000 seeds (g); NS= number of siliques per m2; NSPS= number of seeds per silique; NB= number of productive branches per plant.
Conclusions
In terms of physiological components, seed yield was explained by the changes observed in biomass production at maturity and not by the harvest index. The highest seed yield was obtained with the flat bed system, the genotype Bioaureo 2486 and a sowing density of 90 plants m-2. With the flat bed system (5 rows at 30 cm), a higher biomass production was obtained compared to the double-row bed system. The two cultivars showed differences in their plant structure, Hyola 61 produced fewer branches than Bioaureo 2486.
Acknowledgements
The author G. García-Hernández would like to thank the National Council of Science and Technology (CONACYT, for its acronym in Spanish) for the scholarship that allowed him to complete his Master’s degree in Agricultural Sciences and Natural Resources. The present work was part of the project ‘Ecophysiological attributes of biomass yield and production in grain crops modified by population density and sowing system’ with registration number in the UAEMex
REFERENCES
Assefa, Y.; Carter, P.; Hinds, M.; Bhalla, G.; Schon, R.; Jeschke, M.; Paszkiewicz, S.; Smith, S. and Ciampitti, I. A. 2018. Analysis of long-term study indicates both agronomic optimal plant density and increase maize yield per plant contributed to yield gain. Sci. Rep. 8(1):1-11. https://doi.org/10.1038/s41598‐018‐23362‐x. [ Links ]
Cheng-dong, H.; Quan-quing. L.; Xiao-lin, L. and Chao-chun, Z. 2019. Effect of intercropping on maize grain yield and yield components. J. Integrative Agric. 18(8):1690-1700. Doi:10.1016/s2095-3119(19)62648-1. [ Links ]
CONASIPRO. 2019. Bases de datos oleaginosas mundial y nacional 1980-2018. http://www.oleaginosas.org/cat-69.shtml#51. [ Links ]
Estrada, C. G.; Slafer, G. A. and Miralles, D. J. 2012. Differences in yield, biomass and their components between triticale and wheat grown under contrasting water and nitrogen environments. Field Crops Res. 128:167-179. https://doi.org/10.1016/j.fcr.2012.01.003. [ Links ]
FAOSTAT. 2018. Organización de las Naciones Unidas para la Agricultura y la Alimentación. Base de datos estadísticos. http://www.fao.org. [ Links ]
French, R. J.; Seymour, M. and Malik, R. S. 2016. Plant density response and optimum crop densities for canola (Brassica napus L.) in Western Australia. Crop Pasture Sci. 67(4):397-408. https://doi.org/10.1071/CP15373. [ Links ]
Gan, Y.T.; Harker, K. N.; Kutcher, H. R.; Gulden, R. H.; Irvine, B.; May, W. E. and O’Donovan, J. T. 2016. Canola seed yield and phenological responses to plant density. Can. J. Plant Sci. 96(1):151-159. https://doi.org/10.1139/cjps-2015-0093. [ Links ]
Gil, H.; Martínez, C. G y Estrada, G. 2014. Impacto del sistema de labranza y dosis de nitrógeno en el rendimiento y calidad nutricional de forraje de avena. Rev. Mex. Cienc. Agríc. 6(5):951-964. [ Links ]
Hosseini, M. N.; Alizadeh, H. M. and Ahmadi, H. M. 2006. Effects of plant density and nitrogen rates on the competitive ability of canola (Brassica napus L.) against weeds. J. Agric. Sci. Technol. 8(4):281-291. [ Links ]
Hua, S.; Lin, B.; Hussain, N.; Zhang, Y.; Yu, H.; Ren, Y.; Ding, H. and Zang, D. 2014. Delayed planting affects seed yield, biomass production, and carbohydrate allocation in canola (Brassica napus). Int. J. Agric. Biol. 16(4):671-680. [ Links ]
Jandel, 1991. Table Curve v. 3.0. User’s Manual Versión 3.0. AISN Software. Jandel Scientific, Corte Madera, CA. [ Links ]
Kazemeini, A.; Edalat, M.; Shekoofa, A. and Hamidi, R. 2010. Effects of nitrogen and plant density on rapeseed (Brassica napus L.) yield and yield components in Southern Iran. Rev. Cienc. Aplicadas. 10(14):1461-1465. Doi:10.3923/jas.2010.1461.1465. [ Links ]
Kirkegaard, A. J.; Lilley, M. J. and Morrison, M. J. 2016. Drivers of trends in Australian canola productivity and prospects. Crop Pasture Sci. 67(4):i-ix. https://doi.org/10.1071/CPv67n4-FO. [ Links ]
Li, S. Y.; Yu, C. B.; Zhu, S.; Xie, L. H.; Hu, X. J.; Liao, X.; Liao, S. X. and Che, Z. 2014. High planting density benefits to mechanized harvest and nitrogen application rates of oilseed rape (Brassica napus L.). Soil Sci. Plant Nutr. 60(3):384-392. Doi:10.1080/00380768. 2014.895417. [ Links ]
Li, X.; Li, Q.; Yang, T.; Nie, Z.; Chen, G. and Hu, L. 2016. Responses of plant development, biomass and seed production of direct sown oilseed rape (Brassica napus L.) to nitrogen application at different stages in Yangtze River Basin. Field Crops Res. 194:12-20. Doi: 10.1016/j.fcr.2016.04.024. [ Links ]
Mamun, F.; Ali, M. H.; Chowdhury, I. F.; Hasanuzzaman, M. and Matin, M. A. 2014. Performance of rapeseed and mustard varieties grown under different plant density. Sci. Agric. 4(2):70-75. Doi: 10.15192/PSCP.SA.2014.4.2.7075. [ Links ]
Mobasser, H. R.; Shojaee-Ghadikolaee, M.; Nasiri, M.; Daneshian, J.; BarariTari, D. and Pourkalhor, H. 2008. Effect of nitrogen rates and plant density on the agronomic traits of canola (Brassica napus L.) in paddy field. Asian J. Plant Sci. 7(2):233-236. Doi:10.3923/ajps.2008.233.236. [ Links ]
Palaniswamy, U. R. and Palaniswamy, K. M. 2006. Handbook of statistics for teaching and research in plant and crop science. The Harworth Press, Inc., New York. 624 p. [ Links ]
Parry, M. A. J. and Hawkesford, M. J. 2010. Food security: increasing yield and improving resource use efficiency. Proceed. Nutr. Soc. 69(04):592-600. https://doi.org/10.1017/ S0029665110003836. [ Links ]
Rathke, G. W.; Behrens, T. and Diepenbrock, W. 2006. Integrated management strategies to improve seed yield; oil content and nitrogen efficiency of winter oilseed rape (Brassica napus L.): a review. Agric. Ecosys, Environ. 117(2-3):80-108. https://doi.org/10.1016/ j.agee.2006.04.006. [ Links ]
Rondanini, D. R.; Menéndez, Y. C.; Gómez, N. V.; Miralles, D. J. and Botto, J. F. 2017. Vegetative plasticity and floral branching compensate low plant density in modern spring rapeseed. Field Crop Res. 210:104-113. https://doi.org/10.1016/j.fcr.2017.05.021. [ Links ]
Różyło, K. and Pałys, E. 2014. New oilseed rape (Brassica napus L.) varieties-canopy development, yield components, and plant density. Section B - Soil & Plant Sci. Acta Agric. Scandinavica 64(3):260-266. [ Links ]
Shahin, Y. and Valiollah, R. 2009. Effects of row spacing and seeding rates on someagronomical traits of spring canola (Brassica napus L.) cultivars. J. Cent. Eur. Agric. 10(1):115-212. [ Links ]
Uzun, B.; Yol, E. and Furat, S. 2012. The influence of row and intra-row spacing to seed yield and its components of winter sowing canola in the true Mediterranean type of environment. Bulg. J. Agric. Sci. 18(1):83-91. [ Links ]
Vincze, E. 2017. The effect of sowing date and plant density on yield elements of different winter oil seed rape (Brassica napus var. napus F. biennis L.) genotypes. Columella. 1(4):21-25. Doi: 10.18380/szie.colum.2017.4.1.suppl. [ Links ]
Wang, R.; Cheng, T. and Hu, L. 2015. Effect of wide-narrow row arrangement and plant density on yield and radiation use efficiency of mechanized direct-seeded canola in Central China. Field Crops Res. 172:42-52. Doi:10.1016/j.fcr. 2014.12.005. [ Links ]
Waseem, M.; Baloch, D. and Khan, I. 2014. Influence of various row spacing on the yield and yield components of Raya Anmol and Faisal Canola under coastal climatic conditions of Lasbela. Am. J. Plant Sci. 5(15):2230-2237. Doi:10.4236/ajps.2014.515237. [ Links ]
Yang, C.; Gan, Y.; Harker, K. N.; Kutcher, H. R.; Gulden, R.; Irvine, B. and May, W. E. 2014. Up to 32% yield increase with optimized spatial patterns of canola plant establishment in western Canada. Agron. Sustain. Dev. 34:793-801. https://doi.org/10.1007/s13593-014-0218-5. [ Links ]
Zhang, H. and Flottmann, S. 2016. Seed yield of canola (Brassica napus L.) is determined primarily by biomass in a high-yielding environment. Crop Pasture Scie. 67(4):369-380. https://doi.org/10.1071/CP15236. [ Links ]
Received: January 01, 2022; Accepted: March 01, 2022
 Este es un artículo publicado en acceso abierto bajo una licencia Creative Commons
