


 nueva página del texto (beta)
 Inglés (pdf)
 Artículo en XML
 Referencias del artículo
 Enviar artículo por email
 Citado por SciELO
  Similares en
SciELO
Similares en
SciELO 
 Permalink
Introduction
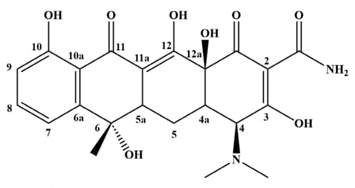
Antibiotics are emerging pollutants of major impact due to high concentration in water and grounds from wrong disposal and the physiological elimination, antimicrobial resistance as consequential and harmful effect in ecosystem and health [1-4]. Tetracycline is one of relevant antibiotics, ((4S,6S,12aS)-4-(dimethylamino)-1,4,4a,5,5a,6,11,12a-octahydro-3,6,10,12,12a-pentahydroxy-6-methyl-1,11-dioxonaphthacene-2-carboxamide), see Fig. 1; wide-spectrum antibiotic implemented to treat bacterial and/or gastrointestinal infections [5].
Chang et al., point out that excessive use of antibiotics has become a great threat to the environment due to their toxicity and can alter the microbial flora in the human intestine [6,7]. Due to the above, various research groups have focused on the characterization study of the tetracycline molecule, reporting its instability in aqueous and non-aqueous media. On the other hand, various values of acidity constants are found in the literature; Schmitt et al. report three values of experimental acidity constants pKa1= 3.3, pKa2= 7.4 and pKa3= 9.3 [6], while theoretical studies report the existence of a fourth value of pKa4 at 12.4 [8], and, solely found in Dictionary of Analitycal Reagents, 1993, five values of acidity constants pKa1= 2.07, pKa2= 6.84, pKa3= 8.75, pKa4= 10.27 and pKa5= 14.45, however, they do not report the methodology by which they were determined. [9]. The acid-base equilibria of biologically active compounds, such as tetracycline, play a crucial role in the quantitative prediction of the predominant species of these compounds in physiological fluids and different water bodies. Hence the importance of obtaining reliable values of the tetracycline acidity constants. Thereby, from UV absorption spectroscopy and capillary zone electrophoresis (CZE), the acidity constants and speciation of tetracycline in aqueous medium are determined.
Experimental
Reagents and chemicals
All solutions were prepared from analytical grade reactants: Tetracycline Sigma Aldrich (98-102 %), NaH2PO4 (Sigma Aldrich, ≥ 98 %), Na2HPO4 (Sigma Aldrich, ≥ 99 %), Na3PO4 (Sigma Aldrich, 96 %), H3PO4 (Sigma Aldrich, 85 %), NaOH 1N (J. T. Baker), HCl 1 N (J. T. Baker), Acetone (Meyer, ≥ 99.5 %), using deionized water of 18.2 MΩcm resistivity, free from organic matter, from a Milli-Q equipment Model 110 V/60HZ. All solutions used in this work were prepared freshly prior to every single experiment, after N2 saturation, maintaining the protective atmosphere during all experiments to prevent oxygen ingress and precluding the flasks from incidence of environmental light. During the experiments the tetracycline solutions were kept at constant temperature, 25 °C using a thermostated cell and a Cole Parmer Polystat® recirculating chiller and ionic strength 0.1 M of NaCl. Phosphates buffer solutions 50mM were made from H3PO4, H2PO4 −, HPO4 2− and PO4 3− 0.5 M stock solutions, adjusting to the required pH value with NaOH and HCl (0.1M).
Equipment
Spectrophotometric measurements were carried out with a Perkin Elmer Lambda 950 UV-Vis Spectrophotometer using quartz cells (1 cm optical path length).
The pH readings were collected by means of a potentiometer sensION PH31 Hach coupled to glass electrode HACH series 5014T (pH range 0-14) and temperature range -10 - 100 °C.
Capillary zone electrophoresis experiments were carried out using a P/ACEMDQ Beckman system with DAD, employing a fused silica capillary of 75 μm I.D.×30 cm length; the sample was injected under pressure for 10s at 1.0 psi, a constant voltage of 20kV was applied at 25◦C. Acetone was used to marker the electroosmotic flow (u eof ). The wavelength for the main channel of the UV detector were 262 nm.
Methodology
Solutions of tetracycline (0.05 mM) were freshly prepared for each pH values (1.613 - 13.005). The acidity constants were determined through SQUAD (Stability Quotients from Absorbance Data) software. [10]. This software was designed to calculate the best values for the stability constants of the proposed equilibrium model by employing a nonlinear least-squares approach. This program has been successfully used to calculate acidity constants of anthraquinones, flavonoids, among others. [11,13].
Results and discussion
Stability study
Fig. 2(a) shows a family of experimental tetracycline UV-Vis spectra at pH 1.056 in different times. It is possible to observe two maximum absorption bands at 262 nm and 359 nm, and the formation of a third band at 216 nm can also be seen. As the time in the solution increases, the absorption in the band at 216 nm increases, this behavior shows the instability of the tetracycline solution. At pH 5.102, the maximum absorption bands are formed at 280 nm and 362 nm (see Fig. 2(b)). Furthermore, it is important to note the formation of a new band at 244 nm.
At pH 8.523, the absorption maxima appear at 278 nm and 362 nm and a slight increase in absorbance in 362 nm as the time in the solution increases, see Fig. 2(c). When increasing to pH 10.004 (Fig. 2(d)), a bathochromic and hyperchromic shift is presented, obtaining maximum absorption bands at 271 nm and 380 nm. At this pH value, the increase in absorbance as a function of time study is notable (16 minutes). Table 1, shows tetracycline degradation percentages (DPTc) at the different pH values studied and it is observed that the molecule presents a higher degradation percentage at pH 1.056 and pH 10.004, however, in all studies, considerable degradation percentages were shown within a period of sixteen minutes. This decomposition behavior is consistent with that reported in the literature [1-4] and it is determined that tetracycline in aqueous medium is not stable in an interval of sixteen minutes.
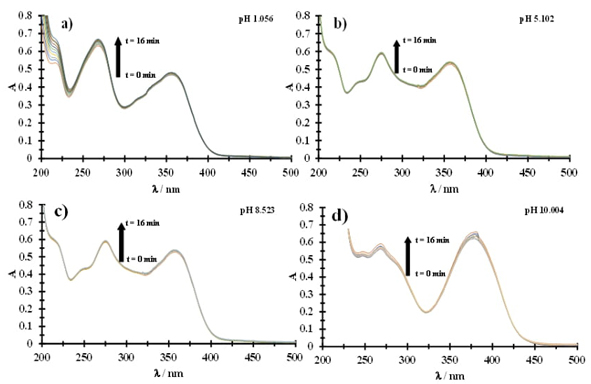
Fig. 2 Family of UV-Vis spectra recorded in a tetracycline 0.043 mM aqueous solution at different times, shown in the figure: (a) pH 1.056, (b) pH 5.102, (c) pH 8.523 and (d) pH 10.004.
Tetracycline acidity constants
Once it is determined that tetracycline is not stable, the determination of the acidity constants of Tc in aqueous medium is carried out by UV absorption spectroscopy using point solutions for each pH value. Fig. 3(a), shows a family of UV absorption spectra of tetracycline 0.05 mM at different pH values (1.631-13.005) and it’s possible to observe to acid pH two absorption maxima at 272 nm and 359 nm. In addition, the presence of a third band at 216 nm can be seen. As the pH increases, a bathochromic and hypochromic shift occurs and the maximum absorption bands are formed in 280 nm y 362 nm; furthermore, it’s important to note the formation of a new band in 244 nm which is indicative of the formation of another species. At pH 11.020, the absorption maxima show bathochromic and hyperchromic behavior at 271 nm and 379 nm. Finally, for pH values close to 13.005, there is a bathochromic and hypochromic shift, presenting the maximum absorption bands at 271 nm and 385 nm. Furthermore, it is possible to appreciate the formation of isosbestic points at 256 nm, 261 nm, 284 nm and 365 nm; these isosbestic points indicate that two or more species in solution have the same molar absorptivity coefficient at the same specific wavelength, which can be associated with the presence of one or more acid-base equilibria and which can be attributed to one or more acidity constants.
From the UV absorption spectra, the graph Aλ =f(pH) is plotted at two wavelengths, see Fig. 3(b), where four inflection points associated with the pKa values for tetracycline can be observed. The first inflection point can be observed around pH 3, likewise, a change in slope is seen at pH 7 and pH 9. Finally, at pH 12 a fourth inflection point is observed. When the acid-base reaction is in equilibrium, the concentrations of the species are equal, so the pKa values are approximately equal to the pH values of the inflection points.
The software SQUAD [10] was used to calculate the values of the acidity constants of tetracycline. As input data, the equilibrium models of the global constants, the pH values (1.995-12.601) and the total concentration for each tetracycline solution are proposed; likewise, 4200 absorbance data from experimental UV absorption spectra were used with a wavelength range of 234 to 433 nm. As output data, SQUAD provides the global formation constants (logβ), the molar absorptivity coefficients as well as the total standard deviation (σTot) and the statistical parameter U, see table 2.
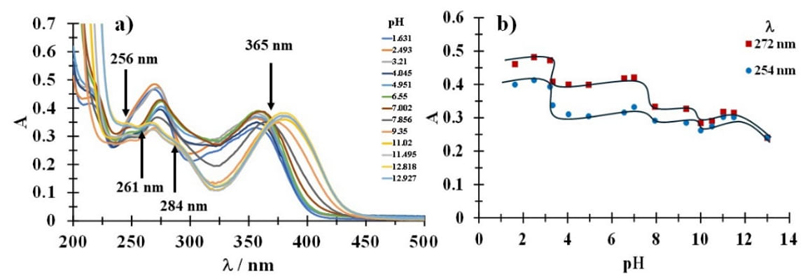
Fig. 3 (a) Family of UV-Vis spectra representative recorded for a tetracycline 0.05 mM aqueous solution at different pHs values, shown in the figure. Arrows shows isosbestic points (b) Variation of the absorbance, A, as a function of pH at different wavelength, shown in the figure.
Table 2 Values of global formation constants of 0.05 mM tetracycline in aqueous medium determined by SQUAD.
| Equilibrium global | logβ ± s |
|---|---|
|
|
31.752 ± 0.049 |
|
|
28.475 ± 0.045 |
|
|
21.078 ± 0.031 |
|
|
11.728 ± 0.024 |
|
|
|
T = 298.15 K, and ionic strength 0.1 M
Fig. 4(a) presents the values of the molar absorptivity coefficients with their error bars as a function of wavelength for the different Tc species and its possible to note the predominance for five Tc species. From the molar absorptivity coefficients obtained with the software it is possible to obtain the simulated absorption spectra by applying the Lambert-Beer law (equation 1).
where
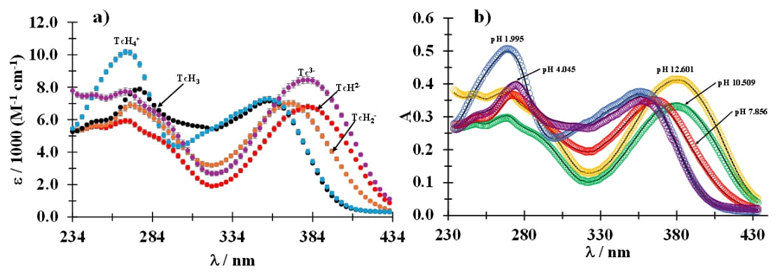
Fig. 4 (a) Molar absorptivity coefficients as a function of wavelength for the different species shown in the figure. (b) Fitting of the experimental absorption spectra (markers) recorded at different pH values shown in the figure, with the spectra simulated from the data provided by SQUAD.
From the data obtained, four acid-base equilibria are determined for Tc in an
aqueous solution with values of
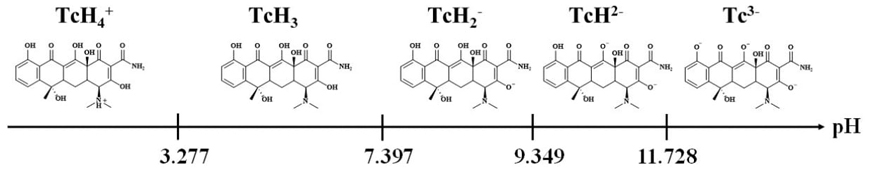
Various dissociation mechanisms of TcH4 + are reported in the literature, in a pH range of 3.46 to 7.39, the predominant species is in the zwitterionic form. [8], however, as can be seen in Scheme 1, the proton with acidic properties is the one found in the dimethylamino group of C-4, giving rise to the neutral species, TcH3. The next deprotonation of the TcH3 species occurs in the acidic hydroxyl group linked to C-3, giving rise to the mono-anionic TcH2 -species. The last ionizations are found in the hydroxyl groups linked to C-12 and C-10 consecutively, giving rise to the tetracycline species, TcH- and Tc3- respectively, see scheme 1.
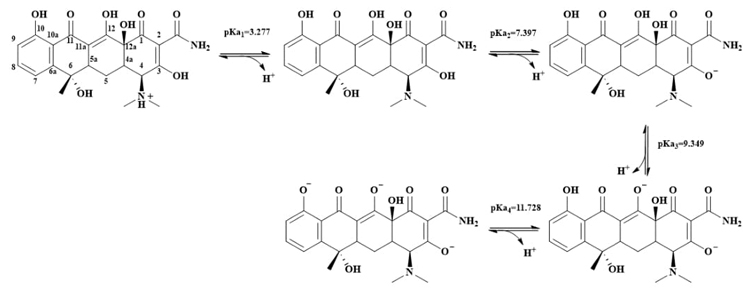
Table 3 Values of acidity constants determined in this work compared with those reported in the literature.
| pKa | UV (this work)* | [6]* | [8]* | [9]** |
|---|---|---|---|---|
| pKa1 | 3.277 ± 0.066 | 3.30 ± N.R. | 3.46 ± N.R. | 2.07 ± N.R. |
| pKa2 | 7.397 ± 0.055 | 7.40 ± N.R. | 7.39 ± N.R. | 6.84 ± N.R. |
| pKa3 | 9.349 ± 0.039 | 9.30 ± N.R. | 9.59 ± N.R. | 8.75 ± N.R. |
| pKa4 | 11.278 ± 0.024 | -------- | 12.1 ± N.R. | 10.27 ± N.R. |
| pKa5 | -------- | -------- | -------- | 14.45 ± N.R. |
*T = 298.15 K and ionic strength 0.1 M
** [9] Does not report temperature or ionic strength
N.R. : Not Reported
In order to corroborate the predominance and charge of the tetracycline species in acidity equilibria proposed in this work, capillary zone electrophoresis (CZE) was used. CZE allows the separation of charged analytes. The basis separation is related to the application of an electric field to a conductive solution, preferably buffer, contained within a capillary tube, so that the analytes are separated by differences in their mobility. In CZE separations a silica capillary is used, such that the electroosmotic flow has a significant influence due to the separation movement of the buffer through the silica capillary because of the existence of a zeta potential at the solvent/silica interface. The silica interface is negatively charged as a result of the deprotonation of silanol groups (for pH values around 4 to 5) and exerts an attraction on the cations of the buffer and the electrophoretic medium, forming a double layer of immobile cations and external, or diffuse, layer of mobile ions [14].
When the electric field is applied, the cations, which are mostly buffer counterions, migrate towards the cathode and, as they are solvated, they transport liquid from the core of the solution, in the same direction. This flow is transmitted across the entire diameter of the capillary and due to its presence, all ions migrate in the same direction provided that the velocity of the electroosmotic flow is greater in magnitude, but opposite in direction for all anions present in the solution. Neutral analytes will also be transported by this flow, so it is important to use a substance as a marker of the electroosmotic flow that is neutral throughout the pH range and that has an absorptivity coefficient large enough to measure its mobility without interfere with the analysis system. In this way, once the electroosmotic flow marker has been detected in the separation, it can be stated that if the analyte signal is observed before the marker, it is a cationic species; on the contrary, if the analyte signal is detected after the label, it is an anionic species. All analytes observed in the same signal as the label will be neutral [15]. CZE at pH 2, presents a very low electroosmotic flow, so the mobility of Tc will be due solely to the charge of the species as a consequence of the polarity imposed on the capillary from the anode to the cathode, so the signal can be associated with the species of TcH4 +. For pH values greater than 4, acetone is used as an electroosmotic flow marker, and it is possible to observe the effect of the charges of the different Tc species. Fig. 5(a) shows the electropherogram at pH 4.192; the Tc signal is shown in a solid line, the marker signal is shown in a dotted line, and it is possible to see that the Tc signal is located a few seconds before the marker signal. This is because a fraction of the TcH4 + species still exists, and coexisting with the TcH3 species. At pH 4.989 the predominant species is TcH3 (neutral), for this reason the Tc signal is observed coupled to the marker signal, see Fig. 5(b). Fig. 5(c) and 5(d) shown the electropherograms at pH 5.903 and pH 6.885 respectively; where there is a shift in the fraction of the neutral species towards the mono-ionic species given that the Tc signal is observed later times of the marker signal.
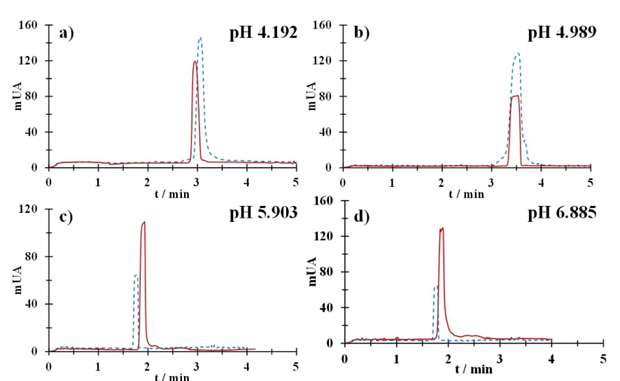
Fig. 5 Electropherograms recorded in a Tc 50 mM aqueous solution (solid line) and acetone (dotted line) at pH: (a) 4.192, (b) 4.989, (c) 5.903 and (d) 6.885.
Fig. 6 shows electropherograms at 50 mM Tc for pH values in the range 6.885 to 10.964. The predominant species, according the molar fraction diagram, are anionic type, this is corroborated since the Tc signal (solid line) appears later times than the marker signal (dotted line). Furthermore, a shift in time is shown for the Tc signal as the pH value increases, this is associated with the change from mono-anionic to di-anionic species.
From the electropherograms obtained for Tc and acetone, the migration times for the different species are obtained. With this information it is possible to calculate the effective electrophoretic mobility (u eff ), using equation 2.
where L T is the total capillary length, L eff is the effective length (length to the detector); V is the magnitude of the applied electric field and t m is the migration time of the analyte.
For pH 2.065 as well as 3.151, u=u eff , since there are not influence of the electroosmotic flow. However, for values greater than 4.191, the calculated mobilities from equation 3 are apparent electrophoretic mobilities (u app ) because the contribution of the electroosmotic flow, u eof , must be considered in order to calculate the u eff for each pH value.
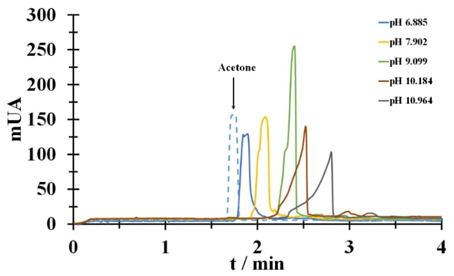
Fig. 6 Electropherograms recorded in a Tc 50 mM aqueous solution (solid line) at different pH values shown in the figure and acetone (dotted line).
Table 4 shows u eff calculated for each pH value. The value of mobility is expected to increase proportionally to the charge of the species, i.e., u eff corresponding to the di-anionic species is twice the u eff of the mono-anionic species. It can be seen that the u eff at pH 10.964 exceeds twice the value of the u eff for pH 7.902, which indicates that we are moving from the mono-anionic species to the di-anionic and tri-anionic species.
Table 4 Effective electrophoretic mobility (u eff ) at different pH values.
| pH | u eff / m2V-1s-1 | pH | u eff / m2V-1s-1 |
|---|---|---|---|
| 2.065 ± 0.001 | 1.14 x 10-08 | 6.885 ± 0.001 | -1.72 x 10⁻⁹ |
| 3.151 ± 0.001 | 1.08 x 10-08 | 7.902 ± 0.001 | -4.63 x 10⁻⁹ |
| 4.192 ± 0.001 | 3.92 x 10⁻¹⁰ | 9.099 ± 0.001 | -6.99 x 10⁻⁹ |
| 4.989 ± 0.001 | 3.94 x 10⁻¹⁰ | 10.184 ± 0.001 | -6.90 x 10⁻⁹ |
| 5.903 ± 0.001 | -1.22 x 10⁻⁹ | 10.964 ± 0.001 | -1.05 x 10⁻⁸ |
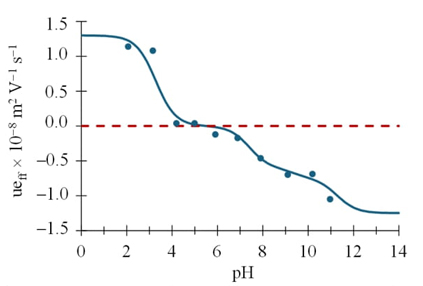
From the values of the effective electrophoretic mobility obtained for each Tc system, it is possible to obtain the graph u eff =f(pH), Fig. 7, and it is observed that mobilities greater than zero corresponds to the TcH4 + species while at mobilities close to zero it is associated with the neutral species and finally the values of u eff less than zero are associated with the anionic species of Tc, which is consistent with the proposed speciation of Tc in scheme 1. This behavior is since the effective electrophoretic mobility is a weighted average of the species present for each Tc value. Finally, Fig. 8 presents the linear predominance-zones diagram for the different tetracycline species as a function of pH [16, 17].
Conclusions
It was determined that the tetracycline molecule in aqueous medium presents
percentages of degradation at different pH values, demonstrating its instability in
a period of 16 minutes. The study based on two different experimental techniques
allows forming a comprehensive approach for the precise determination of the acidity
constants of tetracycline. By UV absorption spectroscopy technique and the SQUAD
computer program, four acidity constants of tetracycline in aqueous medium were
determined:

