


 nueva página del texto (beta)
 Inglés (pdf)
 Artículo en XML
 Referencias del artículo
 Enviar artículo por email
 Citado por SciELO
  Similares en
SciELO
Similares en
SciELO 
 Permalink
Introduction
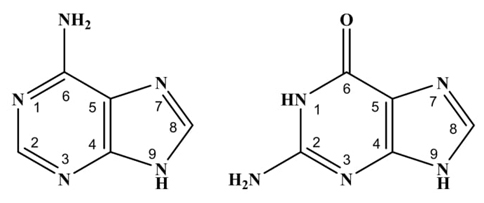
Recently, numerous studies have focused their attention on the chemical reactivity of the purine bases of DNA, Adenine (A) and Guanine (G); see Fig. 1 (left for A and right for G), because any change in their chemical structure could alter the replication process and interfere with specific protein-DNA sequencing, triggering serious illnesses to the immune system or even cancer [1-3]. For this reason, having solid and extensive knowledge of its chemical reactivity is of vital biological importance. Paradoxically, despite being molecules widely studied for the development of novel quantification methods [4-7], the physicochemical information about the value or values of the acidity constants is not entirely clear as well as their experimental evidence. For example, Verdolino and coworkers [8] has been previously published a pK a = 4.1 for adenine (A) using theoretical calculations from Density Functional Theory and they replied that such value is in very good agreement with the experimental value which comes from old general chemistry manual whose experimental evidence is unclear [9,10]. The same authors found two acidy constants for guanine (G): pK a1 = 3.2-3.3 and pK a2 = 9.2-9.6 [8,11-15]. On the other hand, Jang and coworkers [16] using theoretical calculations from Density Functional Theory combined with Poisson-Boltzmann as solvation model predict three acidity constants for G: pK a1 = 3.15, pK a2 = 9.44 and pK a3 = 12.61. Therefore, the objective of this work is to solve these inconsistences by providing experimental evidence of the acidity constants for A and G in aqueous medium. To achieve this goal an spectrophotometric acid-base titration at ionic strength 0.4 M and T = (25.0 ± 0.1) °C is carried out. Once the absorbance values are obtained as a function of the wavelength for each pH value, data refinement is subsequently carried out for a serial acid-base equilibrium models.
Experimental
In a thermostatic cell maintained at (25.0 ± 0.1)°C, an aqueous working solution of purine base was prepared where the diluent was a mixture of NaOH and NaCl, both at 0.2 M. The working solution was bubbled with nitrogen, N2(g), (99.99 %). The solutions were all set with deionized water (18.2 MΩ cm) free of organic matter obtained with a PURE-LAB Plus UV filter. The working solution was titrated with aqueous HClO4 solutions. The pH reading is carried out with a sensION potentiometer equipped with a Hach 5014 T Ag°|AgCl [KCl = 3 M] glass electrode. The working concentrations in molarity for adenine and guanine were [A] = 47.7 µM and [G] = 46.9 µM.
Spectrophotometry study
For each pH variation, the absorbance spectrum was recorded as a function of wavelength with a Lambda 20 spectrophotometer PERKIN ELMER equipped with a quartz cell of 1.0 cm path length. The working wavelength range was (224-319) nm for adenine and (223-318) nm for guanine. Each spectrum was recorded at 1960 nm min-1.
Results and discussion
Adenine
Fig. 2 shows for adenine a maximum absorbance at 268 nm in basic medium. This absorbance presents a hypochromic and hypsochromic effect as the pH value decreases, moving up to 260 nm at pH 6.3. Subsequently, as a pH still decaying, this band presents a bathochromic effect reaching 263 nm when pH values are close to zero. Likewise, two isosbestic points appears at 235 nm and 265 nm, giving indications that more than one acid-base equilibrium exists in the system. Setting the wavelength to 250 nm and 268 nm and plotting absorbance values as a function of pH we can visualize three important moments in the sigmoid. The first one is close to the value of pH 4 (I-A). The second one appears close to pH 8.8 (II-A). The third significant moment is slightly above pH 10 (III-A) (see red markers Fig. 3 left and right). This means that the acidity constants for adenine are close to these pH values.
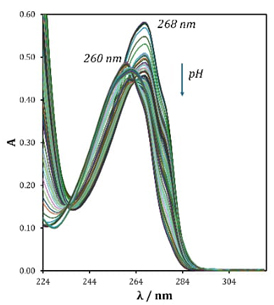
Fig. 2 UV-Vis spectra recorded in aqueous solution (I = 0.4 M) containing 47.7 µM adenine at different pH.
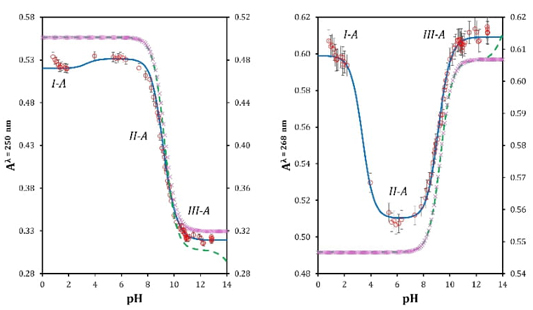
Fig. 3 Absorbance recorded at λ = 250 nm (left) and λ = 268 nm (right) as a function of pH for: one pK a chemical equilibrium model (purple markers), two pK a chemical equilibrium model (green discontinuous line) and three pK a chemical equilibrium model (blue continuous line). Red markers are experimental data.
Guanine
In Fig. 4 a maximum absorbance can be seen at 273 nm in basic medium for an aqueous solution of guanine. When the pH becomes more acidic, this absorption maximum decreases in absorbance value, thus evidencing a hypochromic effect, also showing a slight shift towards longer wavelengths (bathochromic effect) while a new absorbance maximum is generated at 248 nm. As pH becomes strongly acid this value shows a slightly hypochromic effect. With the information in Fig. 4 and setting the absorbance value at two different wavelengths (λ = 248 nm and λ = 273 nm) the graphical representations of Fig. 5 (left and right) in the Aλ / pH space are generated. According to Fig. 5, at least three important behaviors are visualized in the absorbance response. The first one would be at pH values close to 2 or 3 (I-G), the second zone is located at pH close to 7 (II-G), and the third zone is above pH 10 (III-G). These three zones can be associated with at least three pK a values.
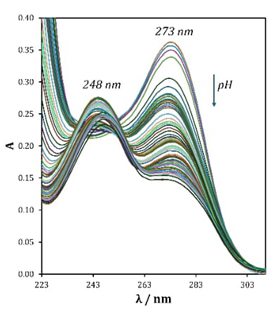
Fig. 4 UV-Vis spectra recorded in aqueous solution (I = 0.4 M) containing 46.9 µM guanine at different pH.
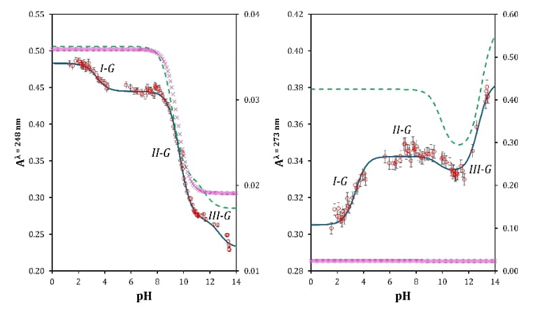
Fig. 5 Absorbance recorded at λ = 248 nm (left) and λ = 273 nm (right) as a function of pH for: one pK a chemical equilibrium model (purple markers), two pK a values chemical equilibrium model (green discontinuous line) and three pK a values chemical equilibrium model (blue continuous line). Red markers are experimental data.
Refinement of acidity constants with SQUAD software
The use of the SQUAD software for the refinement of acidity constants from spectrophotometric data has been reported [17-19]. The refinement of the equilibrium constants consists of minimizing through a non-linear regression the sum of squares, U, between the absorbance calculated by the software and the experimental absorbance for a given chemical equilibria model. If the adjustment is adequate, SQUAD finishes the calculation by returning the acidity constants already refined, with their standard deviation, s. In Fig. 3 and Fig. 5 can we appreciate a good agreement between the red markers (experimental values) and the blue continuous line which represents our chemical model for three pK a values for A and G. The green discontinuous line is for a model of two acidity constants meanwhile the purple markers are for a chemical model with a single pK a where pK a came from the values previously reported in literature [8,16]. For each chemical model (blue continuous line, green discontinuous line and purple markers) absorbance values have been built with the Beer- Lambert law where molar absorptivity coefficients (ε) were obtained by SQUAD using experimental data (Fig. 6 left for A and right for G) as well as the equilibrium model. For more details see [17]. The right y axis in Fig. 3 and Fig. 5 represents the absorbance values for the models with one and two pK a values. Table 1 shows in detail the number of data that were introduced to SQUAD, the chemical model that best fits the experimental absorbance as well as their (pK a ± s) values for A and G.
It can also be highlighted that the diacid (H2Aden, H2Guan) and monoacid (HAden-, HGuan-) forms of each nitrogenous base would be subject to acid-base ampholyte type behavior. According to Rojas and coworkers [20] would be stable ampholytes in aqueous solution as long as their logK dismutation < 0.
The experimental pK a values obtained in this work and those reported in previous literature are summarized in Table 2 for A and Table 3 for G. As can be seen, comparing previous studies our group was able to show new experimental evidence about purine bases chemistry in solution. The acid dissociation equilibria obtained in this work for adenine are: (I) H3Aden+ ⇄ H2Aden + H+, pK a1 = 3.361 ± 0.102; (II) H2Aden ⇄ HAden- + H+, pK a2 = 9.056 ± 0.091; HAden- ⇄ Aden2- + H+, pK a3 = 10.132 ± 0.057. In the case of guanine the equilibria are: (I) H3Guan+ ⇄ H2Guan + H+, pK a1 = 3.402 ± 0.028; (II) H2Guan ⇄ HGuan- + H+, pK a2 = 9.708 ± 0.022; HGuan- ⇄ Guan2- + H+, pK a3 = 12.721 ± 0.015. Our experimental values for G are in good agreement with those predicted by Jang and coworkers [16] where ∆pK a ≤ 0.3. In the case of A ∆pK a ≤ 0.8 showing significant differences between this work and Verdolino and coworkers [8], in fact, they did not report a pK a3. A possible explanation for this could be that Jang and coworkers [16] used a density functional theory combined with Poisson-Boltzmann as solvation model to predict thermodynamics parameters in aqueous solution more precisely.
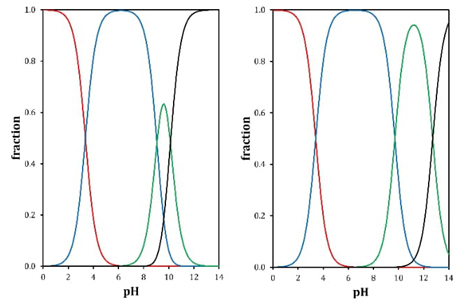
Having a reliable refinement of the experimental pK a values it is possible to construct the distribution diagram for A and G (Fig. 7) according to Rojas and coworkers [20] This tool is important because it allows to have knowledge of the different predominant forms of the chemical species of interest according to the working pH conditions in aqueous medium.
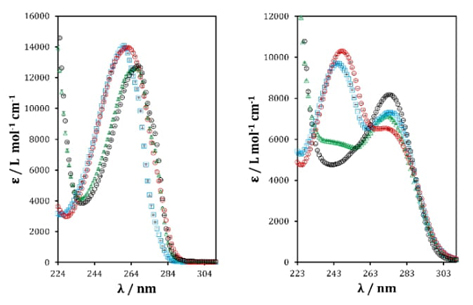
Fig. 6 Molar absorptivity coefficients (𝛆) for adenine (left) and guanine (right) in aqueous solution at I = 0.4 M. Red marker H3Aden+(left)/ H3Guan+(right), blue marker H2Aden(left)/H2Guan(right), green marker HAden-(left)/ HGuan-(right) and black marker Aden2-(left)/ Guan2-(right).
Table 1 Acidity constants values for A and G in aqueous solution (I = 0.4 M) refined by SQUAD.
| Puric base | Number of data | Wavelenght interval | Model | pK a ± s | sum of squares U |
|---|---|---|---|---|---|
| Adenine (A) | 71 spectra |
|
|
|
0.138 |
| Guanine (G) | 81 spectra |
|
|
|
0.047 |
Table 2 Acidity constants values reported for adenine.
| Method |
|
|
|
Ref. |
|---|---|---|---|---|
| Computational DFT | 4.1 ± N.R. | N.R. | N.R. | [8] |
| N.R. | 4.15 ± N.R. | 9.81 ± N.R. | N.R. | [10] |
| Spectrophotometric titration in aqueous medium at 0.4 M and T = (25.0 ± 0.1) °C | 3.361 ± 0.102 | 9.056 ± 0.091 | 10.132 ± 0.057 | This work |
N.R. Not reported
Table 3 Acidity constants values reported for guanine.
| Method |
|
|
|
Ref. |
|---|---|---|---|---|
| Computational DFT | (3.2-3.3) ± N.R. | (9.2-9.6) ± N.R. | N.R. | [8] |
| N.R. | 3.3 ± N.R. | 9.2 ± N.R. | 12.3 ± N.R. | [10] |
| Computational DFT | 3.2 ± N.R. | 9.4 ± N.R. | 12.6 ± N.R. | [16] |
| Spectrophotometric titration in aqueous medium at 0.4 M and T = (25.0 ± 0.1)°C | 3.402 ± 0.028 | 9.708 ± 0.022 | 12.721 ± 0.015 | This work |
N.R. Not reported
Conclusion
The experimental pK a values calculated in this work for A and G are in good agreement with those previously predicted by computational methods. Through a non-linear regression method (SQUAD) as a refinement analysis for spectrophotometric titration data we successfully obtained the molar absorptivity coefficients of four species that absorb in the system at 96 wavelengths (224- 319) nm for A and G in the whole range of pH which indicates that the best chemical model that fits is a three chemical equilibria model. Reliable knowledge of physicochemical parameters as acidity constants, pK a, will ensure not only more sophisticated experimental designs as well as characterization and quantification methods. It will also grant a more comprehensive knowledge about is chemical thermodynamics properties as well as the understanding of the biological processes where they are involved.

