


![DFT Calculation, ADME/T and Molecular Docking Approach of Methyl 2-oxo-1,2-dihydrofuro[3,4-d] pyrimidine-3(4H)carboxylate](/img/es/next.gif)


 nueva página del texto (beta)
 Inglés (pdf)
 Artículo en XML
 Referencias del artículo
 Enviar artículo por email
 Citado por SciELO
  Similares en
SciELO
Similares en
SciELO 
 Permalink
Introduction
Organic semiconductors (OS) bear different properties from conventional inorganic semiconductors due to their low cost and simplicity of fabrication [1]. Operating system applications include thin-film transistors (TF), light-emitting diodes (LEDs), solar cells (SCs) and photo-refractive devices [2-4]. Small-molecular-weight in solution-processed materials of particular technological relevance can be incorporated into a high-performance conductor where TF [5,6]. Organic photovoltaic (OPV) materials are appealing alternatives to their inorganic counterparts due to their cheap costs, ease of manufacturing, and compatibility with large-area and flexible substrates [5]. An organic solar cell (also known as a plastic solar cell) is a form of solar cell that produces electricity from sunlight by using conductive organic polymers or tiny molecules for light absorption and charge transfer [7,8]. Optical and electrical characteristics of the molecules employed in OPVs at an interface remain unknown in comparison to the bulk [9,10]. The charge carriers in an organic device must flow through the organic/ electrode interfaces. As a result, the electronic structures of molecules are crucial elements influencing the overall efficiency of OPVs. Wide-band gap semiconductors enable devices to function at significantly higher voltages, frequencies and temperatures than typical semiconductor materials such as silicon and gallium arsenide [11-13]. They are an essential component in the production of short-wavelength (green-UV) or lasers and they are also utilized in some radio frequency applications, most notably military radars [14]. Their inherent properties make them suitable for a wide range of different applications, and they are among the best candidates for next-generation semiconductor usage. The bigger band gap is especially essential since it allows devices to function at considerably higher temperatures of 300 °C [15]. This makes them very appealing for military purposes where they have seen some use [16]. Because of the great temperature tolerance, these devices can function at substantially higher power levels under typical settings. Furthermore, most wide-band gap semiconductors have a critical electrical field density that is 10 times higher than that of typical semiconductors [17]. These qualities, when integrated, allow them to function at significantly greater voltages and currents, making them extremely important in military, radio, and power conversion applications. Wide band gap semiconductor materials has lagged behind that of conventional semiconductors which have received considerable development since the 1970s [18,19]. However, their obvious key advantages in many implementations, in conjunction with some special characteristics not found in conventional semiconductors, have renewed interest in their use in everyday electronic devices rather than silicon. Analytical chemistry and thermosetting polymers both make extensive use of sulfathiazole derivatives. Sulfonamide-based compounds exhibit antibacterial, carbonic anhydrase inhibitor, antitubercular, proper semiconductor material, antiviral, insulin release inducer and anti-inflammatory properties [20-22]. In this study, a new material with specified properties has been produced. By using UV spectrum, many optical properties have been found. The properties of this new material have been studied by using Gaussian09 program. Then, experimental of ethanol was compared with experimental of acetone.
Materials and methods
Synthesis
Fig. 1 shows synthetic reaction of 4-((2-hydroxy benzylidene) amino)-N-(thiazol-2-yl) benzenesulfonamide. In a 250 mL flask, boiling ethanol was used to dissolve 2-hydroxy benzaldehyde (10 mmol) which was then followed by the addition of 4-amino-N-(thiazol-2-yl) benzenesulfonamide (10 mmol) and catalytic amounts of glacial acetic acid (0.3 mL). The reaction mixture was refluxed until completion. Furthermore, the reaction progress was monitored by using TLC (Ethyl acetate: diethyl ether (1:1) ratio), and the solvent was removed from the resultant mixture using rotary evaporation and then purified using flash chromatography with an eluent ratio of DCM/MeOH 30:2 [1]
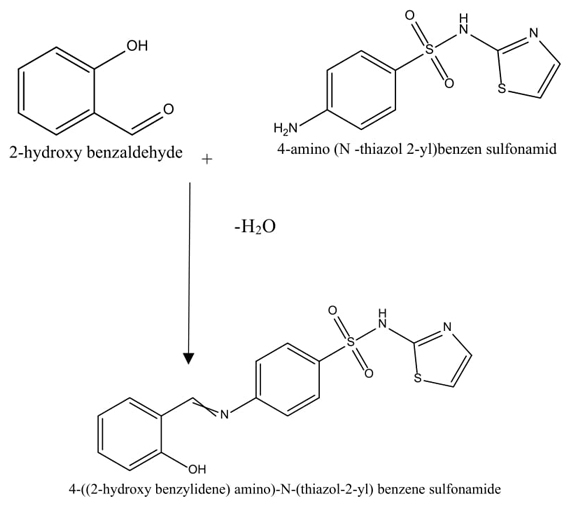
Table 1 13C NMR, 1H NMR and FTIR peaks of 4-((2-hydroxy benzylidene) amino)-N-(thiazol-2-yl) benzenesulfonamide.
Optical and electronic studies of the solutions of the zinc phthalocyanine
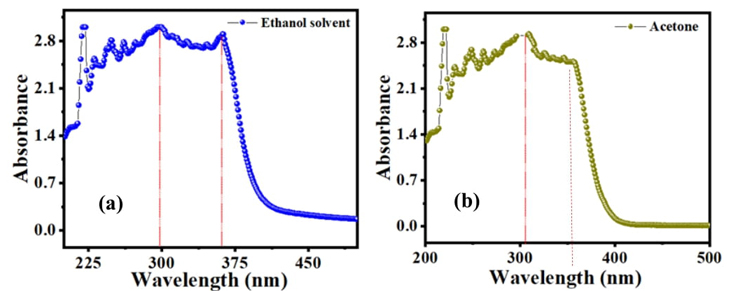
UV-visible spectroscopy is a very significant and most beneficial optical method for studying optical and electronic characteristics of nanomaterials such as polymers, organic semiconductors and organic light-emitting material [23]. The UV-visible spectra indicates the basic electronic features of the sample. The UV-visible spectrum of the C16H13N3O3S2 compound was achieved in ethanol and acetone as shown in Fig. 2. By considering the UV-visible application, two absorption bands associated with ethanol solvent at 297 and 362.1 nm. The maximum absorption for acetone solvent is 306 nm. The wavelength of UV-visible result located at the visible region which can determine optical band gap energy from the following equation.
Equation 1 refers to energy between HOMO and LUMO which is the energy required to evolve a valence electron to become a conduction electron. The band gap energy in any structure is the main factor in determining electrical conductivity. Materials with a small band gap indicate conductivity due to HOMO and LUMO overlap, but a large band gap leads to insulation [24].
Semiconductors are materials with a nonzero band gap that are intermediate in size and behave as an insulator at 0 K, but permit thermal excitation of electrons into their conduction band below their melting point. The properties of this new material were calculated at low temperatures 295 oK where the band gap is relatively large, but all semiconductors become good conductors with increasing temperature. Furthermore, at room temperature, most semiconductors behave as non-conductors. Band gap was found for each of the highest absorptions which are 4.17 and 3.42 eV in the solvent of ethanol at 297 and 362 nm. On the other hand, acetone solvent is equal to 4.05 and 3.44 eV at 303 and 360 nm.
The transmittance is a useful parameter and has a relation with the refractive index of the materials, the significance of transmittance estimation techniques gives comprehensive information on the refractive index of the sample [25]. Several molecule characteristics have a strong relationship with the transmittance of light through the compounds such as concentration, refractive index of the host medium, color of particle, shape, impurities, the thickness of the sample and wavelength of light while striking on the molecule [26].
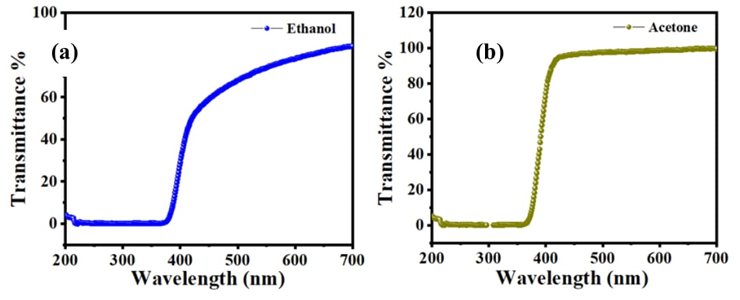
The shift comparative with 200 nm indicates the presence of impurity. For C16H13N3O3S2 compound, the vertical shift depends on the concentration in the highest wavelength constant near 800 nm. The transmittance and the concentration have a strong opposite relation, the value of the light transmittance through the compound decreases with an increase in the concentration of the compound, because of the scattering of light of the C16H13N3O3S2. The highest value of transmittance was achieved at 700 nm which is associated with the refractive index of 0.1162 as shown in Fig. 3(a) and (b).
Another significant parameter for optoelectronic applications is extinction coefficient. The extinction coefficient and band gap energy of C16H13N3O3S2 dissolved in ethanol and acetone are shown in Fig. 4(a) and (b). The extinction coefficient of the new compound varies with photon energy. Semiconductor materials have crucial properties for the absorption of light and light absorption can be shown in the duration of the absorption coefficient (α) on photon energy (hυ). The forbidden bandwidth of optical transitions or optical band gap for semiconductors was determined using the following relationship [27].
The value of m is not constant and it varies parameters related to the measuring variety of band gaps, the value of m is equal to 2 for allowing indirect transitions, m is equal to 3 for forbidden indirect transitions, the value of m is equal to 1/2 for allowing direct translations, and m is 3/2 for forbidden direct transitions [28]. For zinc phthalocyanine semiconductor, the proper value of m determined to be 2, that is, for electrical dipole-allowed indirect band gap transitions [29].
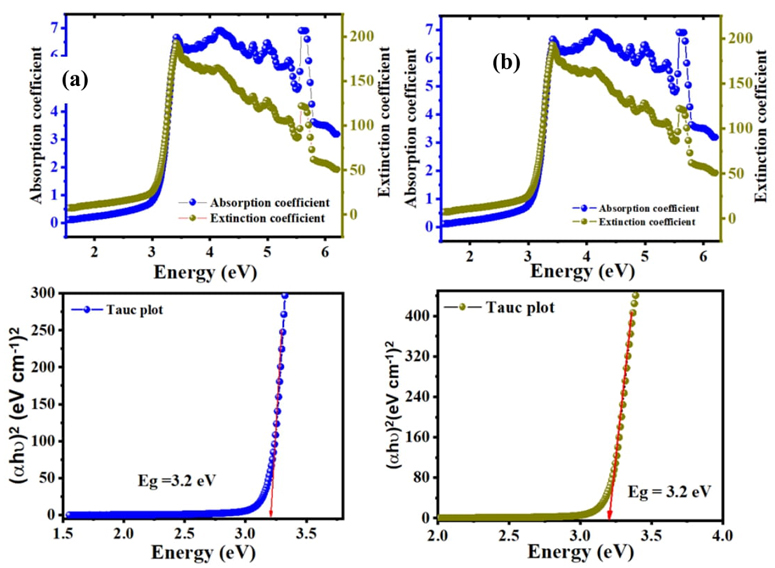
Fig. 4 Extinction coefficient, absorption coefficient and Tauc plot variation of C16H13N3O3S2 in (a, c) ethanol and (b, d) acetone solvents
The allowed indirect band gap of C16H13N3O3S2 molecule in ethanol and acetone solvents achieved associated with the Tau-plot method as shown in Fig. 4(c) and d, Eg value is equal to 3.2 eV. Achieved outcomes in our production imply that the optical band gap of the C16H13N3O3S2 is to be a good semiconductor due to suitable Eg which can be used in optoelectronic devices.
An important parameter for optoelectronic applications and technologies is refractive index. The relation between the refractive index and the band gap energy is opposite. The refractive index of the materials increases with band gap energy. The following relationship can achieve the n value of zinc phthalocyanine [30,31].
The optical and electronic characteristic of semiconductor material principles is based on two important parameters which are band gap energy and refractive index, decided by these two fundamental properties. Semiconductors' transparency to incident photons can be measured using refractive index, whereas a semiconductor's threshold of photon absorption determines its band gap energy. Fig. 5 shows refractive variations with band gap energy at 22 K.
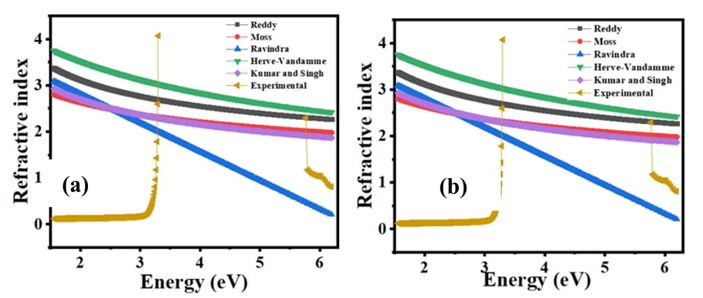
There are many relationships between Eg value of semiconductor material and refractive index, including Moss, Ravindra, Herve-Vandamme, Reddy and Kumar and Singh [32]. The refractive index values of the C16H13N3O3S2 semiconductor in the proper optical band gap for ethanol and acetone solution were determined from equation 4 and the received n values are presented in Table 2.
Herve-Vandamme relation gives the highest refractive index values for C16H13N3O3S2, while Ravindra relation gives the lowest refractive index values as shown in Table 2. A higher correlation is achieved through the Herve-Vandamme relation than any other.
Reflectivity
The following relationships can be used to calculate the fractional amplitude of the reflected electromagnetic field by examining the relationship between reflectance (R) and reflection coefficient (r) [33,34].
Reflectance is an important parameter for materials because a material with high reflectivity is a sign of a good conductor, but a low refractive index and reflectivity suggest that the material has low conductivity. We can achieve the same purpose by relying on other laws, for example Hagen-Rubens law [35].
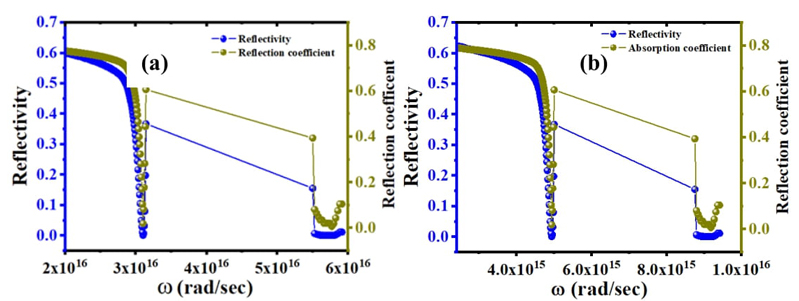
Fig. 6 Reflectivity and reflection coefficient variation with an angular frequency of C16H13N3O3S2. (a) ethanol solvent, (b) acetone solvent
Optical characteristics of these novel compounds display metal-like behavior at lower frequencies, but at higher frequencies, there is insulation-like activity. Plasma frequency is the frequency at which the real portion of the dielectric function disappears, as well as at which the material transitions from metallic to dielectric behavior. Plasma frequency changed due to the effect of solvents as shown in Fig. 6(a) and (b) which is higher in ethanol than acetone.
Electrical and optical conductivity
Optical conductivity and electrical conductivity are important properties of materials which are calculated by the following equations [36,37].
In general, optical conduction as electronic conduction is a matter of placing electrons in the conduction band. Another way to achieve this purpose is to provide an electron bound to the atoms with enough energy to break the bond and freed it to move. This can be achieved simply by illuminating the material with light, as the photons have energy that allows bonds to be broken. According to the solid-state field, photons can boost electrons from the valence to the conduction band, leaving a gap in the valence band. The free hole and the electron can then contribute to the electrical conductivity of the material. An important purpose of manufacturing electronic gadgets on the molecular level is the ability to measure and control the electric current through a single molecule. Additional applications concentrate on the insight given by these practices in the field of charge transport which is a recurrent phenomenon in various biological and chemical processes [38].
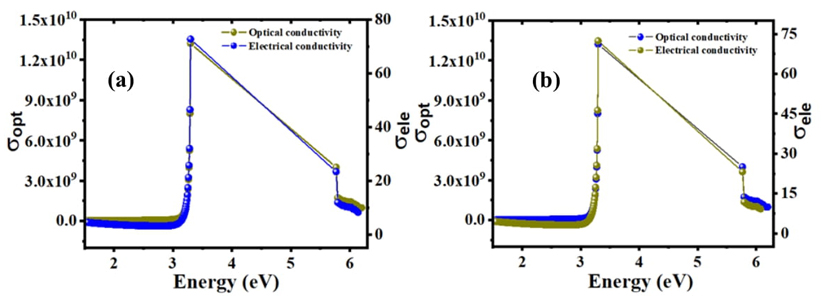
Fig. 7 Optical and electrical variation with energy of C16H13N3O3S2 at 22 K in (a) ethanol and (b) acetone solvents.
Fig. 7(a) and (b) show electrical and optical conductivity for each solvent but they do not affect optical properties. When the band gap is zero, the electrical and optical conductivity are both zero, but after 3.2 eV they both increase to their highest levels. This material has good conductivity compared to other materials. Electrical conductivity may be readily described using the Drude model [39]. Using solid band theory, the valence and conduction bands overlap, resulting in more free electrons in the conduction band. Conduction electrons are responsible for conduction, although the material has resistance due to scattering process. Optical conductivity measures the electrical conductivity in an oscillating field. As a result, the dielectric constant comes into play which governs the propagation of light into matter. The terms plasma frequency and relaxation time are used in this context. These two main physical parameters govern optical propagation. If radiation strikes matter, it pushes the electron, and if there is no scattering, light is totally reflected, which is why metals are bright. Above plasma frequency, reflection decreases, and transmission takes over which can easily distinguish between electrical and optical conductivity. This component also influences the color of the metals.
Dielectric properties
The dielectric properties of the material are related to the electro-optical properties which are significant for optical materials. Dielectric constants are the key to explaining the polarization and permittivity of the material which is related to the forbidden energy gap and state density of materials. The real part of the dielectric constant provides information about the speed of light that can be slow into the material. Another part of the dielectric constant is the imaginary part which shows the absorption of energy by an electric field due to dipole motion [40].
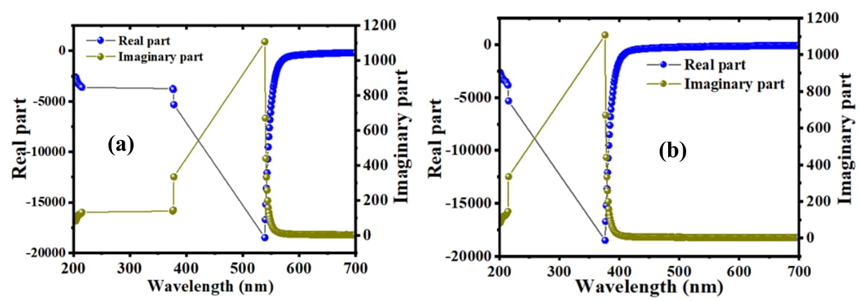
The difference in the imaginary and real part of the dielectric constant have an opposite trend. The minimum value of the real part is 300 nm which shows the lowest absorption. The maximum value of the real part of C16H13N3O3S2 in ethanol solvent is 540 nm and in acetone solvent is 380 nm which shows the highest absorption as shown in Fig. 8(a) and (b).
According to Koop’s theory which is based on the Maxwell-Wagner model during the lower frequency range can be explained as the highest value of the dielectric constant [41]. The highest dielectric constant can be determined at low frequency, the main contribution to the dielectric constant comes from the grain boundaries, but the smallest dielectric constant depends on the high frequency and the grains with a small dielectric constant dominate. The relaxation processes are related to the dielectric property because the real dielectric constant of the compound decreases with increasing frequency which may be associated with electrostatic relaxation processes. In the low-frequency region, the imaginary dielectric part and frequency have a relationship. The dielectric loss also decreases with frequency. The permittivity of the imaginary part becomes less sensitive at high frequency, the high resistivity indicates the low frequency due to the dominant effect of the grain boundaries, to jumping between the energy levels more energy required. In the high region of the frequency, the energy required to transfer electrons between the levels is low, hence the energy loss is small.
Electronic structure of C16H13N3O3S2
The molecular structures of the C16H13N3O3S2 compound were optimized utilizing the quantum mechanical approach in the ethanol and acetone solvents at the B3LYP/6-311++G (d, p). The global chemical reactivity characteristics (Table 3) such as ionization potential (I), electron affinity (A), the lowest unoccupied molecular orbital (ELUMO), the highest occupied molecular orbital (EHOMO) and energy gap are all included (Eg). electronegativity (χ), chemical potential (μ), molecular hardness (η), molecular softness (s), nucleophilicity and electrophilicity index (ω) are all terms used to describe the properties of molecules.
Table 3 Quantum chemical parameters based on DFT calculations at 6-311++G(d, p) basis set in different solvents.
| Quantum chemical parameters | Acetone solvent | Ethanol solvent |
|---|---|---|
| HOMO | -6.342 | -6.341 |
| LUMO | -2.904 | -2.886 |
| HOMO-1 | -6.689 | -6.691 |
| LUMO+1 | -2.084 | -2.085 |
| Total energy | -1803.285 | -1803.286 |
| Dipole moment (Debye) | 14.675 | 14.5429 |
| Ionization energy (eV) | 6.342 | 6.341 |
| Electron affinity (eV) | 2.904 | 2.886 |
| Band-gap energy (eV) | 3.438 | 3.454 |
| Hardness (eV) | 1.719 | 1.727 |
| Softness (eV) | 0.581 | 0.578 |
| Electronegativity (eV) | 4.623 | 4.613 |
| Chemical potential (eV) | -4.623 | -4.613 |
| Electrophilicity (eV) | 6.218 | 6.162 |
| Nucleophilicity (eV)-1 | 0.160 | 0.162 |
| ΔE Back-donation (eV) | -0.429 | -0.431 |
| Transfer electrons | 0.691 | 0.690 |
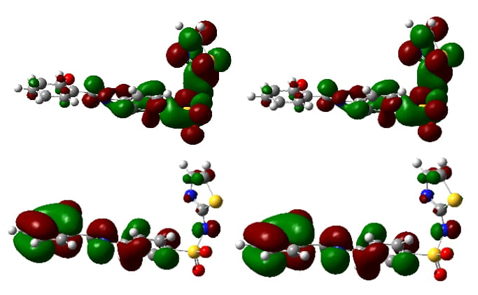
Density functional theory using the basis set (B3LYP/6-31++G(d, p)) is used to calculate the frontier energy gap, EHOMO and ELUMO energy of this molecule in the ethanol and acetone solvents. Optical and electrical characteristics of this new molecule are highly related to the HOMO-LUMO gap [42,43]. The ability to supply electrons is represented by the energy of the HOMO, while the ability to accept electrons is represented by the energy of the LUMO [44]. The energy difference between HOMO and LUMO orbitals defines molecule chemical stability, optical polarizability and chemical reactivity [45]. It is easier to move an electron from the HOMO orbital to an excited state (LUMO) when the energy gap between HOMO and LUMO is narrower (soft) [46]. Fig. 9 shows HOMO and LUMO based on DFT calculation.
In quantum chemical processes, electronegativity and electronic chemical potential are key properties. A high electronegativity indicates that the atoms or molecules have a greater ability to attract electrons, while a high chemical potential indicates a greater reactivity and less stability. Table 3 can be shown that this molecule has a higher electronegativity in acetone than other solvents. C16H13N3O3S2 has the highest chemical potential in the ethanol solvent.
The magnitude of the electrophilicity index is utilized as a chemical structural descriptor for examining the chemical reactivity of compounds. A more reactive nucleophile has a lower value of (ω) than a strong electrophile with a high value of (ω). C16H13N3O3S2 in ethanol solvent is a more reactive nucleophile. As shown in Table 3, this molecule is an excellent electrophile when compared to ethanol solvent.
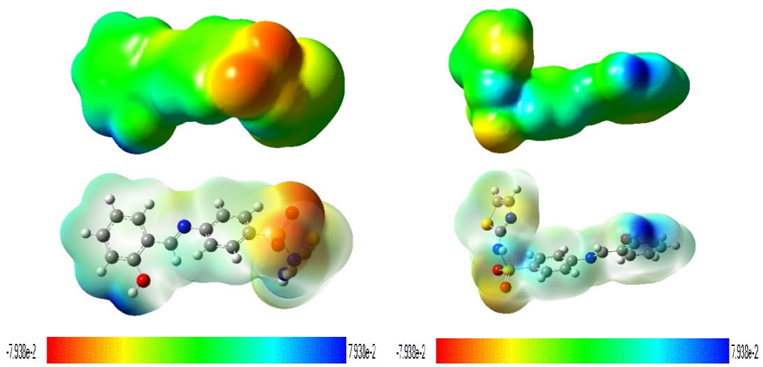
The electrostatic potential map reveals information about the atomic charges which may indicate the advantages of the electrostatic potential map (EPM) [25]. The former is used to define polarity and non-polarity in the structures of the molecule. The second advantage is that it can be used to compare the charge of one molecule to another for determining the result of a chemical process. The third component examines the electron cloud form of the atom and determines an irregularity that may be used to determine which regions have the highest electron density and which locations have the lowest electron density or depletion. Red as negative extreme and blue as positive extreme. The red colour with negative indicates the minimum electrostatic potential (that means it is bound loosely or excess electrons) and act as electrophilic attack. The interaction of molecules is similar to why molecules aggregate and how polymer complexes are formed. These reactions are similar to chemical reactions. The electric potential map holds a three- dimensional molecular outline and is useful for describing the charge distribution on the molecule surface and examining the molecular properties. They allow the researcher to visualize the shape and size of the molecule. The electric potential is very effective in predicting the behavior of complex molecules. The default color scale progresses from red to deeper blue electron density is higher in the region, indicating that electrostatic potential has dropped to its lowest point in the region. The oxygen atoms have a higher electron density in both solvents as shown in Fig. 10.
Conclusions
The main objective of this study was to synthesize an organic material. The structure of the material is established using a variety of identification technologies such as 13C NMR, 1H NMR, and FTIR. Several basic properties were studied to establish optoelectronic properties. Band gap energy is the most important attribute important for researchers. This material has a large vacuum which is around 4 eV in ethanol and acetone solvents. The optical band gap was determined by Tauck plot method which is 3.2 eV. Although these traits were found at 22 K which can be controlled by increasing the temperature. This new semiconductor material has a good ability to conduct electricity based on its ability to reflect a lot of light. While, electrical and optical conductivity of this material were calculated, the highest dielectric constant was found in the 540- 380 nm range, indicating its polarization ability.

