


 nueva página del texto (beta)
 Inglés (pdf)
 Artículo en XML
 Referencias del artículo
 Enviar artículo por email
 Citado por SciELO
  Similares en
SciELO
Similares en
SciELO 
 Permalink
Introduction
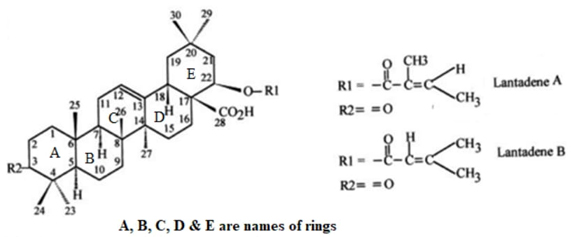
Natural products have long captivated researchers for various reasons, including their potential as antibiotics and pharmacologically active agents. They offer immense promise for exploring the cellular processes they can inhibit. Fundamental and conformational studies help formulate hypotheses about their interactions with target ligands, while synthesis allows us to test these hypotheses by eventually creating derivatives [1,2]. Among these natural products, Lantana camara, a flowering decorative plant, has been used in traditional medicinal preparations to treat a range of ailments. It serves as a rich source of diverse classes of bioactive natural metabolites. Throughout history, its flowers, leaves, and fruits have been applied externally to treat wounds, cuts, and skin diseases. Additionally, the stems, leaves, and roots of Lantana camara were employed for gargles and to alleviate toothaches in ancient times [3-5]. Interestingly, toxin research from Lantana leaves has revealed two molecular forms, of which only one has been found to be hepatotoxic to guinea pigs [6]. Various pharmaceutical properties of the Lantana plant have been documented in the literature [7,8]. Extracts isolated from Lantana leaves have demonstrated antitumor activity [9], antithrombin activity [10], as well as anti-inflammatory, anti-nociceptive, and antipyretic effects [11]. In a study at the Central Drug Research Institute, the stem of Lantana camara exhibited anti-filarial activity [12]. Literature reports also indicate the presence of significant bioactive compounds in L. camara, such as lantadene A, lantadene B, lantadene C, and lantadene D, which have been isolated from its aerial parts [13-15]. Lantadenes, derived from this plant, have shown a wide range of pharmacological activities, including antitumor properties [16-17]. These compounds differ in the structure of the side chain attached at the C-22 position, suggesting that these structural variations play a crucial role in their pharmacological activities [18-21]. Notably, Lantadene A and Lantadene B are the primary triterpene components of the red variety of Lantana Camara.
In the realm of computational chemistry, Density Functional Theory (DFT) has emerged as the preferred electronic structure theory for both molecular and extended systems. Concurrently, docking methodology has become a standard computational tool in drug design, aiding in predicting the binding modes and affinities of small molecules within specific receptor targets. This approach is instrumental in lead compound optimization and virtual screening studies to discover novel biologically active molecules.
Given the significance of these theories [22-26], we have undertaken a comprehensive investigation involving Comparative Molecular Docking, Experimental FT-IR Spectra, UV-Vis Spectra, Vibrational Analysis, Electronic Properties, and Fukui Function Analysis of Lantadene A and B compounds with medicinal potential.
Experimental details and computational methods
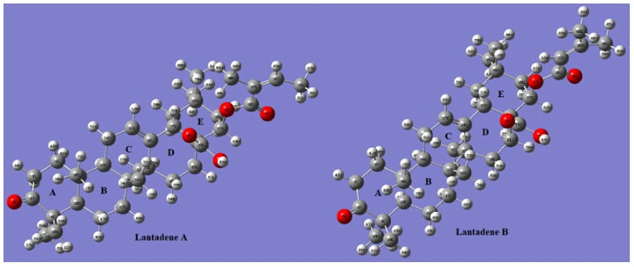
The FTIR spectrum of the investigated compound has been recorded in Perkin-Elmer spectrometer in the range of 4000-500cm−1. The frequencies of all sharp bands are accurate to ±1 cm−1. The molecular structures of the title compounds A and B are made by molecular modeling. The model molecular structures of the compounds are given in Figures 1 and 2. Initial geometry was generated from the standard geometrical parameters and was minimized without any constraint in the potential energy surface. The gradient corrected Density Functional Theory (DFT) with the three-parameter hybrid functional (B3) [27] for the exchange part and the Lee-Yang-Parr (LYP) correlation function [28] has been employed for the computation of molecular structure, vibrational frequencies, HOMO-LUMO, and energies of the optimized structures, using GAUSSIAN 09 [29]. The calculated vibrational frequencies have also been scaled by a factor of 0.963 [30]. By combining the results of the GAUSSVIEW’S program [31] with symmetry considerations, vibrational frequency assignments were made with a high degree of accuracy. The prediction of IR frequencies of title compound has been found to be very straightforward using this approach. To determine the form of the modes we used the potential energy distribution (PED) calculations and applied the VEDA program performing both the PED analysis and its optimization [32]. Density functional theory calculations are reported to provide excellent vibrational frequencies of organic compound if the calculated frequencies are scaled to compensate for the approximate treatment of electron correlation, for basis set deficiencies and for anharmonicity. A number of studies have been carried out regarding calculations of vibrational spectra by using B3LYP methods with 6-311 G (d, p) basis set. The scaling factor (0.963) was applied successfully for B3LYP method and was found to be easily transferable in a number of molecules. Thus, vibrational frequencies calculated by using the B3LYP functional with 6-311G (d, p) as basis set, can be utilized to eliminate the uncertainties in the fundamental assignment in the IR spectra. The docking action of Lant A and Lant B with selected protein has been performed by Auto Dock 4.2 software. The molecular docking indicates binding action of drug with appropriate protein.
Results and discussion
The accuracy of Density Functional Theory (DFT) results, particularly when using the B3LYP functional and the 6-311 G (d, p) basis set, depends on several factors, including the specific system or molecule under investigation, the level of theory used, and the properties of interest. B3LYP is a widely used hybrid functional that combines the Becke88 exchange functional with the Lee-Yang-Parr (LYP) correlation functional. The 6-311G (d, p) basis set is a commonly used basis set that includes polarization functions (d functions) on non-hydrogen atoms and diffuse functions (p functions) on hydrogen atoms. It is a good general-purpose basis set. Accurate geometry optimization is crucial for obtaining reliable results. Ensure that the optimization converges to a true minimum on the potential energy surface. Use tight convergence criteria and consider potential energy surface scans to explore different conformations.
Geometry optimization
The geometry optimization of Lant A and B is obtained by B3LYP/6-311 G (d, p) method. The energy of optimized Lant A and B at ground state is -1740.6908 a.u. and -1741.474 a.u. respectively. The optimized geometries of Lant A and B in plane drawing and 2 D dimensions are presented in Figures 1 and 2 respectively. The A/B and B/C rings are in trans conformation while the D/E rings are cis fused. The packing of the molecule is stabilized by O--H.--O hydrogen bonds. Bond lengths and angles (supplementary Table 1) agree with the values observed in similar compounds as maytenfolic acid.
Table 1 Calculated electronic transitions: E (eV), oscillatory strength (f), λmax(nm) using TD-DFT/B3LYP/6-311G(d,p) method.
| S. No. | Electronic Transition | E (eV) | Osci.Str. (f) | Cal. (λmax) | % Contribution | Assignment |
|---|---|---|---|---|---|---|
| Lantadene A | ||||||
| 1 | HOMO-1→ LUMO+1 HOMO→LUMO+1 | 4.26 | 0.0003 | 291 | 95 2 | np→Ry* |
| 2 | HOMO→LUMO HOMO -4→LUMO | 4.71 | 0.0002 | 263 | 93 5 | np→Ry* |
| 3 | HOMO -4→LUMO HOMO 3→LUMO HOMO→LUMO | 4.81 | 0.0005 | 258 | 80 12 5 | np→Ry* |
| Lantadene B | ||||||
| 1 | HOMO-1→LUMO+1 | 4.26 | 0.0003 | 291 | 95 | np→Ry* |
| 2 | HOMO→LUMO | 4.59 | 0.0002 | 270 | 98 | np→Ry* |
| 3 | HOMO-4→LUMO HOMO-3→LUMO | 4.79 | 0.0003 | 259 | 92 4 | np→Ry* |
PES scan of lant A and lant B
We conducted a Potential Energy Surface (PES) scan to explore the dihedral angles C22-C33-O3-H92 and C22-C33-O3-H87, with values of 177.710 and 177.770, respectively, in both Lantadene A and Lantadene B. This scan involved a total of 36 steps, with 10 steps for each angle in both compounds. We employed the HF/6-31G level of theory for these initial scans. The resulting data was used to generate Relative Energy vs. Scan Coordinate plots for Lantadene A and Lantadene B, as shown in Supplementary Fig. S1 and S2. The minimum energy configurations were identified at dihedral angles C22-C33-O3-H92=177.71 and C22-C33-O3-H87=177.77 for both Lantadene A and Lantadene B, after performing the PES scan.
To refine our understanding of these minima, we subjected the initial geometries corresponding to these energy minima in Lantadene A and Lantadene B to further optimization. For this optimization, we utilized a combination of the DFT/B3LYP method and the 6-311G (d,p) basis set, which is known for its accuracy in describing molecular structures and properties.
In summary, our study involved a thorough investigation of the potential energy surfaces of Lantadene A and Lantadene B, focusing on specific dihedral angles of interest. The resulting data and optimized geometries will contribute to a better understanding of the structural properties and behaviors of these compounds.
Vibrational analysis
Assignments of the FTIR (supplementary Fig. 3) frequencies are achieved by comparing the band positions and intensities observed in the FTIR spectra with wave numbers and intensities from molecular modeling calculations. The molecules Lantadene A and B both have 92 atoms with 270 normal modes of vibration. The calculated vibrational frequencies and the experimental values are listed in supplementary tables 2 and 3. Here we have discussed only FTIR active modes. The experimental frequencies of Lantadene A and B and frequencies calculated by B3LYP/6-311 G (d, p) method are nearly the same. Some Important modes of vibration are discussed below.
Table 2 Calculated εHOMO, εLUMO, energy band gap (εLUMO − εHOMO), chemical potential (µ), electronegativity (χ), global hardness (η), global softness (S), and global electrophilicity index (ω) for compound A, B at B3LYP/6-311 G (d, p) level.
| Folder | ε H | ε L | ε H - ε L | χ | μ | η | S | ω | ΔN max |
|---|---|---|---|---|---|---|---|---|---|
| A | -0.2253 | -0.0148 | -0.2105 | 3.266 | -3.266 | 2.863 | 0.1754 | 1.871 | 1.141 |
| B | -0.2312 | -0.0470 | -0.1842 | 3.785 | -3.785 | 2.506 | 0.1999 | 2.863 | 1.142 |
Table 3 Topological parameters for bonds of interacting atoms: LANTADENE-A and B electron density (ρ BCP), Laplacian of electron density (∇2 ρ BCP), total electron energy density (H BCP), estimated interaction energy (Eint) at bond critical point (BCP).
| LANT A | |||||||||
|---|---|---|---|---|---|---|---|---|---|
| Bond | ρ BCP | ∇2 ρ BCP |
|
VBCP | GBCP |
|
HBCP | E int(kcal/mol) | Nature |
| H88-O4 | 0.00347 | 0.01170 | 0.11970 | -0.00195 | 0.00243 | 0.80247 | 0.00048 | 0.61210 | VW |
| H73-O4 | 0.00456 | 0.01481 | 0.14080 | -0.00264 | 0.00317 | 0.83281 | 0.00053 | 0.82800 | VW |
| H55-H75 | 0.01450 | 0.05280 | 0.32110 | -0.00859 | 0.01088 | 0.78952 | 0.00229 | 2.69500 | W |
| O1-H79 | 0.01138 | 0.03972 | 0.13120 | -0.00746 | 0.00869 | 0.85846 | 0.00123 | 2.34100 | W |
| H71-H74 | 0.01288 | 0.04076 | 0.11940 | -0.00677 | 0.00481 | 1.40748 | -0.00196 | 2.12400 | W |
| H77-H50 | 0.01374 | 0.04730 | 0.13020 | -0.00784 | 0.00984 | 0.79675 | -0.0020 | 2.46000 | W |
| LANT B | |||||||||
| Bond | ρ BCP | ∇2 ρ BCP |
|
VBCP | GBCP |
|
HBCP | E int (kcal/mol) | Nature |
| H72-O4 | 0.00450 | 0.01470 | 0.13030 | -0.00259 | 0.00310 | 0.83548 | 0.00051 | 0.8130 | VW |
| H86-O5 | 0.01730 | 0.06050 | 0.12950 | -0.01140 | 0.01314 | 0.86758 | 0.00174 | 3.5770 | W |
| H78-O1 | 0.01190 | 0.04160 | 0.11820 | -0.00782 | 0.00910 | 0.85934 | 0.00128 | 2.4530 | W |
| H51-H71 | 0.01290 | 0.04410 | 0.12070 | -0.00718 | 0.00911 | 0.78815 | 0.00193 | 2.2530 | W |
| H54-H74 | 0.01420 | 0.05280 | 0.14080 | -0.00859 | 0.00109 | 7.8807 | -0.00750 | 2.6950 | W |
| H75-H59 | 0.01270 | 0.03840 | 0.13210 | -0.00659 | 0.00809 | 0.81459 | 0.00150 | 2.0680 | W |
O-H and -CH modes of vibration
The Lantadne A and B both have hydroxyl group (-OH). In general, -OH stretching modes of vibration are observed in the range 3400-3600 cm-1 [33]. The -OH modes of vibration appears at higher frequency region due to lower reduced mass. A significant polarized IR peak with polarization vector appears along plane appears at 3466 cm-1 in Lantadene A with PED 100% and corresponding sharp peak superimpose in Lantadene B at 3610 cm-1 with 100 % PED. At lower frequencies region a very intense polarized peak appears at 1018 cm-1 in Lant A and corresponding peaks appears at 1110 cm-1 with several mixing mode of vibrations due to in plane bending of -OH vibration. At lower frequencies region two back to back intense peaks are calculated at 591 cm-1 and 614 cm-1 for Lant A and 589 cm-1, 605 cm-1 for Lant B due to wagging modes of -OH with mixing of several modes of vibrations too. All these calculated peaks are in good agreement with experimental FTIR.
In general, hetero aromatic geometry C-H stretching modes of vibration appears in between 2800-3100 cm −1 [34]. In the present study, two sharp polarized peak appears at 2993 and 3002 cm-1 with PED 95% appears due C-H stretching mode of vibration in Lantadene A and corresponding peak appears at 2993 and 3008 cm-1 in Lantadene B with PED 99% which are also supported with literature. At lower end of frequencies in-plane and out of plane -CH bending appears. In present calculation polarized peaks appears due in plane -CH bending appears at 1298 cm-1 in Lantadene A, however corresponding peaks appears at 1123 cm-1 for Lantadene B with significant PED. Below 1100 cm-1, out of plane -CH bending mode mixing with wagging of -CH2/CH3 appears at the appropriate range in the calculated spectrum for Lantadene A and B which are well matched with experimental FTIR.
-C=O absorption vibration and C-C vibrations
The absorption bands (sharp stretching modes of vibration) of the carbonyl group (C=O) are observed in between 1600-1800 cm−1 [35]. The intense-C=O absorption intense peaks due to stretching of both carbon and oxygen with equal amplitude. In present communication most, intense polarized peaks with polarization vector directed along plane of adjacent rings are appeared at 1640 and 1668 cm-1 with PED 99 %, and 65 % in Lantadene A while 1695, 1711 and 1745 cm-1 with PED of 95 %, respectively in Lantadene B.
The vibrations relating to C-C stretching in the ring absorb in the region from 1400- 1600 cm-1 [36] in aromatic hydrocarbons. In the present calculation, intense polarized peak appears at 1102 cm-1 due to -CC in plane bending mode of vibration in Lantadene A and stretching mode of vibration with mixed modes at 1104 cm-1 in Lantadene B. The bending of -CCC modes appears at middle frequencies in calculated IR spectra of Lantadene A and B. At lower region of IR spectra, some intense polarized peaks are found due to out of plane bending -CH along with mixing of other bending mode for Lantadene A as well as Lantadene B. All these calculated peaks are matched well with experimental FTIR.
Methylene(-CH2) and Methyl (-CH3) group vibrations
The CH2/CH3 groups due to internal coordinate arrangement [37], having six different mode of vibration namely asymmetric, symmetric stretch, rocking, scissoring, twisting as well as wagging. In general, symmetric stretching -CH2/CH3 appears middle/lower frequencies region due to weaker bond strength and characteristic region for symmetric -CH2/CH3 observed in between 2800 cm-1 to 3000 cm-1 however antisymmetric stretching vibration for -CH2/CH3 observed some higher frequencies region 3100 cm-1-3400 cm-1due to strong bond strength [38]. In the present study, the scissoring mode of deformation CH2 groups shows some sharp peaks appears at 1455 cm-1, 1481 cm-1 in Lantadene A however an intense polarized peak appears at 1430 cm-1 due scissoring mode of deformation CH3 groups appears in calculated spectra of Lantadene B. Some other polarized peaks appear due mixing of in plane deformation rocking due to -CH3 appears at 1084 cm-1 and 1196 cm-1 in Lantadene B. At lower region of calculated IR spectra of Lantadene A, sharp polarized peak of -CH2/-CH3 appears at 1043 cm-1/1211 cm-1 while in Lantadene B, 733 cm-1/964 cm-1 due to mixing of wagging with twisting modes frequencies. All these calculated peaks are in good agreement with experimental FTIR spectra.
TDDFT analysis
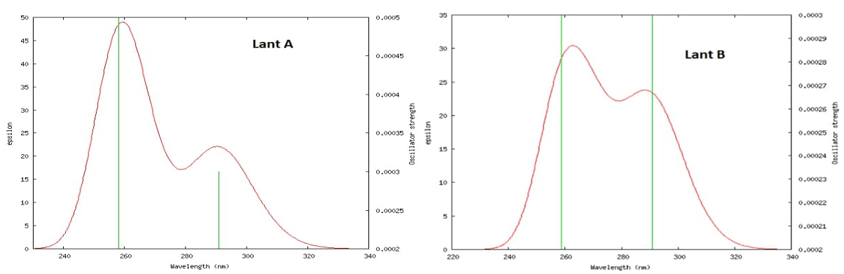
The TDDFT method is utilized by using optimized geometry of Lantadene A and Lantadene B molecule to calculate UV spectrum. The calculated transition state and transition orbital and their % contribution, Transition energy, oscillatory strength λmax, are calculated and listed in table 1. The UV spectra of Lantadene A and Lantadene B are shown in Fig. 3. In Fig. 3, the green vertical lines are showing the peaks of calculated wave length in graph having greater oscillatory strength. From this figure a prominent peak appears at 258 nm with f=0.0005 in Lantadene A while 259 and 291 nm with f=0.0003 for both wave length in Lantadene B respectively. The transition energy of electron is 4.81 eV and 4.79/4.26 eV in Lantadene A and Lantadene B respectively. The peak emerges due to transition of electron in between HOMO -4→LUMO with contribution of 80 % in Lantadene A while HOMO-4→LUMO/ HOMO-1→LUMO+1 with contribution of 92 %/95 % in Lantadene B. Two other less sharp peak appears at 291nm (f=0.0003) and 263nm (0.0002) in Lantadene A while one at 270 nm (f=0.0002) in Lantadene B. The calculated transition energy corresponds to these transitions at 4.26/4.71 eV for Lantadene A while 4.59 eV for Lantadene B.
Electronic properties (HOMO-LUMO, MESP Plots of Lantadene A and Lantadene B)
The chemical reactivity or chemical stability is determined by frontier molecular orbitals (FMO). In FMO, the highest occupied molecular orbital is termed as HOMO and lowest unoccupied molecular orbital is termed as LUMO. The supplied energy to transition of electron from HOMO to LUMO is known forbidden energy band gap. The energy gap is directly related with chemical stability [39-40]. The calculated energy gap shows that chemical reactivity of Lantadene A (5.7256 eV) is little bit less than Lantadene B (5.0102 eV). The HOMO and LUMO plots of Lantadene A and Lantadene B are shown in Fig. 4(a) and 4(b). The HOMO of Lant A is distributed over Ring C and associated group and LUMO is nearly over ring E. The HOMO of Lant B is distributed over Ring C and associated group and LUMO is nearly over ring E. The transition from HOMO→LUMO shows that electron transfer from Ring C and associated group to ring E to gain stability in both molecules.
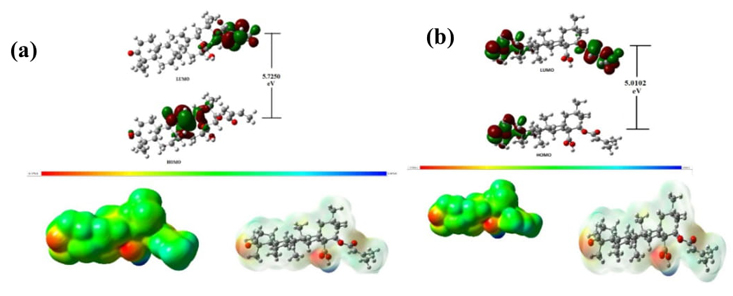
Fig. 4 (a) Pictures of HOMO-LUMO and Molecular Electrostatic Potential of Lantadene A, (b) Pictures of HOMO-LUMO and Molecular Electrostatic Potential of Lantadene B.
The ionization potential and electron affinity are any chemical system is determined by HOMO and LUMO energy. The energy needed to remove one electron from HOMO orbital is known as electronic potential and energy needed to add additional electron in LUMO is known as electron affinity. The Parr et.al [41], suggest that negative eigen value of HOMO is called ionization potential (IP) however negative eigen value of LUMO is called electron affinity (EA).
By using EA and IP chemical hardness and absolute electronegativity are determined by using following equations [42, 43],
The calculated value of energy gap implies that Lantadene B is more chemically reactive that Lantadene A. The electron affinity of Lantadene B is more than Lantadene A, this implies that Lantadene B have better tendency to gain additional electron to gain stability which is also reflect calculated value of chemical potential of both species. The calculated chemical hardness of Lantadene A is higher than Lantadene B. This means that any regent easily interacts with Lantadene B rather than Lantadene A. The chemical softness implies that how easily any regent interacts with given species and shows reverse effect with chemical hardness. The reciprocal of chemical hardness is termed as the global softness,
The calculated value Nmax is ratio of chemical potential and chemical hardness and show direction of charge transport to gain stability. All these parameters are listed in table 2.
The direction charge transport is determined by magnitude of chemical potential due to electrophilic species is accomplished to receive charge from donor atom consequently system get stabilized and attend lower energy.
The electrophilicity index is a global reactivity descriptor of a molecule that provides a quantitative classification of the global electrophilic nature of the molecule. The chemical potential of a species in a mixture can be defined as the slope of the free energy of the system with respect to a change in the number of moles of that species. It is a form of potential energy that can be absorbed or released during a chemical reaction. Although electronegativity is defined in many different ways, the most logical and rational definition of it is the electron holding power of the atoms or molecules.
The molecular electrostatic energy potential plot is very important picture to determine nature of potential of atomic sites within the molecule. The nature of electron potential surface is determined in term of color coding. The consequence of MESP lies in the detail that it concurrently displays molecular size, shape, and positive, negative, and neutral electrostatic potential regions in terms of color grading example yellow color means neutral potential surface blue color shows electropositive surface and red color as electronegative surface [46-49]. The MESP plots of Lantadene A and B are also shown on Fig. 4 (a) and 4(b). From this figure, red color encircled over -COO-C2H5CH3 group and over -COOH- and -CO of ring A in Lant A and Lant B respectively so behaves as most electronegative surface in Lant A and Lant B. In both Lant A and Lant B, blue color encircled over -OH in -CH2OH group attached at ring D and E. The white color encircled over whole molecule in Lant A and Lant B.
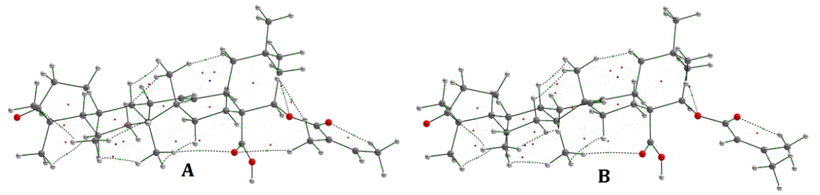
QATIM analysis
The quantum atomic theory in molecule QTAIM [50] is significant tool to determine nature and strength of
nonbonding or bonding interactions by using topological parameters. The bond
critical point is known as four critical point (3,-1) is introduced by Bader
which provides information to define interactions like covalent and non-covalent
interaction in any chemical system. The nature and strength of non-covalent
interaction are calculated by some topological parameters e.g. electron density
ρ(r), local potential energy density V(r), Laplacian ∆2 ρ(r), Total
energy density H(r)=V(r)+G(r), etc. The topological parameters at bond critical
point (BCP) for Lant A and Lant B are calculated and listed in table-3 respectively. The graphical AIM
pictures of interactions for Lant A Lant B are shown in Fig. 5. The electron density (ρ
H…A) falls in between 0.002-0.040 a.u. and Laplacian (∇2
ρ
BCP) falls in between 0.024-0.139 a.u. for nonbonding interactions
[51]. Based on these criteria of
nonbonding six nonbonding interactions appear in both Lant A and Lant B for
nonbonding. In Lant A molecule six nonbonding interactions are
H88-O4
, H73-O4
, H55-H75
, O1-H79
, H71-H74, H77-H50
however in Lant B corresponding interactions are H72-O4
, H86-O5
, H78-O1
, H51-H71
, H54-H74
, H75-H59. The charge density
ρ
BCP at BCP in Lant A varies from 0.00347a.u.-0.01450a.u. and got its
maximum for H55-H75 and minimum value for
H88-O4 however charge density at BCP for Lant B
varries in between 0.00450 a.u.- 0.01420a.u. The maximum value of
ρ
BCP for H54-H74 and minimum value of
ρ
BCP for H72-O4. The charge density at BCP for
O-H interaction varries in between 0.00450- 0.01190 a.u. in Lant B and
0.00347-0.01138 a.u. in Lant A. From this data, ρ
BCP for O-H interaction for LantB > LantA. The calculated
ρ
BCP for H-H interaction 0.01288-0.01450 a.u. in Lant A and
corresponding charge density for H-H interaction in Lant B varies in between
0.01270 to 0.01420. One important thing noticed
ρ
BCP for H-H interaction >O-H interaction. For both Lant A and Lant
B order of magnitude of charge density
ρ
(r) are smaller as compared with typical covalent bond
but lesser value of
ρ
(r) between these interactions for O-H in both Lant A
Lant are comparable with to 0.007 au in HCl----HF [52].The second derivative of laplacian charge density
(∇2
ρ
BCP ) for Lant A varies from 0.01170 to 0.05280 a.u. and attained
maximum value ∇2
ρ
BCP =0.05280a.u. for H55-H75 however Laplacian
second derivatives of electron charge density varries from 0.01470 -0.05280 for
Lant B and attained maxium value for ∇2
ρ
BCP =0.05280 a.u. for H54-H74. The exisitance
of small delocalization between both interacting atoms shown by using calculated
∇2
ρ
BCP in both natural products. In both natural product Lant A and Lant
B for all six interactions ∇2ρBCP >0 and
ρ
BCP >0 means all interaction are electrovalent nature. The singe
of Laplacian electron density ∇2ρBCP shows that
concentration of charge in a exhausted or “closed shell. In Lant A for all six
interaction ∇2ρBC>0 and ρ
BCP lies within range 10-3 for
H73-O4
, H88-O4 for Lant A and
H72-O4 for Lant B falls within van der Waals
‘interaction [53]. The rest all
interaction in both Lant A and Lant B ρ
BCP lies within range 10-2 and falls within hydrogen
bonding interactions [54]. The calculated
potential energy density at BCP are determine nature and strength of
interactions. The nonbonding at BCP is weak when ∇2ρBCP
>0, HBCP>0 and interaction is called electrovalent for
∇2ρBCP >0, HBCP<0. The all interactions in both
Lant A and Lant B are weak except H77-H50
H71-H74 for Lant A H54-H74 for
Lant B falls in electrovalent category. The interactions in between atoms are
calculated by following equation ∆E=-1/2V [55]. All interactions are falls within weak interaction lies within
range 1kcal/mol< IE <5 kcal/mol except H88-O4,
H73-O4 for Lant A H72-O4 in Lant
B lies IE <1 kcal/mol falls very weak type interaction [56]. The strongest interaction appears for
H55-H75 in Lant A and H86-O5
Lant B. The chemical natures of any chemical systems are calculated by using
curvature point of second derivative of electron density
∇2ρBCP at BCP λ1, λ2. ,
λ3. One of another parameter’s ratio
NBO analysis
The NBO analysis is important method to calculate charge transfer from donor to acceptor to determine interaction in any molecular systems [58]. The strength of interaction in term of charge transfer from donor to acceptor is determine by second order perturbation energy E (2).The strength of interaction among electron donors and electron acceptors are directly related by second order perturbation energy of E(2) means the strength of interaction increases with second order perturbation energy of E(2) . The strength of interaction is calculated by (or stabilization energy) [59-60]
In this equation population of donor orbital is qi however orbital energies (diagonal elements) of donor are εi, εj. The fock matrix donor acceptor orbitals and their occupancies as well as second-order perturbation energy of Lant A and Lant B is calculated and listed in table 4 by using same level theory. They stabilizes the system due to charge transfer in between donor and acceptor orbital overlap Lp→ π*/σ *. In first type of interaction Lp→ σ * appears due to charge transfer in between Lp(2)O5 → σ*(C36-C37) orbitals stabilized system by16.54kcal/mol and 16.40 kcal/mol for Lant A and Lant B respectively which further enhance charge transfer from Lp(2)O5 → σ*(C36-O1) is stabilized by32.11kcal/mol and 32.57kcal/mol in Lant A and Lant B respectively. Another significant interaction appears due to charge transfer Lp(2)O4 → σ*(C22-C33) which stabilized by 18.84kcal/mol and 19.10kcal/mol for Lant A and Lant B respectively. This strength of interaction Lp(2)O4 → σ*(O3-C33) further enhance by 31.07kcal/mol and 33.49kcal/mol in Lant A and Lant B respectively. The significant interaction appears in between Lp(2)O2 →σ*(C8-C9) stabilize by 9.81kcal/mol and 20.43kcal/mol for Lant A and Lant B respectively which further enhance in interactions Lp(2)O2 → σ*(C7-C8) by 19.82kcal/mol and 20.21kcal/mol for Lant A and Lant B respectively. In second type interaction one important interactions happens in among Lp(2)O3 →π*(O4-C33) which stabilize by 43.40kcal/mol and 43.57kcal/mol for Lant A and Lant B respectively. Another important interaction appears in between Lp(2)O1 →π*(O5-C36) which stabilize Lant A and Lant B by 42.81kcal/mol and 42.61kcal/mol respectively.
Table-4. NBO analysis of donor acceptor obritals and their occupancies second order perturbation interaction energy for Lant A and Lant B
| LANT-A | ||||||
|---|---|---|---|---|---|---|
| Donor NBO(i) | occupancy(i) | Acceptor NBO(j) | occupancy(j | E (2)(kcal/mol | (Ej-Ei) a.u | F(i,j) a.u |
| Lp(2)O5 | 1.84332 | σ*(C36-C37) | 0.0669 | 16.54 | 0.69 | 0.097 |
| Lp(2)O5 | 1.84332 | σ*(C36-O1) | 0.1121 | 32.11 | 0.62 | 0.127 |
| Lp(2)O4 | 1.85624 | σ*(C22-C33) | 0.0724 | 18.84 | 0.63 | 0.099 |
| Lp(2)O4 | 1.85624 | σ*(O3-C33) | 0.0941 | 31.07 | 0.61 | 0.125 |
| Lp(2)O3 | 1.82363 | π*(O4-C33) | 0.0210 | 43.40 | 0.34 | 0.109 |
| Lp(2)O2 | 1.89039 | σ*(C8-C9) | 0.0778 | 19.81 | 0.65 | 0.102 |
| Lp(2)O2 | 1.89039 | σ*(C7-C8) | 0.0618 | 19.82 | 0.66 | 0.103 |
| Lp(2)O1 | 1.79238 | π*(O5-C36) | 0.2002 | 42.81 | 0.34 | 0.108 |
| LANT-B | ||||||
| Donor NBO(i) | occupancy(i) | Acceptor NBO(j) | occupancy(j) | E (2)(kcal/mol | (Ej-Ei) a.u | F(i,j) a.u |
| Lp(2)O5 | 1.84493 | σ*(C36-C37) | 0.1025 | 16.40 | 0.70 | 0.098 |
| Lp(2)O5 | 1.84493 | σ*(C36-O1) | 0.1025 | 32.57 | 0.62 | 0.129 |
| Lp(2)O4 | 1.84347 | σ*(C22-C33) | 0.0769 | 19.10 | 0.63 | 0.100 |
| Lp(2)O4 | 1.84347 | σ*(O3-C33) | 0.1017 | 33.49 | 0.61 | 0.129 |
| Lp(2)O3 | 1.82589 | π*(O4-C33) | 0.0224 | 43.57 | 0.35 | 0.111 |
| Lp(2)O2 | 1.88771 | σ*(C8-C9) | 0.0788 | 20.43 | 0.65 | 0.104 |
| Lp(2)O2 | 1.88771 | σ*(C7-C8) | 0.0613 | 20.21 | 0.67 | 0.105 |
| Lp(2)O1 | 1.79787 | π*(O5-C36) | 0.0223 | 42.61 | 0.34 | 0.109 |
NLO properties
The nonlinear optical properties NLO of Lant A and Lant B are calculated by using several parameters like dipole moment, mean polarizability, anisotropic polarizibilty, molar refractivity (MR) hyperpolarizibity etc. In three dimensional Cartesian coordinate system dipole moment, mean polarizability, hyperpolarizability are calculated by using following equation [61]
The hyperpolarizability (β), a nonlinear-optical property of a molecule, is the second-order electric susceptibility per unit volume. The electric susceptibility is a dimensionless proportionality constant that indicates the degree of polarization of a dielectric material in response to an applied electric field. The greater the electric susceptibility, the greater the ability of a material to polarize in response to the field, and thereby reduce the total electric field inside the material(and store energy). It is in this way that the electric susceptibility influences the electric permittivity of the material.
The Lorenz-Lorentz are used by using molar refractive index [62-64]
In this equation, α is the mean polarizability and N is the Avogadro number. The polarizibilty (αe)along x axis and polarizibilty along y axis is (αo). By using these polarizibility ordered parameter is computed by following equation [65-66]
(For α: 1 a.u. = 0.1482×10⁻²⁴ esu; for β0: 1 a.u. = 8.639×10⁻³³ esu)
The dipole moment of any system is signature of magnitude charge distribution on any that system without application electric field. The calculated dipole moment of lant A and Lan B are nearly 1.5 times of dipole moment of water (1.85D). This large dipole moment reported due to unsymmetrical distribution of title molecules with unequal electronegative atoms like oxygen hydrogen and carbon however calculated dipole moment of Lant B >Lant A molecule. The polarizibity as well as well hyperpolarizibity of any system are described by applied electric field. The mean polarizibility, hyperpolarizibity, molar refractivity (MR), order parameters. Anisotropic polarizibility, of Lant A and Lant B are calculated and listed in table 5. The greater calculated mean polarizibity anisotropic polarizibity based on direction molar refractivity(MR) for Lant B established superiority over NLO properties for Lant A molecule. The calculated order parameters for both Lant A and Lant B are still lower as compared with stablished NLO materials but order parameter for Lant A is greater than Lant B. The calculated hyperpolarizibity of Lant B Lant A are nearly six times greater than corresponding value of refrence molecule urea(0.1947*10-30 e.s.u.) however calculated hyperpolarizibity of Lant B is greater than Lant A. The NLO activity appears on Lant A and Lant B due moment of π electron from donor to acceptor in both Lant A and Lan B.
Molecular docking
The molecular docking indicates binding action of drug with appropriate protein. The docking action of Lant A and Lant B with selected protein has been performed by Auto Dock 4.2 software [67]. In docking process grid of 60 Å × 60 Å × 60 Å size was selected for docking. In preparation process of protein, we removed co-crystallized ligands and water molecules from selected PDB file. By using UCSF Chimera program [68] Gasteiger charges as well as hydrogen atoms were allocated to protein residues. The Lant A and Lant B were docked with prepared protein by using Auto Dock 4.2 program package which consider Lamarckian Genetic Algorithm (LGA) [69]. The Discovery Studio software [70] utilized for visualization of interactions between Lant A and Lant B with suitable protein.
The appropriate targets are calculated by using Swiss dock is online server [71]. The swiss dock online server predicts three proteins for docking with Lant A and Lant B molecule. The Swiss dock is online server which based on newton mechanics utilized to predict target protein for docking. In target prediction by swiss dock online server we have uploaded optimized geometry of LantA and Lant B uploaded smile code of optimized geometry on swissdock server. The docking of the proteins of all structures of BCL2L1 and IKBKB with participating atoms of Lant A and Lant B and corresponding bond lengths are listed in tables 6 and 7 and all possible interaction during docking were presented by LIGPLOT. The binding affinity is closely related with number of atoms in ligand so ligand efficiency index of title molecule with respect to particular targets. The ligand efficiency is designed separating the score found in the docking simulation by the total number of non‑hydrogen atoms of the ligand.
Table 6 Different parameters for molecular docking of Lant A and B with different protein structures.
| Target Proteins | Selected PDB structures with their resolutions | Hydrogen Bonding residues | Ligand efficiency | Inhibition constant (μM) | Binding energy (kcal/mol) | ||||
|---|---|---|---|---|---|---|---|---|---|
| Lant A | Lant B | Lant A | Lant B | Lant A | Lant B | Lant A | Lant B | ||
| BCL2L1 BCL2 like 1provided by HGNC | 6WGZ 2.20 Å | TRPA:140 GLUA:326 | ASNA:140 | 0.1475 | 0.1675 | 74.3354 | 75.09123 | -5.9 | -6.7 |
| 6WH0 1.99 Å | TYRA:29 | LYSA:355 | 0.1525 | 0.1625 | 23.5650 | 27.2025 | -6.1 | -6.5 | |
| 202M 2.25 Å | ASNA:140 GLYA142 | ASNA:140 | 0.1275 | 0.1450 | 124.9156 | 124.8355 | -5.1 | -5.8 | |
| IKBKB inhibitor of nuclear factor kappa B kinase subunit beta | 4kik 2.83 Å | LIUB:21 LYSB:147 TRYB:98 | CYSB:99 | 0.1475 | 0.1350 | 107.8772 | 109.2227 | -5.9 | -5.4 |
| 3rzf 4.0 Å | ASNA:140 GLYA:142 | ASPA:103 GLYA:102 LYSA:106 | 0.1575 | 0.1800 | 80.8633 | 81.0748 | -6.3 | -7.2 | |
Table 7 Hydrogen bonding residues, Binding atoms and Bond length for molecular docking of Lant A and B with different protein structures.
| Target Proteins | Selected PDB structures with their resolutions | Hydrogen Bonding residues | Binding atoms | Bond length | |||
|---|---|---|---|---|---|---|---|
| Lant A | Lant B | Lant A | Lant B | Lant A | Lant B | ||
| BCL2L1 BCL2 like 1provided by HGNC | 6WGZ 2.20 A0 | TRPA:140 GLUA:326 | ASNA:140 | O3 O2 | O5 | 2.319 2.132 | 2.103 |
| 6WH0 1.99 A0 | TYRA:29 | LYSA:355 | O2 | O5 | 1.419 | 1.813 | |
| 202M 2.25 A0 | ASNA:140 GLYA142 | ASNA:140 | O3 O5 | O2 | 2.464 2.032 | 2.723 | |
| IKBKB inhibitor of nuclear factor kappa B kinase subunit beta | 4kik 2.83 A0 | LIUB:21 LYSB:147 TRYB:98 | CYSB:99 | O3 O2 O5 | O3 | 1.976 1.945 1.932 | 2.221 |
| 3rzf 4.0A0 | ASNA:140 GLYA:142 | ASPA:103 GLYA:102 LYSA:106 | O5 O3 | O3 O1 O5 | 2.255 2.469 | 2.421 2.221 2.404 | |
Docking of lant A and lant B with BCL2L1 protein
In western world colorectal cancer (CRC) is the second important reason of cancer. The BCL2L1 protein determined by this gene fits to the BCL-2 protein family. BCL-2 family member’s systems hetero- or homodimers and item as anti- or pro-apoptotic regulators that is complicated in an extensive variability of cellular activities. The BCL2L1 protein interacts with the tumor suppressor P53 after experience to cell strain. The BCL2L1 has a practical character in colorectal cancer [72]. To discover the inhibition action of Lant A and Lant B against BCL2L1, we have selected three pdb geometry of protein 2O2M [73], 6wh0 [74], 6wgz [75] with resolution 2.25A0, 1.99A and 2.20A0 respectively.
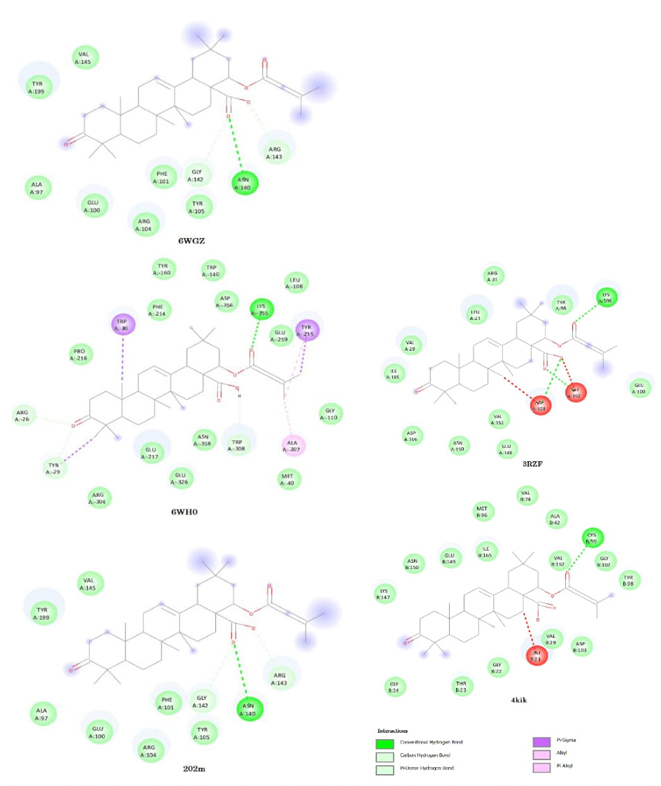
In these geometries of BCL2L1 dock with Lant A and Lant B highest binding energy 6WH0 (-6.1kcal/mol) and (-6.5kcal/mol) respectively. The docking of these selected geometries with Lant A and Lant B are shown in Figures 6 (a) and 6(b) and 7(a) and 7(b). The inhibition constant for 6WH0 pdb structures having lowest compared with other two pdb structures. The highest ligand efficiency for Lant A (0.1525) and Lant B (0.1625) and lower inhibition constant proposed that Lant A and Lant B probably good candidate for anticancer drugs.
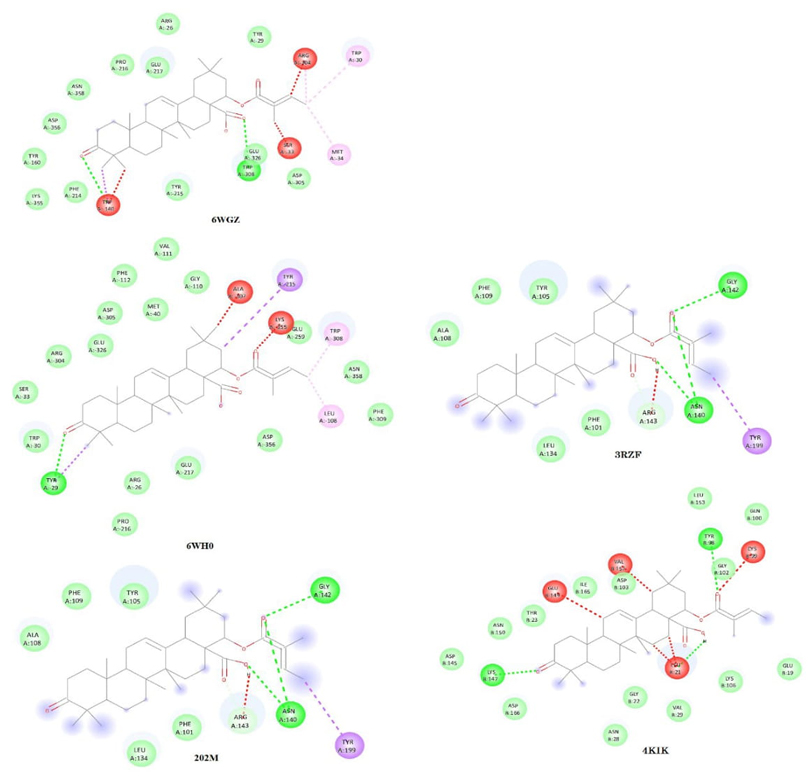
Fig. 6 (a) Docking Of various PDB structure of BCL2L1 protein with Lant A, (b) Docking Of various PDB structure of IKBKB protein with Lant A.
Docking of IKBKB with lant A and lant B
The IKK-β having an important character in brain cells resulting as a stroke [76]. The Inhibition of IKK and IKK-related kinases has been examined as a healing choice for the dealing of inflammatory diseases and cancer [77] In this communication to explore the binding affinity and inhibition capability of Lant A and Lant B with IKBKB we have selected two pdb file of protein IKBKB are 4kik [78], 3rzf [79] having resolution 2.83 Å and 4.0 Å respectively and were preferred and originate to have potential inhibition activity in contradiction of IKBLB protein. The binding energy of LantA and Lant B highest for 4kik (6.5kcal/mol) and 3rzf (-7.2kcal/mol) respectively. The docking figure shows that binding energy is highest in Lant A. The hydrogen bonding appears in between O5, O3 atoms in Lant A bind with residue ASNA: 140, GLYA:142 of 3rzf protein structure of IKBKB with bond length 2.225 Å and 2.469 Å respectively. In Lant B, in binding three hydrogen bond appears in between O3,O1,O5 in Lant B with ASPA:103, GLYA:102, LYSA:106 residue with bond length 2.421 Å, 2.221 Å, 2.404 Å respectively. The highest ligand efficiency is high for 3rzf structure of IKBKB protein for LantA (0.1575) and Lant B (0.1800) respectively. The calculated inhibition constant is 80.8633 μM and 81.0784 μM respectively for Lant A and Lant B which lies corresponding lower value for 4kik structure. The other pdb geometry 4kik of IKBKB loosely binds with residues. The docking of these selected geometries with Lant A and Lant B are shown in Figures 6 (a) and 6(b) and 7(a) and 7(b).
Conclusions
Our study delves into the characterization of Lantadene A and B through FTIR spectroscopy, employing the B3LYP/6-311G (d, p) method to calculate their fundamental vibrational frequencies. A comprehensive assignment of vibrational wavenumbers has been achieved through potential energy distribution (PED) analysis, demonstrating an impressive concordance between our calculated spectra and experimental observations. Additionally, to substantiate our findings, we conducted TDDFT calculations. In our quest to illustrate the reactivity of Lantadene A and B, we computed several chemical parameters, including the HOMO-LUMO gap. We further visualized their frontier orbitals, HOMO-LUMO surfaces, and Molecular Electrostatic Potential (MEP) surfaces, shedding light on their inherent reactivity. Furthermore, our investigation into hyper-polarizability values suggests the potential utility of these compounds in electro-optical applications. We also explored the molecular docking interactions of Lantadene A and B with suitable protein targets, offering a detailed analysis of the results. Our findings suggest that these compounds hold promise as candidates for anticancer and anti-inflammatory applications. In summary, our study underscores the potential of Lantadene A and B in the realms of both molecular reactivity and therapeutic applications, particularly in the context of anticancer and anti-inflammatory agents, while also highlighting their suitability for electro-optical endeavors.

