


![Síntesis, actividad antitricomonal in vitro y estudio de acoplamiento de bencenosulfonamidas N-[(4-fenil sustituido)-1,3-tiazol-2-il]-4-sustituidas](/img/es/next.gif)


 nueva página del texto (beta)
 Inglés (pdf)
 Artículo en XML
 Referencias del artículo
 Enviar artículo por email
 Citado por SciELO
  Similares en
SciELO
Similares en
SciELO 
 Permalink
Introduction
The most used class of antifungals are compounds that include an azole moiety [1]. Hence, many triazole and imidazole derivatives have been shown to have a broad spectrum of antibiotic activity which makes them target pharmacophores to counteract mycosis caused by yeast and filamentous fungi [2]. Antifungals such as fluconazole, voriconazole and itraconazole are commonly prescribed drugs for treating invasive fungal infections (IFIs) [3], which continue to be an important cause of morbidity and mortality in immunocompromised patients. These drugs share the presence of a triazole moiety in their structure, which is responsible for the interaction between the molecule and the 14-α-demethylase (the cytochrome P-450 dependent enzyme). Inhibition of this enzyme causes the formation of toxic esters in the fungal membrane; therefore, its permeability is modified and reduces the fungus ability to reproduce [4]. Other nitrogen heterocyclic moieties such as pyridine and thienopyridine have been found in natural compounds and exert significant biological activity in several studies. Some of these compounds have shown important anticancer [5], antibacterial [6], antimalarial, and antifungal biological activity [7]. (Fig. 1).
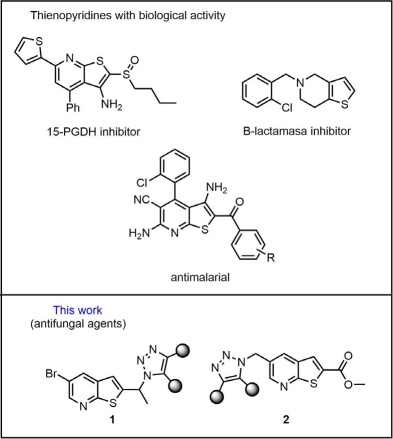
Fig. 1 The novel compounds involve the extremely important 1,2,3-triazole pharmacophoric cores and thienopyridines, a similar feature found in other compounds reported.
The continuous increase of antimicrobial resistance that some fungi are developing makes the design and development of compounds effective for treating these infectious species of clinical importance a constant necessity (e.g. Candida albicans, C. glabrata [8], Aspergillus fumigatus, A. niger [9,10], and Mucor sp. and Cryptococcus neoformans [10].
Currently, fungal diseases are of great importance due to the increase of medical conditions that cause immunosuppression in the host and enable the establishment of infections that can range from mild and common superficial infections to potentially fatal invasive infections. Most common pathogens include Candida species, which are mainly responsible for invasive candidiasis and candidemia, especially C. albicans, C. glabrata and C. krusei species. The infection usually affects patients admitted to the intensive care unit (ICU) who receive treatments for malignant tumors or steam cell, and organ transplantation [11]. Attention has been focused on these species because of the worldwide increase in resistance they have been displaying against azoles-based drugs and echinocandins [12].
Another important example is Aspergillus fumigatus fungus which is the main cause of Aspergillus pulmonary disease. An invasive pulmonary aspergillosis (IPA) causes 30-60 % mortality in patients with a compromised immune system [13]. IPA became highly relevant in the COVID-19 pandemic in patients with acute respiratory distress syndrome associated with a high mortality rate that in some reports reached 64.7 % [14].
Mucormycosis is an infection caused by fungi of the Mucorales order which includes several genera. Of this group, Rhizopus is associated with around 48 % of cases, followed by Mucor which is associated with 14 %. This mycosis affects more patients with HIV, but during the SARS-CoV-2 virus pandemic, cases of co-infection with black fungus, a name given to the lesions caused by mucormycosis, were reported in India with a mortality rate of 30.7 % [15,16].
Similarly, Trichosporum species has been reported as the second cause invasive yeast infections in the central nervous system in patients with hematological cancer [17], although it normally causes superficial infections forming nodules along the hair follicle [17]. In the case of Trichosporum cutaneum it has been implicated as the causative agent of the summer-type hypersensitivity pneumonitis in Japan [18].
The use of computer software to calculate molecular properties and predict bioactivity is often required in the design of alternative treatments for the above-mentioned infections. Cheminformatic properties have the advantage of predicting the site of action, likely route of administration, pharmacokinetic and pharmacodynamic behavior and potential toxic effects.
Simulation techniques and online servers such as Molinspiration, Molsoft, and the Osiris Property Explorer server, allow the cheminformatic and biological properties of the molecules to be known. These include the partition coefficient, the polar surface area, the number of rotating bonds, hydrogen bond acceptors (HBA), hydrogen bond donors (HBD) and Lipinski rules (Molinspiration and Molsoft). Then the best route of administration can be predicted with the gathered data [19]. Similarly, the pharmacokinetic properties of absorption, distribution, metabolism, excretion, and toxicity (ADMET) can be predicted from the online tool pkCSM and SwissADME. Another important aspect is to know the possible toxicological effects that the compounds may have, for which the Osiris Property Explorer compares molecular properties of the designed compounds with properties of known drug molecules to assess their possible tumorigenic or mutagenic risks [20].
Experimental
Flash column chromatography
SiO2 60 (230-400 mesh). TLC: Silica-gel plates (SiO2; 0.20-mm thickness); visualization with UV light at 254 nm. m.p.: Fischer-Johns Scientific melting point apparatus. 1 H- and 13 C-NMR spectra: Bruker Avance 300 MHz and Varian 500 MHz; δ in ppm rel. to Me4Si as an internal standard, J in Hz. MS: The results were collected using a direct insertion probe and the electron impact ionization method on a Shimadzu GCMS-QP2010 Plus instrument; results are reported in m/z (rel. %).
General procedure for the synthesis of the triazole derivatives
The corresponding azide 4 or 6 (0.15 mmol) and the ketone 7 a-c (0.15 mmol) were dissolved in anhydrous DMF (3 mL) under a nitrogen atmosphere. Then, DBU (0.3 mmol) was added, and the resulting mixture was stirred at 50-60 ºC until reaction completion (monitored through TLC ~24h). Afterwards the solution was cooled to room temperature under continuous stirring. Then, DMF was removed with extractions using a brine solution and EtOAc. The combined organic extracts were filtered and dried over anhydrous Na2SO4. Finally, the extracts were concentrated under reduced pressure and the crude reaction mixture was purified by flash chromatography with EtOAc/hexane 7:3.
5-bromo-2-(1-(5-(p-tolyl)-4-tosyl-1H-1,2,3-triazol-1-yl) ethyl)thieno[2,3-b]pyridine (1a). Following the general procedure, azide 4 (0.042 g, 0.15 mmol) and ketone 7a (0.043 g, 0.15 mmol) were dissolved in anhydrous DMF (3 mL). DBU (0.044 mL, 0.3 mmol) was added, and the solution was stirred for 24 h at 50-60°C. The mixture was extracted with EtOAc (3x10 mL) and the crude extract was purified by flash column chromatography to afford a white solid 1a (0.043 g, 52 %), m.p. 152-154 °C. 1H NMR: (30 MHz, CDCl3) δ = 8.68 (d, J = 2.4 Hz, 1H), 8.29 (d, J = 8.0 Hz, 2H ), 8.28 (s, 1H), 8.12 (d, J = 8.8 Hz, 2H), 7.99 (s, 1H), 7.78 (s, 1H), 7.72 (d, J = 8.8, 2H), 7.33 (d, J = 8.0 Hz, 2H), 4.75 (d, J = 4.5 Hz, 1H), 2.93 (s, 3H), 2.86 (s, 3H), 2.68 - 2.61 (m, 3H) ppm. 13C NMR (75 MHz, CDCl3) δ = 162.6, 161.4, 150.5, 145.5, 135.3, 134.1, 130.5, 130.1, 128.5, 125.7, 124, 117.2, 64.2, 26.7, 21.8 ppm. MS [EI+] m/z (%) calculated for C25H21BrN3O2S2: 552 [M]+ (15), 149 (28), 71 (28), 57 (65), 41 (59).
(1-(1-(5-bromothieno[2,3-b]pyridin-2-yl)ethyl)-5-phenyl-1H-1,2,3-triazol-4-yl)(phenyl)methanone (1b). Following the general procedure, azide 4 (0.042 g, 0.15 mmol) and ketone 7b (0.043 g, 0.15 mmol) were dissolved in anhydrous DMF (3 mL). DBU (0.044 mL, 0.3 mmol) was added, and the solution was stirred for 24 h at 50-60°C. The mixture was extracted with EtOAc (3x10 mL) and the crude extract was purified by flash column chromatography to afford a yellow solid 1b (0.034 g, 47 %), m.p. 138-140 °C. 1H NMR (300 MHz, CDCl3) δ = 8.58 (d, J = 2.3 Hz, 1H), 8.13 (s, 1H), 7.88 (s, 2H), 7.80 (s, 1H), 7.51 - 7.40 (m, 2H), 7.39 - 7.25 (m, 6H), 5.53 (s, 1H), 2.27 (s, 3H) ppm. 13C NMR (75 MHz, CDCl3) δ 191.4, 147.8, 145.5, 145.1, 139.7, 134.9, 133.7, 133.1, 130.1, 129.6, 129.3, 128.1, 125.8, 125.3, 123.6, 119.1, 116.8, 63.7, 21.3 ppm. MS [EI+] m/z (%) calculated for C24H17BrN4OS: 488 [M]+ (7), 121 (31), 84 (100), 57 (31), 47 (52), 35 (47).
methyl5-((4-benzoyl-5-phenyl-1H-1,2,3-triazol-1-yl)methyl)thieno[2,3-b]pyridine-2-carboxylate (2a). Following the general procedure, azide 6 (0.042 g, 0.15 mmol) and ketone 7b (0.043 g, 0.15 mmol) were dissolved in anhydrous DMF (3 mL). DBU (0.044 mL, 0.3 mmol) was added, and the solution was stirred for 24 h at 50-60°C. The mixture was extracted with EtOAc (3x10 mL) and the crude extract was purified by flash column chromatography to afford a yellow solid 2a (0.036 g, 53 %), m.p. 219-221 °C. 1H NMR (300 MHz, CDCl3) δ = 8.30 - 8.20 (m, 5H), 7.90 (d, J = 3.7 Hz, 2H), 7.74 (s, 1H), 7.59 - 7.51 (m, 1H), 7.52 - 7.37 (m, 4H), 5.59 (s, 2H), 2.87 (s, 3H) ppm. 13C NMR (75 MHz, CDCl3) δ = 177.7, 162.6, 137.0, 133.1, 132.1, 130.7, 130.5, 129.8, 129.8, 129.7, 129.1, 128.3, 128.3, 127.7, 126.8, 126.2, 126.1, 52.9, 49.7 ppm. MS [EI+] m/z (%) calculated for C25H18N4O3S: 454 [M]+ (9), 235 (35), 161 (80), 57 (35), 41 (38)
methyl 5-((4-cyano-5-phenyl-1H-1,2,3-triazol-1-yl) methyl)thieno[2,3-b]pyridine-2-carboxylate (2b). Following the general procedure, azide 6 (0.042 g, 0.15 mmol) and ketone 7c (0.043 g, 0.15 mmol) were dissolved in anhydrous DMF (3 mL). DBU (0.044 mL, 0.3 mmol) was added, and the solution was stirred for 24 h at 50-60°C. The mixture was extracted with EtOAc (3x10 mL) and the crude extract was purified by flash column chromatography to afford a yellow solid 2b (0.025 g, 45 %), m.p. 205-207 °C. 1H NMR (300 MHz, CDCl3) δ = 8.32 (d, J = 2.2 Hz, 1H), 7.89 (d, J = 2.2 Hz, 1H), 7.65 - 7.48 (m, 3H), 7.42 - 7.30 (m, 3H), 5.67 (s, 2H), 2.86 (s, 3H) ppm. 13C NMR (75 MHz, CDCl3) δ = 162.6, 147.1, 143.9, 142.2, 133.0, 131.9, 131.7, 129.9, 129, 128.9, 126.8, 126.1, 123.1, 121.3, 50.3, 49.7 ppm. MS [EI+] m/z [M]+ calculated for C19H13N5O2S: found 375.0793 [M]+ (23.6), 366.9792 (17.8), 354.9792 (20.1).
Results and discussion
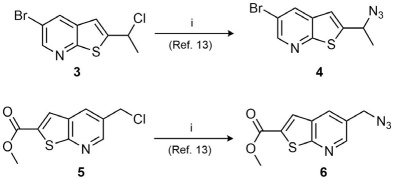
In the initial part of this study, the synthesis of azides 4 and 6 was key for introducing the thienopyridine core (Scheme 1). Thus, the synthesis of the derivatives was achieved through nucleophilic substitution of the halogenated thienopyridine analogs 3 and 5 with sodium azide. The reaction proceeded with moderate yields and the compounds were easily purified by chromatography. The introduction of the azide moiety was confirmed by the IR spectra where the characteristic signal for the -N=N=N stretch was identified as a strong sharp signal between 2100-2200 cm-1.
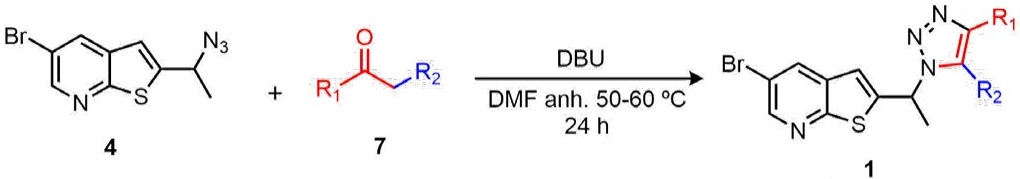
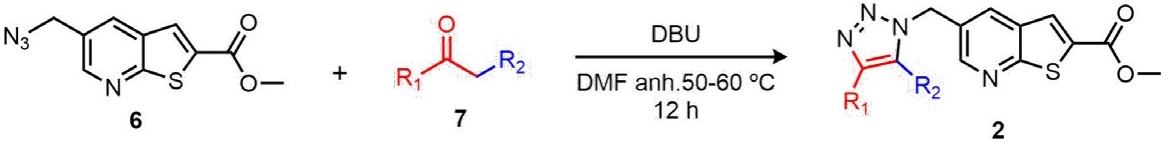
Once the desired azides were synthesized, the next step was their transformation into the corresponding triazoles 1a,b and 2a,b. One of the most important methodologies for obtaining a 1,2,3-triazole core, is the Copper-catalyzed azide-alkyne cycloaddition (CuAAC) [21]. However, other strategies have emerged with the objective of providing new alternatives with a greener approach. We previously reported a novel synthetic protocol to afford the efficient assembly of 1,4,5-trisubstituted 1,2,3-triazoles through an azide-enolate cycloaddition [22]. Thus, thienopyridine triazoles 1a,b and 2a,b were synthesized by the efficient 1,3-dipolar cycloaddition between azide 4 and 6 and different enolates prepared in situ from ketones 7 under basic catalysis using 1,8-Diazabicyclo[5.4.0]undec-7-ene (DBU). Table 1 summarizes the results from the cycloaddition. The structure of this novel compounds was confirmed by spectroscopical, and spectrometric methods. All compounds were afforded in moderate yields.
Table 1 Synthesis of thienopyridines and imidazole linked-1,2,3-triazoles from azide 4 and 6 by coupling with active ketones 7.
| ||
| Entry a | Ketone | Triazole b (Yield%) c |
| 1 | 6a: R1 = 4-CH3Ph; R2 = SO2-4-Tolyl | 1a: 52 |
| 2 | 6b: R1 =Ph; R2 = COPh | 1b: 47 |
| ||
| Entry a | Ketone | Triazole b (Yield%) c |
| 1 | 6b: R1 = Ph; R2 = COPh | 2a: 53 |
| 2 | 6c: R1 = Ph; R2 = CN | 2b: 45 |
aReaction conditions: To a solution of azide compound (1.0 eq) and cetone 7 (1.0 eq) in DMF anh. was added (2.0 eq) of DBU. The reaction mixture was stirred at 50-60 ºC for 12-24 h.
bConfirmed by 1H-NMR, 13C-NMR and MS.
cYields refer to chromatographically pure isolated compounds.
Computational studies
Molecular and chemoinformatic properties were obtained using the Molinspiration, Molsoft and Osiris Property Explorer simulators. The predicted property values of compounds 1a,b and 2a,b are summarized in Table 2. Based on the Lipinski rules, all compounds have good therapeutic potential. Only compounds 1a and 1b showed violations for the rule of five. However, all compounds displayed HBA and HBD values less than 10 and 5, respectively which indicates good drug permeation [23]. Moreover, triazole derivatives having a molecular weight of less than 500 g/mol and a logP value of less than 5, indicate that the permeability of the compounds through oral administration is favored. In the case of compound 1a with molecular weight more than 500 and with a logP that exceeds 5, shows a pair of violation to the Lipinski rules but still the compound can be considered for oral administration, or it could be administered by another route, for example parenteral, intravenous or intraperitoneal.
Table 2 Molecular and chemoinformatic properties of compounds 1 and 2.
| Properties | 1a | 1b | 2a | 2b |
| MF | C25H21BrN4O2S2 | C24H17BrN4OS | C25H18N4O3S | C19H13N5O2S |
| MW | 553.51 | 489.39 | 454.50 | 375.40 |
| No. HBA | 6 | 5 | 7 | 7 |
| No. HBD | 0 | 0 | 0 | 0 |
| PSA | 77.75 | 60.68 | 86.99 | 93.71 |
| LogP | 6.37 | 6.15 | 4.62 | 3.26 |
| ẟ | 1.34 +0.1 | 1.29 +0.1 | 1.37 +0.1 | 1.42+0.1 |
| ST | 51.9 +0.1 | 52.1 +0.1 | 57.0 +0.1 | 60.9 +0.1 |
| Polarizability | 55.32 | 50.12 | 51.08 | 41.55 |
| MR | 139.57 | 126.42 | 128.85 | 104.81 |
| MV | 364.3 | 327.1 | 331.6 | 263.4 |
| nrotb | 5 | 5 | 7 | 5 |
| Drug likeness | -10.89 | -1.88 | -2.33 | -7.09 |
| Lipinski’s rules Violations | 2 | 1 | 0 | 0 |
MF= Molecular formula, MW= Molecular weight (g/mol), HBA= Hydrogen bond acceptors, HBD: Hydrogen bond donors, PSA= Polar Surface Area (Å2), LogP= Partition coefficient, ẟ= density (g/cm3), ST= Surface tension, MR= Molar refractivity (cm3), nrotb= No. of rotatable bonds, MV= Molar volume (cm3).
Molinspiration and Osiris Property Explorer simulators were used to predict the bioactivity of compounds against important drug target sites and predict their potential tumorigenic or mutagenic risks, these results are found in Table 3. The chemoinformatic and bioactivity properties together indicate that these structures are of pharmacological interest, mainly at the kinase inhibitor target site in compounds 2a and 2b. The major failure in the drug discovery process is the toxicity and according to the predictions, none of the synthesized triazoles should exhibit mutagenic or tumorigenic impacts, as well as negative reproductive effects. Based on the joint results of the chemoinformatic properties, the most promising compounds to have the desired biological activity are compounds 2a and 2b (Table 2), since they do not present violations of the Lipinsky’s rules and are the ones that present a lower partition coefficient (4.62 and 3.26 respectively). The latter prediction translates in a better availability and distribution of the compound in the organism, and this is supported by the absorption and metabolism data in Table 4.
Table 3 Prediction of bioactivity and toxicity of compounds 1 and 2.
| Compound | NCL | IE | GPCR | KI | RE | T | M |
| 1a | -0.99 | -0.17 | -0.21 | -0.30 | No | No | No |
| 1b | -0.81 | -0.07 | -0.17 | -0.04 | No | No | No |
| 2a | -0.61 | 0.04 | -0.07 | 0.06 | No | No | No |
| 2b | -0.69 | 0.00 | -0.12 | 0.13 | No | No | No |
*NCL= Nuclear receptor ligand, IE= Enzyme inhibitor, GPCR= GPCR ligand, KI= Kinase inhibitor, RE= Reproductive effective, T= Tumorigenic, M= Mutagenic.
Table 4 Data of chemoinformatic properties of ADMET processes.
| ADMET | 1a | 1b | 2a | 2b | |
| Absorption | WS | -4.182 | -3.541 | -3.158 | -3.927 |
| IA (%) | 94.433 | 98.168 | 100 | 97.494 | |
| SP | -2.735 | -2.735 | -2.735 | -2.735 | |
| SGP | No | No | No | No | |
| Distribution | BBBP | No | No | No | No |
| CNSP | -1.719 | -1.705 | -3.422 | -2.453 | |
| Metabolism | CYP3A4 inhibitor | Yes | No | Yes | Yes |
| Excretion | TC | -0.078 | 0.088 | 0.339 | 0.295 |
*WS water solubility (log mol/L), IA intestinal absorption, SP skin permeability (logKp), SGP P-glycoprotein substrate, BBBP blood brain barrier permeability (logBB), CNSP CNS permeability (logPS), TC total clearance (log mL/min/kg), OCT2-s transporters organic cation transporter 2 substrates.
Chemoinformatic properties related to ADMET processes were predicted using the online predictors pkCSM and SwissADME (Table 4). In ADMET, the absorption properties indicate that the compounds can be administered orally according to the Lipinsky rules. Other predicted properties such as LogP data, intestinal absorption (% absorbed), P-glycoprotein substrate, and skin permeability (logKp) suggest that these compounds have a high degree of therapeutic bioavailability. In addition, neither compound appears to permeate the blood-brain barrier due to its hydrophilicity, making it difficult to treat pathologies that affect the SNC, although they could have effects on other systems.
Microbiology
The antifungal in vitro sensibility study was carried out for compounds 1a,b and 2a,b against four filamentous fungi (Trichosporon cutaneum ATCC-28592, Aspergillus fumigatus ATCC-16907, Mucor hiemalis ATCC-8690, and Rhizopus oryzae ATCC-10329), as well as in six yeast specimens of Candida sp. (C. albicans ATCC-10231, C. krusei ATCC-14243, C. utilis ATCC-9226, C. tropicalis ATCC-13803, C. parapsilopsis ATCC-22019, C. glabrata ATCC-34138) following the Clinical Laboratory Standards Institute (CLSI) guidelines for standardized microbiological methods. The antifungal study for yeasts was determined by the microdilution method M27-A3 [24], whereas method M38-A [25] was used for filamentous microorganisms. Both studies were performed against itraconazole as a reference standard. The minimum inhibitory concentration (MIC) values of the standard and compounds 1a,b and 2a,b are expressed in micrograms per milliliter and were determined in 96-well plates using MOPS (3- [N-morpholino] propanesulfonic acid buffered RPMI-1640 medium, Sigma- Aldrich).
The antifungal activities of the evaluated compounds are summarized in Table 5.
Table 5 In vitro antifungal activities of the synthesized compounds (MIC, μg/mL).
| Compound | C. alb | C. uti | C. kru | C. gla | C. par | M. hie | A. fum | T. cut | R. ory |
| 1a | 16 | 16 | 16 | 16 | 16 | 16 | 8 | 16 | 16 |
| 1b | 8 | 16 | 16 | 0.12 | 8 | 16 | 8 | 16 | 16 |
| 2a | 0.5 | 16 | 2 | 16 | 8 | 16 | 16 | 16 | 2 |
| 2b | 8 | 16 | 8 | 16 | 8 | 16 | 8 | 8 | 1 |
| Standarda | 0.03 | 0.25 | 0.25 | 1 | 0.06 | 4 | 1 | 8 | 1 |
Abbreviations: C. alb., Candida albicans; C. uti., Candida utilis; C. kru., Candida krusei; C.gla., Candida glabrata, C. par., Candida parapsilosis; M. hie., Mucor hiemalis; A. fum., Aspergillus fumigatus; T. cut., Trichosporon cutaneum; R. ory., Rhizopus oryzae.
Compound 2a showed good inhibitory activity against C. albicans (MIC= 0.5 μg/mL) although it was at a considerable higher concentration than the standard (MIC= 0.03 μg/mL). On the other hand, 1b had important activity against C. glabrata (MIC= 0.12 μg/mL). Remarkably, MIC of 1b was better than the MIC of itraconazole (1 μg/mL). Another important observation was the activity of compound 2b (MIC= 1 μg/mL) which was comparable to the observed MIC for the standard antifungal drug against Rhizopus oryzae. Compound 1a, however, had no important activity against any of the tested microorganisms.
According to these results, the presence of the COPh group in position 4, as well as the Ph group in position 5 of the triazole heterocycle resulted in an increase of the biological activity against strains of yeasts of C. albicans and C. glabrata. The results of compound 2b showed good activity in the Rhizopus oryzae strain since it has the same MIC as the reference drug (MIC= 1 μg/mL). These results indicate that the exchange of the group -COPh at position 4 by a group -CN favors the antifungal activity of 2b against the filamentous fungus.
These outcomes can also be described by susceptibility parameters of yeast according to the document M27-A3 (Table 6). Generally, C. glabrata and C. albicans showed some susceptibility to the evaluated compounds, meanwhile C. krusei, C. parapsilosis and C. utilis were resistant to all the evaluated compounds according to the breakpoints described in such document.
Table 6 The determination of the sensibility of yeast (according to document M27-A3): Susceptible (S), dose-dependent sensitive (SDD) and resistant (R).
| Compound | C. alb | C. uti | C. kru | C. gla | C. par |
| 1a | R | R | R | R | R |
| 1b | R | R | R | S | R |
| 2a | SDD | R | R | R | R |
| 2b | R | R | R | R | R |
| Standard a | S | SDD | SDD | R | S |
Abbreviations: C. alb., Candida albicans; C. uti., Candida utilis; C. kru., Candida krusei; C.gla., Candida glabrata, C. par., Candida parapsilosis.
aItraconazole. Interpretive criteria: Breakpoints (MIC, μg/mL) = 0.12 [S], 0.25-0.5 [SDD], 1[R].
To better relate the antifungal activity of compounds 1a-b and 2a-b, table 7 shows the MIC ratio in μmol/mL concentrations, noting that compound 1b has a lower MIC (2.55X10⁻⁷ μmol/mL) than the reference substance (itraconazole= 1.41 X10⁻⁶ μmol/mL) in the C. glabrata strain, this is the best result due to the clinical manifestations of this strain and the low amount of antifungal (1b) required to inhibit its growth. Compound 2b presents the lowest MIC in the strains of Trichosporon cutaneum and Rhizopus oryzae, where the concentration required to inhibit the growth of the strains is slightly higher than that of itraconazole (standard), being 2.13X10⁻⁵ μmol/mL for Trichosporon cutaneum and 2.66X10⁻⁶ μmol/mL for Rhizopus oryzae. On the other hand, compound 2a shows better activity inhibiting yeast growth, highlighting the MIC in C. albicans (1.1X10⁻⁶ μmol/mL) and in C. krusei (4.4X10⁻⁶ μmol/mL), although according to the established sensitivity criteria. by CLSI, both strains are resistant to compound 2a. Therefore, we could consider the structures of 1b and 2b as a leading compounds for the synthesis of new analogues and to continue with in vivo and in vitro biological tests.
Table 7 In vitro antifungal activities of the synthesized compounds (MIC, μmol/mL).
| Compound | C. alb | C. uti | C. kru | C. gla | C. par | M. hie | A. fum | T. cut | R. ory |
| 1a | 2.89X10⁻⁵ | 2.89X10⁻⁵ | 2.89X10⁻⁵ | 2.89X10⁻⁵ | 2.89X10⁻⁵ | 2.89X10⁻⁵ | 1.44X10⁻⁵ | 2.89X10⁻⁵ | 2.89X10⁻⁵ |
| 1b | 3.26X10⁻⁵ | 3.26X10⁻⁵ | 3.26X10⁻⁵ | 2.55X10⁻⁷ | 1.63X10⁻⁵ | 3.26X10⁻⁵ | 1.63X10⁻⁵ | 3.26X10⁻⁵ | 3.26X10⁻⁵ |
| 2a | 1.1X10⁻⁶ | 3.5X10⁻⁵ | 4.4X10⁻⁶ | 3.5X10⁻⁵ | 1.76X10⁻⁵ | 3.5X10⁻⁵ | 3.5X10⁻⁵ | 3.5X10⁻⁵ | 4.4X10⁻⁶ |
| 2b | 2.13X10⁻⁵ | 4.26X10⁻⁵ | 2.13X10⁻⁵ | 4.26X10⁻⁵ | 2.13X10⁻⁵ | 4.26X10⁻⁵ | 2.13X10⁻⁵ | 2.13X10⁻⁵ | 2.66X10⁻⁶ |
| Standarda | 4.4X10⁻⁸ | 3.54X10⁻⁷ | 3.54X10⁻⁷ | 1.41X10⁻⁶ | 8.8X10⁻⁸ | 5.66X10⁻⁶ | 1.41X10⁻⁶ | 1.13X10⁻⁵ | 1.41X10⁻⁶ |
Conclusions
In summary, the azide-enolate 1,3-dipolar cycloaddition afforded the synthesis of four 1,2,3-triazole derivatives (1a,b and 2a,b) in good yields. In vitro studies showed that compound 1b is the most efficient antimicrobial agent in yeasts followed by compounds 2a, 2b, and 1a, since the first (1b) was better than itraconazole against C. glabrata. The compound 2b had better activity against filamentous fungi, showing a MIC 1 μg/mL in R. oryzae. Compounds 2b and 2a had better activity against filamentous fungi, being very close to the MIC values of itraconazole. Consequently, these can be considered candidate drugs for future complementary biological studies.

