




 texto en
  Inglés (pdf)
 Artículo en XML
 Referencias del artículo
 Traducción automática
 Enviar artículo por email
 Citado por SciELO
  Similares en
SciELO
Similares en
SciELO 
 Permalink

Introduction
Since 2007, Mexico-U.S. migration has undergone a profound reorganization. Following a surge of undocumented migration that ended with the Great Recession (2007-2009), new unauthorized flows declined, while return migration-driven by deportations and voluntary exits-increased significantly. Several factors contributed to reducing outmigration and fostering returns: the decreasing demand for labor in construction and other U.S. economic sectors; the relative stability of the Mexican economy; the country’s declining birth rate; heightened border and immigration enforcement; and prolonged family separation without prospects for regularization. The balance between new departures and returns resulted in net zero levels of undocumented migration, a situation not seen in decades. This shift prompted scholars to debate the “collapse” of the system of undocumented migration and to describe the 2000s as “the decade when Mexico-U.S. migration changed” (Durand, 2013; Durand y Arias, 2014; Canales y Meza, 2016; Durand y Massey, 2019; Escobar Latapí y Masferrer, 2021; Wassink y Massey, 2022).
Over the same period in which undocumented migration declined, legal temporary migration increased exponentially. H-2 visas, divided into two categories-H-2A for agricultural workers and H-2B for non-agricultural workers-became an increasingly relevant means for Mexicans to cross the border and work in the United States. In 1997, the U.S. Department of State issued 31 717 H-2 visas; in contrast, in 2023 it granted more than 442 000. Not all H-2 visas are issued to Mexicans, as citizens of dozens of countries qualify to apply for these temporary entry and work permits.3 However, Mexicans constitute the overwhelming majority of H-2 visa recipients, particularly in the H-2A agricultural category. In 2023, Mexicans received 91.5 % of H-2A agricultural visas and nearly 64.5 % of H-2B non-agricultural visas, totaling nearly 370 000 H-2 visas. Over the past 12 years (2013-2024), Mexicans have been issued nearly 3 million H-2 visas (U.S. Department of State, 2024). Although the populations of both Mexico and the United States are much larger today, the number of H-2 visas allocated annually to Mexicans rivals those granted during the heyday of the Bracero Program in the late 1950s (García y Griego, 2016).
While not a formal guestworker scheme, the H-2 visas operate like many temporary migrant labor programs (TMLPs) in that they tie temporary admission to short-term contracts. TMLPs aim to satisfy employer demand for migrant labor while preventing integration into the host society (Surak, 2013). Within the Mexico-U.S. migratory system, the proliferation of H-2 visas represents a return to the Bracero Program, the mid-20th-century bilateral guestworker agreement regulating legal migration. Along with the legality and temporariness that characterized Bracero migration, H-2 visas are overwhelmingly issued to men, who are expected to leave their families at home. H-2 visas also restore circulation in Mexico-U.S. migration, as laborers may remigrate as long as a new contract and visa are secured.4
While the H-2 labor force is not large enough to substitute for settled undocumented workers, this temporary migration scheme appears to be generating a form of generational replacement, particularly in agriculture, substituting aging unauthorized laborers with legal ones who play a complementary yet critical role during the harvest (Martin, 2023). For Mexicans, the number of H-2A visas is growing more rapidly than that of H-2B visas. In 2022, the ratio between H-2A and H-2B visa categories for Mexicans was 3:1, compared to 1.6:1 in 2013, suggesting that the H-2 visa TMLP is channeling temporary contract labor toward agriculture and, in that sense, redirecting flows to rural destinations (Hernández-León & Sandoval-Hernández, 2017; Hernández-León et al., 2022).
In this article, we analyze the geography of H-2 visas, adopting a panoramic perspective to illuminate the changing origins and destinations of Mexican temporary agricultural and non-agricultural workers. What is the geography of the H-2 visa program in Mexico and the United States, and how has the supply and demand of H-2 workers evolved alongside the program’s explosive growth? What explains the observed patterns of heightened concentration and emerging dispersion in the origins and destinations of H-2 workers? How does the demand for H-2A and H-2B workers differ across the United States? And how does the geography of H-2 temporary legal migration compare with that of undocumented migration?
Drawing on survey data from the Encuesta sobre Migración en la Frontera Norte de México (Survey of Migration on Mexico’s Northern Border) (EMIF Norte) (El Colegio de la Frontera Norte [EL COLEF] et al., n.d.a, n.d.b) and data from the Office of Foreign Labor Certification of the U.S. Department of Labor (2021a, 2021b), it is shown that in both Mexico and the United States the H-2 visa program has expanded geographically and assumed a national scope, as more states and localities have become areas of supply and demand for these temporary laborers.
However, this article also demonstrates that, in Mexico, the source areas of H-2 temporary sojourning largely coincide with historic and emerging regions of U.S.-bound migration, particularly in central-western and central-southern states, suggesting, from a geographical perspective, continuity between the prior regime of undocumented migration and the expanding system of temporary legal migration. On the demand side, the distinct geographies of the H-2A and H-2B visas were analyzed separately (U.S. Department of Labor, 2021a, 2021b), showing that, with some notable exceptions-California and Washington State for H-2A visas, and Alaska, Colorado, and Oregon for H-2B visas-both visa categories are primarily used by employers in the South and along the Eastern Seaboard of the United States, regions that pioneered the use of this managed migration program.5
Theoretically, this article contributes to the development of the spatial foundations of cumulative causation and allied theories (e.g., social capital) in migration research. These theories and their corresponding empirical studies have shown that migration is not randomly distributed across territory but instead follows spatial patterns shaped by prior migration. Although the H-2 visa program has been described as heralding a new era in Mexico-U.S. migration, governed by a logic distinct from the previous epoch of undocumented sojourning (Wassink & Massey, 2022; Becerril Quintana, 2023; Hernández-León & Sandoval Hernández, 2024), the findings shown here suggest a spatial path dependence linking the two regimes.
Historical context and theoretical framework
The H-2 visa category was formally incorporated into the Immigration and Nationality Act of 1952 and was later divided into two separate visas-the H-2A visa for agricultural workers and the H-2B visa for non-agricultural laborers-under the Immigration Reform and Control Act (IRCA) of 1986 (Griffith et al., 2014).6 By introducing employer sanctions for hiring unauthorized laborers, IRCA increased interest in temporary foreign workers. However, while weak enforcement and a plentiful supply of undocumented laborers from Mexico discouraged firms in the West from relying on this government-regulated source of workers, in the eastern United States employers and labor brokers began to employ Mexican laborers in the harvesting of tobacco, cucumbers, and other crops (Griffith, 2006; Benson, 2012).
By the late 1990s, as the still modest number of H-2 visas began to rise, Mexicans became the main recipients, facilitated by the decision of sugar producers to stop employing Jamaican laborers who had filed a lawsuit over wage theft (Griffith, 2006, 2022a).7 Already in 1997, 96% of H-2A visas and almost 73% of the combined H-2 visa categories were issued to Mexicans (U.S. Department of State, 2024).
As Graph 1 shows, H-2 visas have increased dramatically over the past 25 years. In 1997, the United States issued fewer than 32 000 H-2 visas. By 2007, the number of H-2 visas had grown more than fivefold, reaching 162 752. Although the Great Recession (2007-2009) reduced demand for H-2 workers-particularly H-2B non-agricultural laborers-growth resumed in 2011, when 106 210 H-2 visas were issued. Annual increases continued uninterrupted until 2019, the year before the COVID-19 pandemic, when the combined number of H-2 visas reached 302 424.
In June 2020, the Trump administration temporarily suspended the issuance of H-2B visas. As a result, the number of H-2B visas fell from 97 623 in 2019 to 61 865 in 2020. In contrast, H-2A visas for agricultural workers-declared essential in the context of the pandemic-experienced only a small decline, from 204 801 in 2019 to 197 908 in 2020. After the pandemic, demand for H-2 visa workers rebounded strongly. In 2023, nearly 370 000 H-2 visas were issued to Mexicans alone (U.S. Department of State, 2024).8
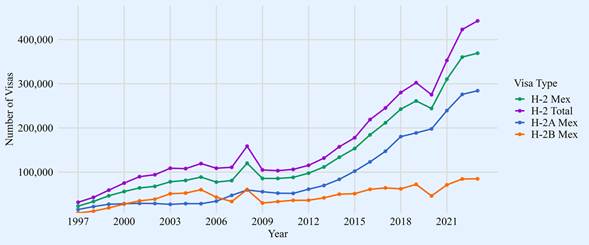
Source: Own elaboration based on U.S. Department of State (various years) (2024).
Graph 1 Number of H-2A and H-2B Visas Issued to Mexicans, 1997-2023
To be clear, the H-2A and H-2B visas constitute two separate non-immigrant categories, each with its own regulations. H-2A visas are used to recruit agricultural laborers, whereas H-2B visas are used to hire non-agricultural workers. Reflecting the influence of growers in the United States, the H-2A visa has no numerical limit. In contrast, the H-2B visa is capped at 66 000 annually, although the actual number of non-agricultural laborers often exceeds this limit by 50% or more in response to employer demand and lobbying.
Over the past decade, the number of Mexicans recruited with H-2B visas alone has surpassed the 66 000 cap several times.9 H-2B visas are currently allocated through a lottery system in two semi-annual installments (U.S. Citizenship and Immigration Services, 2023). The long and contentious history of importing agricultural workers has also left its mark on the H-2A visa. Current regulations require employers and contractors of H-2A workers to cover housing costs and reimburse laborers for transportation expenses. However, these obligations do not apply to companies hiring H-2B workers.10
At the same time, the H-2B and H-2A visas share important features. Both are used to recruit lower-skilled laborers according to seasonal needs, and neither allows the dual intent granted to high-skilled visa categories such as the H-1B, which is used to employ college-educated workers.11 Employers intending to hire H-2 workers must petition the Department of Labor, a process often carried out with the crucial assistance of an extensive brokerage apparatus of recruiters, paperwork processors, transportation companies, lawyers, and labor contractors (Hernández-León, 2021). Sharing this brokerage apparatus allows employers and recruiters to move workers between the H-2A and H-2B categories depending on economic and regulatory conditions. For example, some companies apply for H-2A visas for occupations that are clearly non-agricultural because this enables them to pay lower wages (Franklin et al., 2018; Chadde & Murphy, 2023).
When the Trump administration suspended H-2B applications during the COVID-19 pandemic, recruiters quickly redirected non-agricultural workers to the H-2A category, knowing that agricultural jobs had been declared essential by the federal government (Hernández-León et al., 2022). In addition, many H-2B workers are recruited for para-agricultural jobs, such as tree planting and pruning or seafood processing, activities that take Mexicans to rural areas of the United States (Vidal Fernández et al., 2002; Griffith, 2005). Workers recruited under these visas also share similar forms of “unfreedom,” such as the obligation to remain with the sponsoring employer, the inability to seek work in the open labor market, and penalties associated with abandoning their contracts and overstaying the visa (Moorefield, 2019).12
The H-2 visa system is reshaping U.S.-bound migration by reopening a channel for mass, temporary, and legal sojourning that had been closed to Mexicans for nearly 50 years (Wassink & Massey, 2022). In doing so, the H-2 scheme is reintroducing socio-spatial dynamics typical of many TMLPs. By largely recruiting men and de facto requiring that women and children remain at home, the H-2 program not only fosters a re-masculinization of migration but also reinstates the separation between the social and biological reproduction of labor, which takes place in the sending country, and the production and consumption of labor, which occurs in the destination (Burawoy, 1976).
The H-2 system also restores legal migratory circulation through the pairing of visas and contracts, a characteristic feature of most TMLPs: a visa is issued to a worker who has received a temporary employment contract, the duration of which also defines the validity of the visa. Many Mexican temporary migrants are becoming career H-2 workers by obtaining a contract and a visa each year, spending several months abroad, and returning home at the end of the work season, only to begin the cycle again a few weeks later. In this sense, the H-2 system disciplines Mexican labor migration to the United States by determining when, how, and where cross-border movement occurs, while displacing social dynamics associated with unauthorized sojourning, such as network-driven migration, family formation and reunification, settlement, and integration in the receiving country (Hernández-León, 2021; Hernández-León et al., 2022).
While scholars have mobilized different theories to explain the forces driving Mexico-U.S. mobility, few have explicitly addressed the spatial logic and mechanisms underpinning the geographic dynamics of migration, particularly legal temporary migration, as it either diverges from or continues patterns established under a regime of unauthorized migration (Durand & Massey, 2003; Massey et al., 2010; Becerril Quintana, 2023; Riosmena, 2024). Here, we build on and contribute to theories focused on the continuation of migration to interpret the findings. Researchers have long observed that, as a collective behavior, migration is not randomly dispersed across the territory. On the contrary, migration is noticeably clustered in localities and regions where international mobility has become internalized as part of the common repertoire of household economic strategies and cultural practices, and “stored” in the form of social capital within hometown networks (Zúñiga, 1992).
As cumulative causation theory posits, migration is a path-dependent social process in which prior mobility creates conditions that facilitate future migration. Accordingly, localities and regions with a history of migration are likely to continue this path, except when endogenous circumstances (e.g., declining numbers of potential emigrants) and/or exogenous shocks (e.g., economic downturns or policy changes) produce new conditions. However, as the findings suggest, even when restrictive policies discourage and remove unauthorized migrants, other programs, such as the expanding H-2 scheme, continue to stimulate sojourning from the same sending regions with a long tradition of migration.
On the demand side, a variety of political and economic actors play a critical role in shaping the geography of migration. Employers’ appetite for compliant foreign workers and their ability to tap into migrant social networks and mold them to their own needs also generate self-reinforcing effects, leading not only to the continuation of migration but also to its growth and spatial diffusion.
Business owners do not carry out these tasks alone. Agents working on their behalf (e.g., growers’ associations, farm labor contractors, lawyers, and document processors) act as facilitators and propagators by helping companies navigate bureaucratic requirements, overseeing recruitment, and at times directly managing the day-to-day work of contract laborers (Waldinger & Lichter, 2003; Krissman, 2005; Hernández-León, 2021). The findings demonstrate the enduring effects of these dynamics, as the early adopters of the H-2 program-particularly in the agricultural category, concentrated in the southeastern United States-continue to dominate the geography of this temporary migrant labor program.
Data and Methods
The EMIF Norte Data
To examine the geography of the H-2 visa program, the analysis is divided between origin and destination. To identify the states and municipalities of origin and the basic sociodemographic characteristics of Mexican H-2 workers, it was drawn on the Encuesta sobre Migración en la Frontera Norte de México (EMIF Norte), a survey of cross-border flows designed and implemented several times per year by El Colegio de la Frontera Norte (EL COLEF) in Mexico (EL COLEF et al., n.d.a, n.d.b). EMIF Norte tracks movement across Mexico’s northern border by surveying travelers at various ports of departure and entry, including bus stations and airports.13
This article specifically focuses on two EMIF Norte surveys: Mexican migrants returning from the United States by land and by air between 2009 and 2020. The EMIF Norte survey of migrants returning by air was first implemented in 2009, yielding larger annual samples because, although most H-2 workers travel to and enter the United States by land, many choose to fly upon return.14 Unfortunately, in 2018 and 2019 EMIF Norte did not implement surveys for migrants returning by air, focusing only on those returning through land ports of entry. Nevertheless, it was decided to retain those years in our analysis.
Because EMIF Norte (El Colef et al., n.d.a, n.d.b) did not include an explicit question on the H-2 visa until 2010, for 2009 we relied on three survey questions to profile likely H-2 workers. The first identified individuals who held a temporary work visa for their most recent trip to the United States; the second asked about the type of job performed abroad, which allowed to identify those employed in agriculture and other non-specialized occupations; and the third asked about education level, enabling us to exclude respondents who had completed college. EMIF Norte began explicitly identifying H-2 visa holders in 2010.
Altogether, the 2009-2020 EMIF Norte surveys of Mexican returnees allowed to construct a sample of 4 330 individuals who either fit the H-2 profile (in 2009) or explicitly held an H-2 visa (in 2010 and thereafter).15 For purposes of external validity, also the sociodemographic characteristics of the EMIF Norte sample used was compared with those of H-2 workers surveyed by the Mexican Migration Project (Moorefield, 2019; Pren & González-Araiza, 2019).
The returning H-2 laborers identified through EMIF Norte between 2009 and 2020 (EL COLEF et al., n.d.a, n.d.b) allow us to outline the following sociodemographic profile of contract workers: 327 respondents, or about 8 %, were women, and the remainder were men. The mean age of all respondents was 34.5 years, and the median age was 33 years (for men, the mean and median were 34 and 33 years, respectively; for women, the mean and median were 39 and 36 years, respectively).
Middle school was the modal level of education (46 %), followed by elementary education (32 %) and high school (15 %). Sixty-three percent of respondents were married or cohabiting, while smaller but not negligible proportions were single (18 %) or separated/divorced (17 %). The vast majority reported speaking little or no English; a small proportion reported speaking some English or speaking the language well, which suggests prior stays in the United States. Finally, a plurality of respondents reported living in households with a single wage earner (42 %), while a significant share lived in households with two wage earners (29 %). Notably, 76% stated that their income was the main source of household economic support.
The individuals in our EMIF Norte sample (EL COLEF et al., n.d.a, n.d.b) closely resemble the H-2 workers identified in two analyses using MMP data, in which the vast majority of respondents were men, with an average age of 31 years and seven years of education. These men were mostly married or living in a consensual union, and the majority were household heads (Moorefield, 2019; Pren & González-Araiza, 2019). In short, the sociodemographic characteristics of H-2 workers identified in EMIF Norte match those of H-2 migrants analyzed in other studies. These profiles also align with the recruitment practices of TMLPs: the overwhelming majority of H-2 workers are men, with women representing only a small proportion; laborers are in their prime productive years; most speak little or no English, suggesting low levels of integration at the destination; and they are the main breadwinners, making temporary migration potentially the most important source of household income.
To identify source states and municipalities of origin in Mexico in the EMIF Norte survey (EL COLEF et al., n.d.a, n.d.b), the variable place of birth was used to approximate place of origin, since the preferred variable place of residence had a low number of valid responses. The low response rate for this variable may be related to the fact that EMIF Norte is a survey of people in transit, who may not feel comfortable disclosing their usual place of residence upon returning to Mexico. In contrast, 3 795 respondents (about 88% of the 4 330 individuals identified as H-2 migrants) provided a valid response to the question on place of birth.
However, we recognize that by using place of birth instead of place of residence, we may underestimate the actual origin of some H-2 worker flows. For example, U.S. companies with operations in the Mexican state of Baja California recruit workers from the agro-export regions of that state. Many of these laborers are originally from the southern state of Oaxaca, have migrated internally, and some have settled in Baja California (Zlolniski, 2019; Hernández-León et al., 2022). By identifying them in the sample according to their place of birth, we may overlook Baja California as an immediate source of H-2 temporary worker flows.
Department of Labor (DOL) Labor Certifications Data
To outline the geography of H-2 visa demand in the United States, we use labor certifications approved by the U.S. Department of Labor (DOL). To temporarily hire foreign workers, employers and their agents must petition the DOL, a process that requires firms to demonstrate a seasonal need for workers and to prove that the employment of foreign laborers will not displace local workers or depress wages. The DOL publishes detailed data on completed and partially completed certifications. Our final sample includes 60 352 observations, of which 37 032 are H-2A certifications and 23 320 are H-2B certifications.
We use the state, year, and type of H-2 visa for which workers were certified between 2010 and 2021 to compare state-level variations and changes over the 12-year period. It is worth noting that not all certifications translate into actual visas, as employers may ultimately require fewer workers. We therefore use labor certifications to gauge the broad spatial evolution of H-2 demand and to differentiate the destination geographies of H-2A and H-2B workers. In addition, we use DOL labor certifications to map H-2A agricultural labor demand in detail by drawing on the addresses of employers who petitioned for agricultural workers in 2021, thereby identifying H-2A migration corridors and clusters of demand across the country.16
Moran’s Index of Spatial Autocorrelation
A key goal of this study is to determine the geographic origins and destinations of H-2 visa workers. To this end, we applied Moran’s Index of Spatial Autocorrelation (Moran’s I) to municipalities of origin in Mexico and places of destination in the United States in order to assess whether H-2 workers are clustered in specific geographic areas. Moran’s I is a statistical measure of spatial autocorrelation that indicates the degree to which a set of spatial data points is clustered, dispersed, or randomly distributed. The formula for Moran’s I is given by:
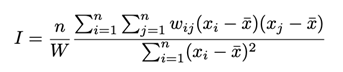
Where:
n = total number of spatial units (e.g., municipalities)
x i = value of the variable of interest at location i
x̄ = mean of the variable of interest
w ij = spatial weight between units i and j (defines the spatial relationship between the units, such as contiguity or distance-based weights)
W = sum of all spatial weights, i.e., W= ∑ᵢ ∑ⱼ wᵢⱼ
Values range from -1 to 1, where -1 indicates perfect negative spatial autocorrelation (dissimilar values clustered together), 1 indicates perfect positive spatial autocorrelation (similar values clustered together), and values close to 0 indicate a random spatial pattern.
Analysis
The Geography of Supply: The Regional, State, and Municipal Origins of Mexican H-2 Workers
The analysis of the EMIF Norte sample (EL COLEF et al., n.d.a; n.d.b) of returning migrants reveals that H-2 labor migration flows are highly concentrated in Mexico by region, state, and municipality. As Map 1 shows, 10 of Mexico’s 32 states account for 63% of all respondents identified as H-2 laborers: Guanajuato (n= 628), Michoacán (n= 421), Puebla (n= 290), Jalisco (n= 276), Veracruz (n= 263), Hidalgo (n= 202), State of Mexico (n= 198), Oaxaca (n= 163), Mexico City (n= 144), and Guerrero (n= 141). These 10 states are located in three of the country’s four migratory regions. Guanajuato, Michoacán, and Jalisco (nearly 31% of the sample) belong to the historic migration region, which includes the states of central-western Mexico. Puebla, Hidalgo, State of Mexico, Oaxaca, Mexico City, and Guerrero (26% of the sample) form part of the south-central migratory region, while Veracruz (6% of the sample) is in the southeastern migration region.
Overall, the geography of H-2 temporary labor migration aligns with the spatial dynamics of Mexico-U.S. flows over the past 40 years, reflecting the enduring presence of the historic migration region, the growing participation of the south-central region, and the recent rise of Veracruz within the otherwise less salient southeastern migration region (Durand & Massey, 2003; Massey et al., 2010).
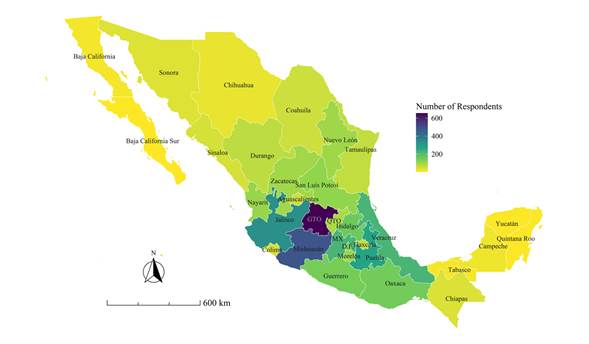
Source: Own elaboration based on EMIF Norte (EL COLEF et al. n.d.a, n.d.b).
Map 1 States of Origin of H-2 Visa Workers, 2009-2020
Interestingly, Map 1 also shows some dispersion of H-2 labor migration throughout Mexico, with legal temporary labor flows present in every state of the country. While still highly concentrated in the central-western and south-central regions, this temporary labor program has begun to take on a national character, extending into states and localities with minimal histories of U.S.-bound migration. For example, in the EMIF Norte survey (EL COLEF et al., n.d.a, n.d.b), the state of Chiapas (n= 50), on the border with Guatemala, ranks higher in the number of observations than several northern states (Sonora, n= 36; Chihuahua, n= 25) and almost as high as the northwestern state of Sinaloa (n= 51), which has a history of H-2 labor recruitment.
This dual pattern of concentration and dispersion is confirmed by a complementary analysis of the top 100 municipalities with H-2 workers, which together represent 47% of the 3 911 valid observations from EMIF Norte. Corroborating the pattern of concentration, Guanajuato, Michoacán, Jalisco, and Zacatecas alone account for 40 of the top 100 municipalities with H-2 workers.17 At the same time, underscoring the extent of H-2 migration throughout Mexico, 25 of the country’s 32 states are represented among the 100 most important municipalities of origin.
The results of the Moran’s I test suggest that the origins of H-2 workers are highly clustered in specific regions rather than randomly distributed. Table 1 reports the Moran’s I statistics, expectations, variances, Z-scores, and p-values for the spatial autocorrelation of Mexican municipalities serving as places of origin for H-2 migrants between 2009 and 2020. The Moran’s I values are consistently high (ranging from 0.993 to 0.999), indicating extremely strong positive spatial autocorrelation during this period. The Z-scores decrease slightly over time, suggesting that the strength of clustering may have become somewhat less pronounced. This trend could indicate a shift in migration patterns, with more diverse or geographically dispersed municipalities sending H-2 migrants in recent years. Nevertheless, even with lower Z-scores, the spatial autocorrelation remains statistically significant.18 Finally, the extremely low p-values (mostly 2.20E-16) confirm the statistical significance of the observed clustering patterns.
Table 1 Moran’s I Statistics for Places of Origin of H-2 Migrants
| Year | Observations | Moran’s I Statistic | Expectation | Variance | Z-score | P-value |
|---|---|---|---|---|---|---|
| 2009 | 564 | 0.993 | -0.0037 | 0.0069 | 11.996 | 2.20E-16 |
| 2010 | 694 | 0.999 | -0.003 | 0.0059 | 12.974 | 2.20E-16 |
| 2011 | 627 | 0.999 | -0.0032 | 0.0062 | 12.725 | 2.20E-16 |
| 2012 | 457 | 0.999 | -0.0038 | 0.0049 | 14.341 | 2.20E-16 |
| 2013 | 316 | 0.999 | -0.005 | 0.008 | 11.188 | 2.20E-16 |
| 2014 | 254 | 0.999 | -0.007 | 0.0123 | 9.064 | 2.20E-16 |
| 2015 | 264 | 0.999 | -0.0073 | 0.014 | 8.5 | 2.20E-16 |
| 2016 | 262 | 0.999 | -0.0078 | 0.0137 | 8.58 | 2.20E-16 |
| 2017 | 169 | 0.999 | -0.008 | 0.0126 | 8.951 | 2.20E-16 |
| 2018 | 36 | 0.999 | -0.03 | 0.033 | 5.65 | 7.71E-09 |
| 2019 | 48 | 0.999 | -0.024 | 0.026 | 6.35 | 1.06E-10 |
| 2020 | 104 | 0.999 | -0.016 | 0.026 | 6.2281 | 2.36E-10 |
Source: Own elaboration based on EMIF Norte (EL COLEF, et al. n.d.a; n.d.b).
Overall, the Moran’s I results for places of origin also corroborate what is visually apparent in Map 1-namely, that H-2 workers identified in EMIF Norte (EL COLEF et al., n.d.a, n.d.b) are highly clustered in specific regions across Mexico rather than randomly distributed. States such as Michoacán, Jalisco, and Guanajuato, in particular, display many localities with high concentrations of H-2 laborers. In contrast, there appear to be fewer clusters in northern and southeastern Mexico. The fact that most H-2 workers hail from the central-western states within the historic migration region suggests spatial continuity between the earlier regime of undocumented labor migration and the expanding temporary labor program.
The Geography of Demand: Mexican H-2 Workers in the United States
We now turn to the geographic distribution of H-2 workers in the United States. To outline the changing geography of the H-2 program and the participation of Mexican labor within it, we analyze labor certifications approved and partially approved by the Department of Labor in 2010 and 2021. As explained above, not every certification translates into an equal number of visas (and corresponding contracts), since employers may interrupt the process or ultimately require fewer workers. In this sense, our reference to states and localities as H-2 destinations should be understood as an approximation of the actual geography of H-2 employment.
Furthermore, labor certifications do not include information on the nationality of prospective workers. However, given that Mexicans consistently receive more than 90% of H-2A visas, we are confident that the distribution of labor certifications reflects the nationality of the requested workers. By contrast, Mexicans account for about 70% of H-2B visas, which are used to hire temporary workers from a more diverse set of nationalities and occupations.19 With this methodological caveat in mind, we analyze the geography of H-2A and H-2B employment separately.
The Geography of the H-2A (agricultural) Visa
In the United States, the geography of H-2A worker demand exhibits both continuity and change. Regionally, the Southeast remains the most important destination for H-2A laborers. As noted earlier, in the late 1990s employers in this region turned to Mexicans to replace West Indian laborers they had employed since the inception of the program. Alongside the exponential growth in labor certifications, the region also experienced internal shifts during the period under analysis. Specifically, Florida and Georgia displaced North Carolina and Louisiana as the two leading petitioners of H-2A workers regionally and nationally. Between 2010 and 2021, the number of labor certifications approved by the DOL increased by nearly 900% in Florida and by more than 600% in Georgia (see Table 2).
The reasons for this change cannot be reduced to a single factor. The closure of the undocumented labor migration pipeline, the shift of farm labor contractors toward recruiting H-2A workers instead of unauthorized laborers, and the continued exodus of migrants and locals from agriculture to less physically demanding jobs in urban areas are among the forces driving the rising demand for foreign agricultural workers and the exponential increase in H-2A demand in states with large agricultural sectors, such as Florida and Georgia (Benson, 2012; Griffith, 2022a, 2022b; Martin, 2023). Despite intra-regional and national shifts (see below), the Southeast has remained the leading region of the United States requesting H-2A labor certifications.
Table 2 Top Ten States Receiving Labor Certifications to Hire H-2A Workers by Their Ranking in 2021 and Percentage Change since 2010
| 2010 | 2021 | Percent increase | |
|---|---|---|---|
| Florida | 4 542 | 44 706 | 884 % |
| Georgia | 4 874 | 35 205 | 622 % |
| California | 2 839 | 32 333 | 1 039 % |
| Washington | 4 248 | 28 727 | 576 % |
| North Carolina | 18 299 | 23 479 | 28 % |
| Louisiana | 6 959 | 12 473 | 79 % |
| Michigan | 277 | 11 376 | 4 007 % |
| Arizona | 4 712 | 10 842 | 130 % |
| New York | 3 944 | 9 192 | 133 % |
| Texas | 2 223 | 8 553 | 285 % |
Source: Own elaboration based on U.S. Department of Labor (2021a).
Between 2010 and 2021, California emerged as one of the leading destinations for H-2A workers, becoming the third state in the country with the most certifications and experiencing an increase of more than 1 000% (see Table 2). With the largest agricultural industry in the United States, California’s turn to the H-2A program is significant given that growers in the state have long relied on a mix of migrant social networks and farm labor contractors to supply their workforce.
With the decline of undocumented labor migration, agribusiness in the Golden State has begun petitioning for large numbers of H-2A workers, using this labor source for multiple purposes. For example, some firms use the H-2A program to import workers already employed in subsidiaries in neighboring Baja California, thereby creating a system of binational labor mobility and control. Other companies recruit H-2A laborers not only to supplement their current undocumented workforce but also to counter resistance and organizing efforts by local unauthorized workers who, over time, become more familiar with local employment opportunities and switch jobs to increase wages (Izcara-Palacios, 2014; Hagan et al., 2015; Zlolniski, 2019; Hernández-León et al., 2022)
Also in the West, Washington State has consolidated its position as a leading petitioner of foreign agricultural workers, rising to fourth place nationally and surpassing historic destinations of H-2A laborers such as North Carolina and Louisiana. Agribusinesses in Washington have long employed H-2A workers in the harvest of apples and other fruits. Here too, employers have relied on H-2A laborers to counter organizing efforts by resident undocumented immigrants (Bacon, 2021). The period under analysis also shows the meteoric rise of Michigan in the demand for H-2A workers, with a 4 000% increase-admittedly from a small baseline-making this state not only the top recipient of certifications in the Midwest but also a more important destination than Arizona, New York, and Texas at the national level.
At the same time, the substantial growth in the number of both DOL certifications and actual visas between 2010 and 2021 indicates that, in addition to the noted regional and state concentrations, there is now a widespread H-2A worker presence across the United States.20 Map 2, which uses the work addresses filed in labor certification applications in 2021, illustrates the national expansion of this temporary migrant labor program. The map highlights both the concentration and dispersion of H-2A demand. On the one hand, employers in every state of the country received approval to import at least a few hundred H-2A workers. The numerous small circles scattered across U.S. territory also indirectly indicate the fragmentation of H-2A demand, an issue to which we return in the conclusion. On the other hand, there are notable clusters and corridors of H-2A employment that cut across state lines.
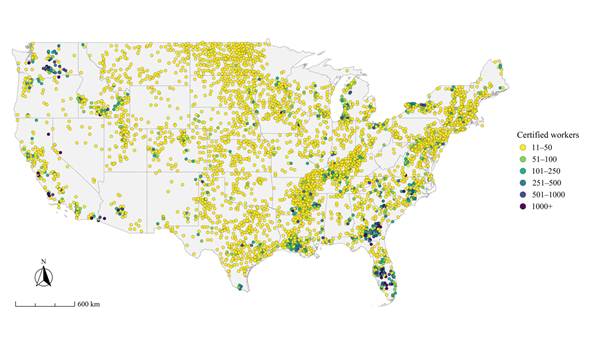
Source: Own elaboration based on U.S. Department of Labor (2021a).
Map 2 H-2A Certifications by Employment Address, 2021
Four large cluster-corridors were identified, which align with the list of the top ten states receiving labor certifications in 2021. The first cluster-corridor is in the Southeast, which has historically led the recruitment of H-2A workers; it extends from the agricultural counties of south-central Florida through southern Georgia and into North Carolina. A second, less dense corridor follows part of the Mississippi River Delta, from Louisiana to the Arkansas-Mississippi-Tennessee state lines, culminating in western Kentucky and southern Ohio. In the West, two additional cluster-corridors emerge: one beginning in Arizona’s Yuma Valley, continuing through California’s Coachella Valley, bifurcating between San Diego, Ventura, and other coastal counties and the agricultural Central Valley, and dispersing into the wine-growing areas north of San Francisco; and another in central Washington State, which forms the final cluster-corridor of H-2A demand, with minimal spillover into some localities in northern Oregon.
Table 3 reports the Moran’s I statistics, expectations, variances, Z-scores, and p-values for the spatial autocorrelation of U.S. localities serving as destinations for migrants participating in the H-2A program between 2010 and 2021. The results show that all Moran’s I values are very close to 1, indicating strong positive spatial autocorrelation and confirming that, from 2010 to 2021, localities with H-2A workers were highly clustered. The Z-scores are extremely high (ranging from 44.753 to 78.250), providing evidence of strong clustering and suggesting that the observed patterns are significantly different from what would be expected under a random distribution. The p-values are also extremely low (2.2E-16), further confirming that the clustering is statistically significant rather than the result of chance. It is also worth noting that during the period under analysis, the number of companies petitioning for H-2A workers more than doubled, increasing from 2 292 in 2010 to 4 765 in 2021.
Table 3 Moran’s I Statistics for H-2A Certifications by Year
| Year | Observations | Moran’s I Statistic | Expectation | Variance | Z-Score | P-value |
|---|---|---|---|---|---|---|
| 2010 | 2 292 | 0.999 | -0.0004 | 0.0004 | 47.961 | 2.20E-16 |
| 2011 | 2 234 | 0.999 | -0.0004 | 0.0005 | 44.753 | 2.20E-16 |
| 2012 | 2 306 | 0.999 | -0.0004 | 0.0004 | 46.112 | 2.20E-16 |
| 2013 | 2 171 | 0.999 | -0.0004 | 0.0004 | 74.925 | 2.20E-16 |
| 2014 | 2 384 | 0.999 | -0.0004 | 0.0001 | 78.25 | 2.20E-16 |
| 2015 | 2 647 | 0.998 | -0.0003 | 0.0002 | 73.8 | 2.20E-16 |
| 2016 | 2 924 | 0.999 | -0.0003 | 0.0002 | 75.278 | 2.20E-16 |
| 2017 | 3 268 | 0.995 | -0.0003 | 0.0002 | 65.223 | 2.20E-16 |
| 2018 | 3 685 | 0.997 | -0.0003 | 0.0002 | 62.819 | 2.20E-16 |
| 2019 | 4 041 | 0.997 | -0.0002 | 0.00025 | 63.05 | 2.20E-16 |
| 2020 | 4 315 | 0.998 | -0.0002 | 0.0004 | 50.45 | 2.20E-16 |
| 2021 | 4 765 | 0.995 | -0.0002 | 0.0003 | 52.16 | 2.20E-16 |
Source: Own elaboration based on U.S. Department of Labor (2021a).
The Geography of the H-2B (non-agricultural) Visa
Demand for H-2B workers is regionally concentrated in the Gulf of Mexico states, the Southeast, the Mid-Atlantic, and the broader Eastern Seaboard, giving the H-2B program a distinctly coastal profile (see Map 3) and suggesting some overlap with the geography of the H-2A program.21 It is plausible that, as the counterpart to the H-2A visa-used by agribusiness in these regions for decades-employers are more familiar with the H-2B program and the diversity of occupations it covers compared to other parts of the country. Firms in the South and the Mid-Atlantic have long employed H-2B temporary workers from Mexico, Central America, and the Caribbean to staff seafood processing facilities, landscaping and tree-planting crews, and to supplement workforces in the Gulf-based oil industry (Vidal Fernández et al., 2002; Donato et al., 2005; Griffith, 2005).
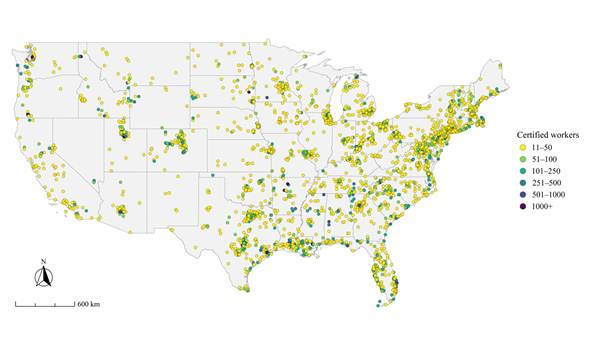
Source: Own elaboration based on U.S. Department of Labor (2021b).
Map 3 H-2B Certifications by Employment Address, 2021
For decades, Texas has been the most important destination for H-2B laborers, many of whom are employed as landscapers (Plascencia & Zlolniski, 2024). In 2021, Texas retained its dominant position in the demand for H-2B certifications, followed by Florida, Alaska, Louisiana, and Colorado, with Pennsylvania, North Carolina, Ohio, Oregon, and Michigan completing the list of the top ten states (see Table 4). Together, these ten states account for nearly 50 % of all H-2B positions certified nationally by the DOL (U.S. Department of Labor, 2021b).
Between 2010 and 2021, employers in states as diverse as Alaska, Ohio, Oregon, and Tennessee shifted from petitioning a few hundred certifications to thousands. Continuity and change in the demand for H-2B positions are likely driven in part by industry-specific dynamics in these states. For example, Alaska’s rise in the rankings-from 325 approved positions in 2010 to 12 804 certified positions in 2021, an increase of 3 840 %-was driven by a handful of seafood processing companies.22 Together, these firms accounted for 73 % of the positions certified in the state (U.S. Department of Labor, 2021b).
Table 4 Top Ten States Receiving Labor Certifications to Hire H-2B Workers by Their Ranking in 2021 and Percentage Change since 2010
| 2010 | 2021 | Percent increase | |
|---|---|---|---|
| Texas | 12 186 | 19 064 | 56 |
| Florida | 6 484 | 14 127 | 118 |
| Alaska | 325 | 12 804 | 3 840 |
| Louisiana | 3 672 | 9 493 | 158 |
| Colorado | 4 351 | 7 868 | 81 |
| Pennsylvania | 3 089 | 5 927 | 92 |
| North Carolina | 2 923 | 5 856 | 100 |
| Oregon | 910 | 5 144 | 465 |
| Ohio | 931 | 4 818 | 418 |
| Michigan | 2 300 | 4 875 | 112 |
Source: Own elaboration based on U.S. Department of Labor (2021b).
In 2021, several states across these overlapping regions had similar numbers of certified positions. For instance, Arkansas, Mississippi, Alabama, Tennessee, and Georgia each had between 3 000 and 4 000 certified positions, while Missouri, Ohio, Michigan, New York, South Carolina, Virginia, and Maryland had between 4 000 and 5 000 approved H-2B positions. In contrast to the East, H-2B demand is relatively low in the West, where, apart from Alaska, Colorado, and increasingly Oregon, companies make limited use of the program (see Map 3). Still, like its H-2A counterpart-albeit on a smaller scale-the H-2B program continued to expand nationwide between 2010 and 2021, despite the lingering effects of the Great Recession and the COVID-19 pandemic, which depressed demand and prompted temporary bans on the importation of foreign workers.
In the case of H-2B workers, the Moran’s I values are also very high (ranging from 0.9237 to 0.998), indicating strong positive spatial autocorrelation. This confirms that locations with H-2B workers are highly clustered. The Z-scores are likewise very high (ranging from 20.78 to 36.604), suggesting a significant deviation from randomness and providing further evidence of strong clustering. Finally, the p-values are extremely low (2.2e-16), reinforcing the conclusion that the observed clustering is statistically significant. The number of companies hiring H-2B workers also increased substantially during the study period, rising from 1 521 in 2010 to 2 705 in 2021 (See table 5).
Table 5 Moran’s I Statistics for H-2B Certifications by Year
| Year | Observations | Moran’s I Statistic | Expectation | Variance | Z-score | P-value |
|---|---|---|---|---|---|---|
| 2010 | 1 521 | 0.986 | -0.0006 | 0.0012 | 28.142 | 2.20E-16 |
| 2011 | 1 608 | 0.994 | -0.0006 | 0.0012 | 28.9 | 2.20E-16 |
| 2012 | 1 543 | 0.991 | -0.0006 | 0.0012 | 28 | 2.20E-16 |
| 2013 | 1 719 | 0.997 | -0.0006 | 0.0011 | 29.895 | 2.20E-16 |
| 2014 | 1 890 | 0.996 | -0.0005 | 0.001 | 31.237 | 2.20E-16 |
| 2015 | 788 | 0.998 | -0.0013 | 0.0023 | 20.78 | 2.20E-16 |
| 2016 | 2 238 | 0.99 | -0.0004 | 0.0008 | 33.898 | 2.20E-16 |
| 2017 | 1 620 | 0.994 | -0.0006 | 0.0012 | 28.788 | 2.20E-16 |
| 2018 | 2 370 | 0.975 | -0.0004 | 0.0008 | 35.042 | 2.20E-16 |
| 2019 | 2 605 | 0.984 | -0.0004 | 0.0007 | 36.303 | 2.20E-16 |
| 2020 | 2 713 | 0.9237 | -0.0004 | 0.0007 | 34.852 | 2.20E-16 |
| 2021 | 2 705 | 0.958 | -0.0004 | 0.0007 | 36.604 | 2.20E-16 |
Source: Own elaboration based on U.S. Department of Labor (2021b).
Discussion and conclusion
The growth of the H-2 temporary labor program, combined with the decline of mass undocumented flows from Mexico, is heralding a “new system of migration” to the United States, organized under a logic of legality, temporariness, circulation, and family separation (Wassink & Massey, 2022; Hernández-León & Sandoval Hernández, 2024). In Fiscal Year 2024 alone, Mexicans received nearly 376 000 H-2 visas (U.S. Department of State, 2024), a figure that rivals the annual number of unauthorized border crossers during the heyday of the Great Migration from Mexico to the United States (1995-2005) (Hernández-León & Zúñiga, 2016).
Despite this transformation in the migratory regime, we find that in Mexico the new system has not reshaped the geography of emigration. In other words, the H-2 program draws workers from the same regions, states, and municipalities that became the main source areas of undocumented migration at the end of the 20th century. Our analysis of EMIF Norte (EL COLEF et al., n.d.a, n.d.b) data shows that in the critical period when the H-2 program expanded rapidly (2009-2020), temporary laborers predominantly came from the historic migration region in central-western Mexico, followed by the south-central region-areas of the country where undocumented labor mobility was firmly established. However, states and municipalities in the northern and southeastern regions, from Baja California to Chiapas, also registered H-2 flows, suggesting that this TMLP, once a marginal component of Mexico-U.S. migration, now has a truly national reach.23
In the United States, evidence from H-2A and H-2B labor certifications (2010-2021) shows that the two visa categories have distinct geographic configurations. During the period under examination, the H-2A (agricultural) visa evolved from a regional guestworker program, with demand largely concentrated in southeastern states, into a TMLP of national scope. Nevertheless, the Southeast-the region where the H-2 program originated-continued to attract the largest number of agricultural workers. At the same time, western states with sizeable agricultural sectors, such as California, Washington, and Arizona, had emerged by 2021 as important destinations for H-2A laborers.
Demand for agricultural guestworkers appears to be concentrated not only in specific states and localities but also in employment corridors that cut across multiple states. In addition to these patterns of concentration, the mapping of labor certifications reveals significant dispersion, with thousands of employers of H-2A workers scattered across the United States. To identify the actors and mechanisms that generate these varied patterns of spatial concentration and dispersion, future analyses should differentiate among the types of employers requesting H-2A workers, including grower associations, farm labor contractors, and small farmers, as well as the types of crops involved.
The geography of H-2B non-agricultural labor demand continued to have Texas as its epicenter, while other states made significant gains during the period under analysis. The most notable case among these newcomers is Alaska, which increased from a few hundred H-2B labor certifications in 2010 to nearly 13 000 in 2021. In addition to being a smaller program, the H-2B category is markedly concentrated in the Gulf of Mexico states and along the Eastern Seaboard, with some growth in the Great Lakes region. In contrast to the H-2A agricultural counterpart, employers in West Coast states have not shown strong interest in H-2B temporary laborers.
Overall, the analysis of the origins and destinations of H-2 workers suggests strong spatial path dependence and geographic continuity between the regime of undocumented sojourning and the system of temporary legal migration. The findings confirm the tenets of path dependence theories, which hold that once established, migration reshapes social institutions and reorients individual and collective dispositions, thereby creating conditions for future migration. This is most evident at the origin, where states and localities specializing in outmigration have assumed a similar role under the expanding H-2 program.
At the destination, geographic path dependence also appears to be at play, with employers in regions and states long familiar with the H-2 program continuing to drive demand for contract workers. At the same time, we also find evidence of the gradual territorial expansion of the H-2 program, with new states and municipalities joining the supply of and demand for temporary legal workers, turning this labor program into a system of national scope in both countries.

