


 nueva página del texto (beta)
 Inglés (pdf)
 Artículo en XML
 Referencias del artículo
 Enviar artículo por email
 Citado por SciELO
  Similares en
SciELO
Similares en
SciELO 
 Permalink
1. Introduction
In Ecuador, oil production constitutes one of the main economic sources (Ordoñez Moran & Nuñez Lapo, 2019). However, after several years of production, the energy of some fields has decreased (Rivadeneira & Baby, 2004). To recover this energy, enhanced recovery (EOR) methods can be used, such as CO2 injection.
The interaction between CO2 and oil in the reservoir leads to a phenomenon known as miscibility. This means that CO2 dissolves in the oil, resulting in a reduction in the viscosity of the oil, making it easier for the oil to move towards producing wells (Abdullah & Hasan, 2021). Miscibility in this context implies that CO2 and oil form a homogeneous phase, which maximizes the contact between both fluids and increases recovery efficiency (Verma, 2015 This miscibility can be generated by first contact or by multiple contacts (Castro, 2013).
The oil fields in Ecuador have a production history of more than 50 years, which classifies them mostly as mature fields (Chipantashi-Aneloa, 2021). The implementation of the CO2 injection technique as an Enhanced Oil Recovery (EOR) method is essential in these fields since it contributes to maintaining oil production and recovering reserves that are still exploitable (Farajzadeh et al., 2022). Furthermore, this technique allows a significant amount of carbon dioxide to be stored in the deposit, reducing its release into the atmosphere, and mitigating the effects of environmental pollution caused by this gas (Godec et al., 2011).
1.1. Generalities of CO2 injection
CO2 is injected into the oil reservoir to provide energy. CO2 dissolves in the oil, reducing its viscosity and moving to the producing wells. Currently, improved hydrocarbon recovery is the most viable economic option in the CO2 capture and storage process because it increases production and improves the cost and income balance in said processes (Alquicira Balderas, 2018).
When CO2 is injected into the reservoir, a physical and chemical interaction between the reservoir rock and the existing hydrocarbon fluid arises (Moghadasi et al., 2018). These interactions explain the mechanism of recovery+ of the remaining oil. These mechanisms are classified into:
Increase in oil volume.
Decrease in the density of oil and water.
Decrease in oil viscosity.
Decrease in interfacial tension between rock and fluid.
A detailed description of the methods used in this research, as well as the criteria on which their choice was based, is now provided.
1.2. Continuous CO 2 injection method
In this method, CO2 is injected continuously until the values of the produced gas-oil ratio reach levels so high that the project is not financially viable (Santamaría, 2018). The multi-contact process, condensation and combination mechanisms are used to generate miscibility between gas and oil (Safaei et al., 2023).
1.3. Alternate water and CO 2 injection method (WAG)
WAG injection is a method that is applied in almost all gas injection processes, it prevents the formation of CO2 channels through the oil phase, increasing the macroscopic displacement efficiency (Santamaría, 2018). Figure 1 presents several gas injection techniques, the total volume of gas to be injected and the water-gas relationship and frequency; each of these variables must be calculated for the WAG process.
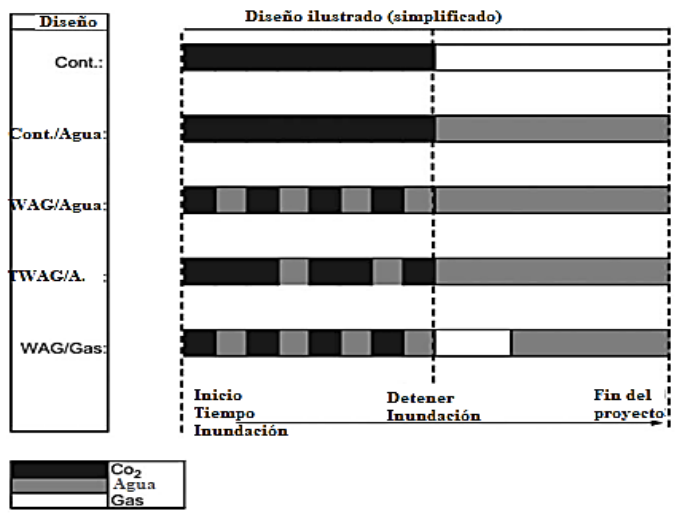
Furthermore, WAG injection is controlled by Valladares and Steven (2018):
1.4. Selection mechanisms for each method
The selection criteria for CO2 injection methods are not only determined by one or two reservoir characteristics, but rather the best approach is determined based on viscosity, permeability, API, reservoir temperature and reservoir depth (Ameli et al., 2023).
Table 1 and Table 2 present the appropriate selection standards for continuous injection and WAG projects respectively.
Table 1 Selection criteria according to the properties of the deposit, (Ameli et al., 2023)
| Property | Characteristic |
|---|---|
| Reservoir depth | Deeper wells imply higher drilling costs and operating expenses because the reservoir temperature increases with depth. |
| Temperature | Critical temperature of CO2 is 31°C, where CO2 operates as vapor under these conditions. At temperatures above this level, the density of CO2 rises with pressure. |
| Pressure | Various degrees of miscibility can be achieved at intermediate and high pressure. |
| Porosity and permeability | Some reservoirs have varying levels of porosity and commonly range between 11% and 30%. |
Table 2 Selection criteria for WAG projects, (Khoshsima et al., 2023).
| Parameters | Values | |
|---|---|---|
| Reservoir | Thickness (ft) | <100 |
| Temperature (°F) | - | |
| Average permeability (MD) | <100 | |
| Previous production method | Water injection | |
| Type of training | - | |
| Depth | - | |
| Fluid | API | 29-45 |
| Viscosity (cP) | <2 | |
| Viscosity ratio | sep-30 |
2. Methodology
The information required to perform the simulation in static and dynamic conditions is obtained from various data sources. In relation to information processing, the GMSH simulator will be implemented to generate the mesh and the CMG software to define the model under dynamic conditions and execute the CO2 injection methods. In addition, the GEM, WinProp and Results sections will be implemented (CMG GEM, n.d.).
Next, we proceed to describe in detail the process carried out in each of the sections used.
2.1. Static reservoir modeling
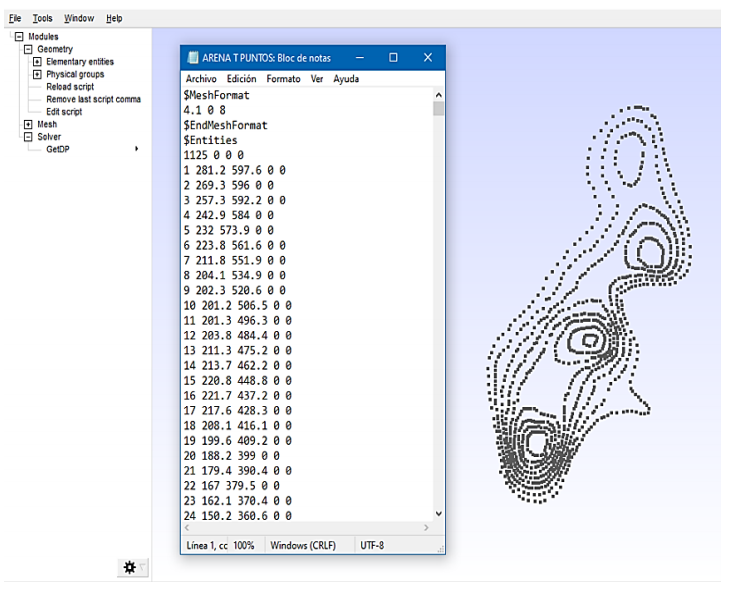
To generate the geological unit, a portion of the sand T under study is digitized, taking into consideration the location of the wells it contains. This process is carried out using the GMSH software. It is important to highlight that, to carry out this procedure, you must have an isopach map of the reservoir to be simulated.
After importing the image into GMSH, the "points" tool is used to generate values in a Cartesian plane for both "x" and "y". In this way, points are added to build all the layers immersed in the sand (Figure 2).
And for the characterization of the reservoir fluids, the chromatography analysis of the fluids coming from the sand under study was implemented, using the WinProp-CMG (Figure 3).
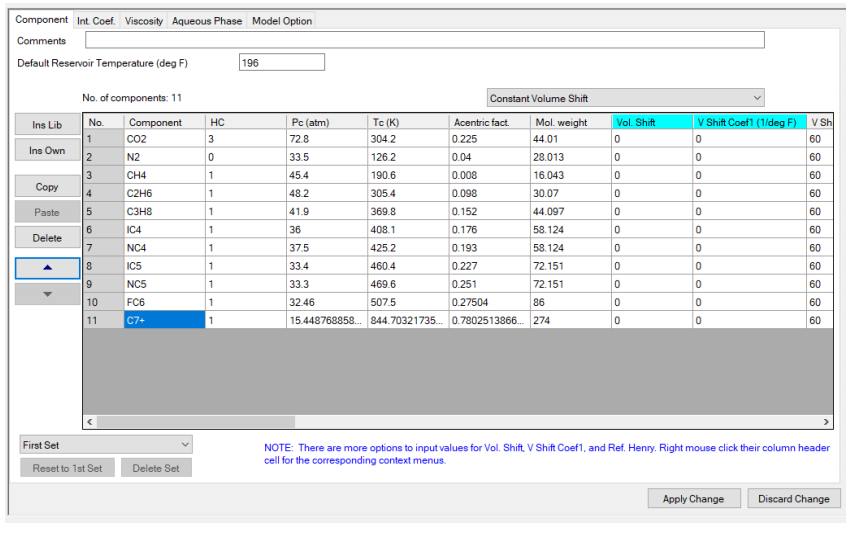
After having estimated the necessary calculations and laboratory tests of the reservoir fluid composition in the WinProp section, it is required to export the PVT model.
-Initialization of the CMG simulator.
When starting the CMG program, the GEM option is chosen, a widely recognized tool worldwide for modeling compositional, chemical, and unconventional reservoirs. Where the system of units is selected and the start date of the model is set.
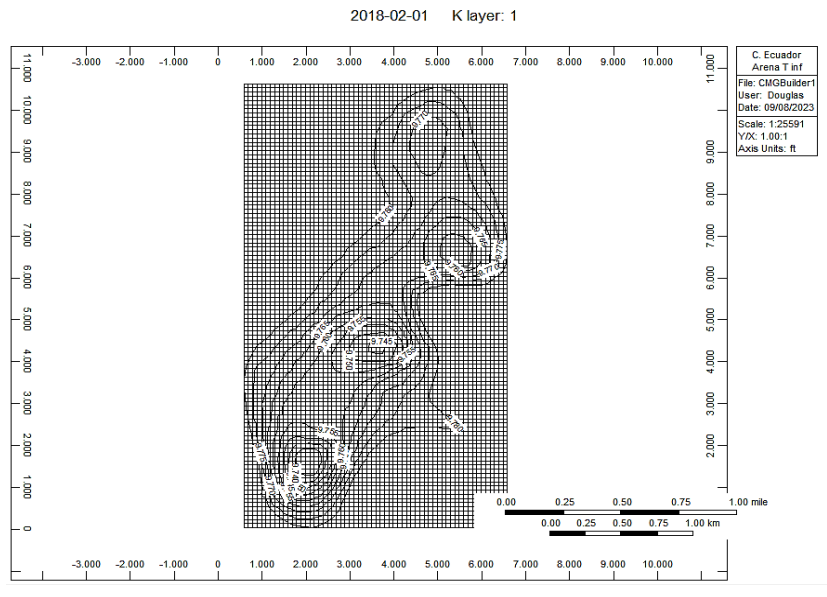
-Description of the reservoir, creation of the grid.
To create the reservoir mesh (Figure 4), the mesh was configured in spatial units "i, j, k", these being 60, 106 and 8, respectively. Each cell "i, j" has a length of 100 feet. It is worth mentioning that the top of the formation is 9,735 feet deep and has a thickness of 50 feet.
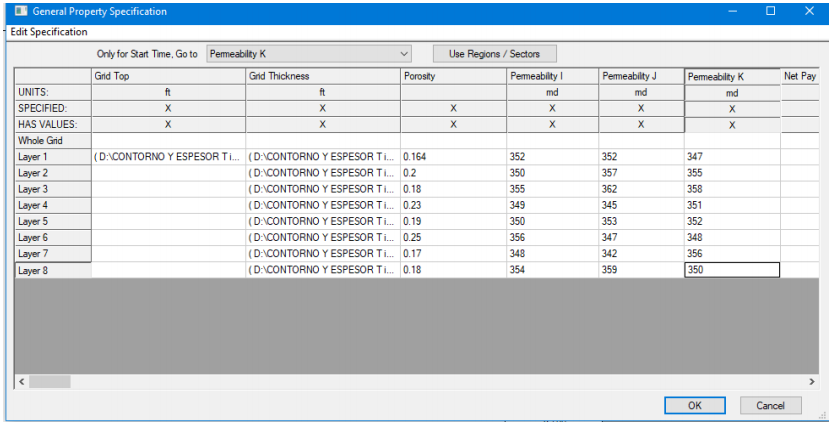
-Rock properties.
The general characteristics of the rock are detailed in the following data sheet (Figure 5).
-Rock-fluid interaction.
In this section the data for the creation of the relative permeability curves of the oil-water and oil-gas systems are entered (Table 4 and Table 5).
Table 4 Relative permeabilities of the oil-water system.
| Sw | Krw | Kro |
|---|---|---|
| 0.228 | 0 | 0.7943 |
| 0.248 | 0.0015 | 0.7322 |
| 0.315 | 0.0036 | 0.6526 |
| 0.3423 | 0.0058 | 0.5456 |
| 0.4328 | 0.0185 | 0.3632 |
| 0.5156 | 0.0419 | 0.2261 |
| 0.5945 | 0.0854 | 0.0853 |
| 0.6358 | 0.1142 | 0.0632 |
| 0.6645 | 0.1525 | 0.052 |
| 0.7472 | 0.256 | 0.034 |
| 0.7924 | 0.327 | 0 |
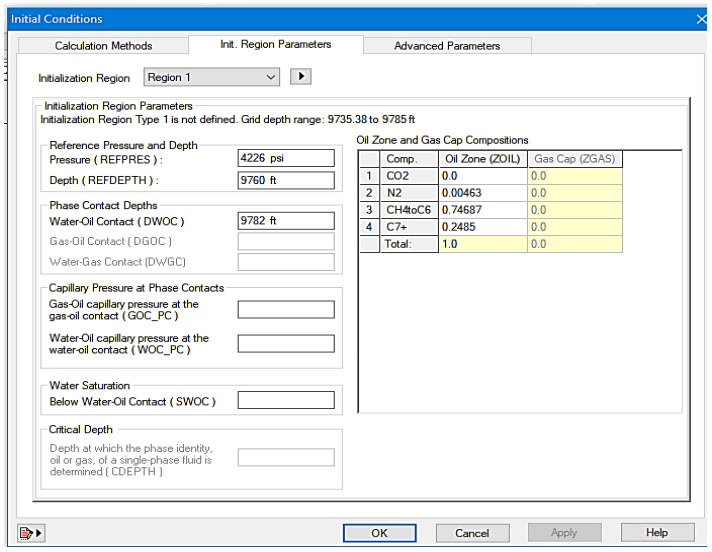
-Initial reservoir conditions.
This section details the values of reservoir pressure, reference depth (average depth of the layer of interest) and the level of contact between water and oil (see Figure 6).
2.2. Dynamic modeling of the sand to be studied.
-Wells and recurrent data.
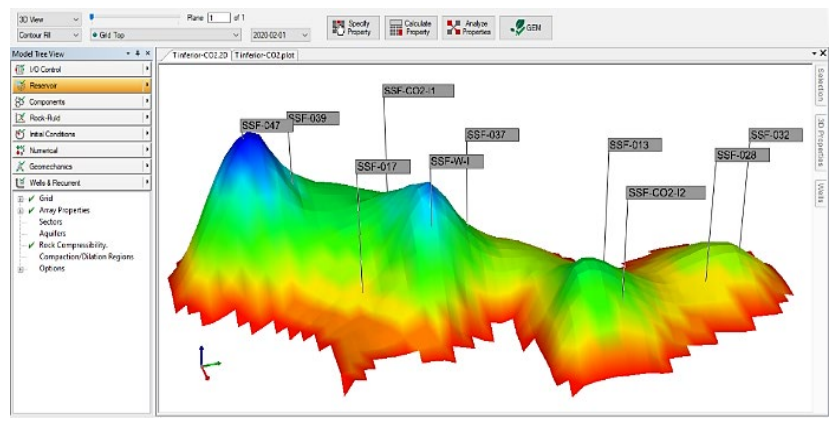
Initially, the seven production wells and one water injection well existing in the field will be built. The producing wells are called: SSF-032, SSF-013, SSF-017, SSF-028, SSF-037, SSF-039 and SSF-047, while the injection well will be identified as SSF-W-I.
In simulation, two main factors are taken into account for producing wells. The first is the maximum fluid flow rate at the surface, set at 150 barrels per day. The second fundamental factor is the minimum bottomhole pressure (BHP), set at 50 Psi.
The conditions set for the water injection well are as follows: Maximum injection rate of 400 barrels per day and a maximum bottom hole pressure (BHP) of 100 Psi.
Construction of injection methods
For this work, "February 1, 2020" is considered as the starting date for the execution of the injection methods to be evaluated; continuous injection of CO2 and alternating injection of water and CO2 (WAG). This process is executed for 8 years, that is, until "February 1, 2028". Furthermore, in both cases the same volume of CO2 will be injected, which is equivalent to 15% of the pore volume, i.e., 621690000 ft3.
-Continuous injection method
Two new CO2 injection wells were created in the continuous CO2 injection model. The new wells will be named "SSF-CO2-I1" and "SSF-CO2-I2". The date of creation of the new wells is "February 1, 2020".
The operational parameters established for the CO2 injector wells are as follows: The largest amount of carbon dioxide that can be injected per day is 42600 cubic feet, and the maximum downhole pressure reaches 1500 psi.
-WAG injection method.
As in the previous method, the location of the wells will be the same. The specific conditions considered for this method are presented in Table 6.
Table 6 Process operating conditions.
| WAG Injection | |
| Year of start of WAG injection | 2020 |
| Plug size | 6% VP |
| WAG Relationship | 0.5 |
| Total volume of gas injected | 1 VP |
| Frequency of cycles | 1 year |
| Water injection rate per day at each well | 6100 bbl |
| Gas injection rate per day in each well | 68100 ft3 |
Finally, the reservoir mesh with the wells created is shown (Figure 7). In this way, we proceed to start the simulation of our methods, with the purpose of analyzing the behavior of the reservoir during the established time.
3. Results
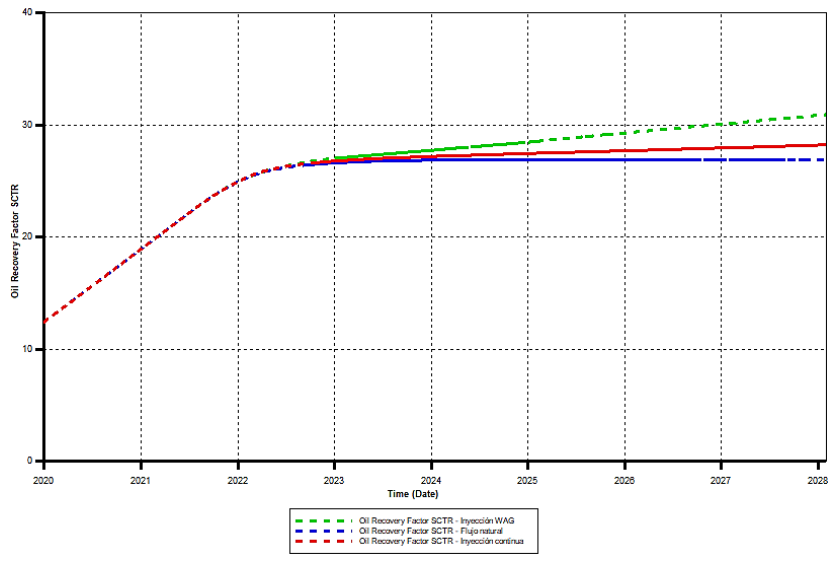
3.1. Recovery factor
In 2020, the recovery factor is less than 15%. However, as of 01/06/2022, there has been an increase in the recovery factor due to the implementation of CO2 injection. In the continuous CO2 injection method, a recovery factor of 28% was achieved. On the other hand, through the application of the WAG method, a significant recovery factor was achieved, reaching 31% as shown in Figure 8.
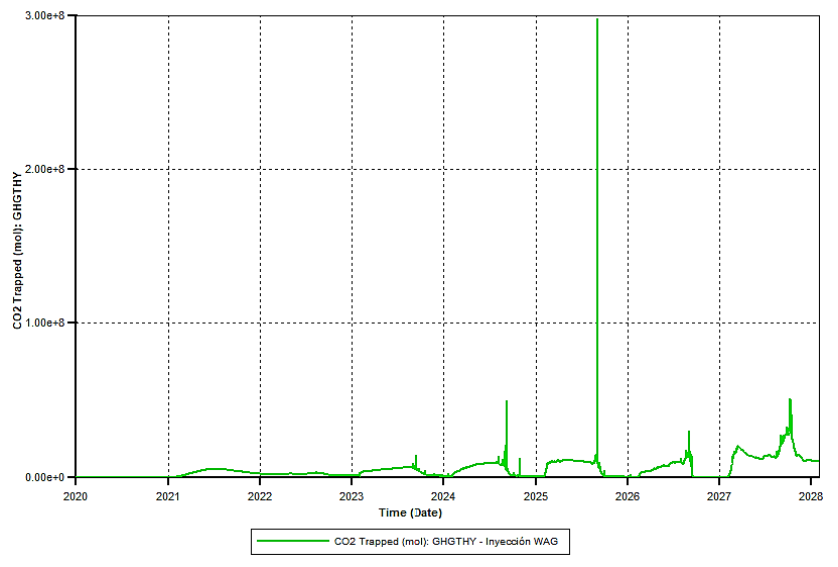
3.2. CO 2 storage
In Figure 9 and Figure 10, it can be seen that the moles of CO2 trapped in the reservoir begin to increase significantly from 2021 onwards. This increase is due to the start of the injection this year.
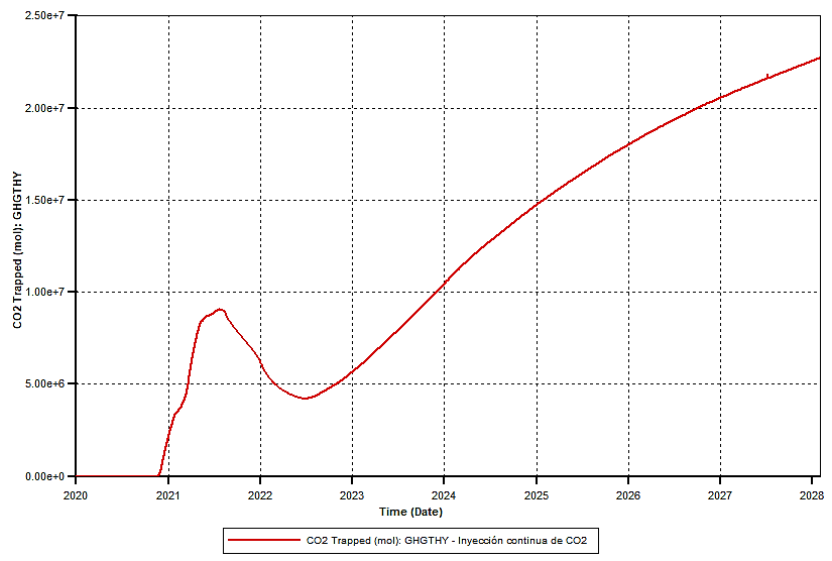
With the continuous CO2 injection method, a decrease is observed until 08/09/2022 where it reaches a value of 4.6x10e6 moles of CO2. Subsequently, the value of the moles of CO2 trapped in the reservoir begins to increase continuously, reaching a value of 2.3x10e7 moles in 2028.
Using the WAG method in Figure 10, it can be seen that the volume of trapped gas increases and decreases very sharply due to the CO2 and water injection cycles. At the end of the injection process in 2028, an amount of 9.0x10e6 moles is stored in the reservoir.
In this way, it is shown that the displacement or sweeping of oil is directly related to the amount of CO2 that is stored in the reservoir.
4. Conclusions
CO2 injection was implemented with the purpose of taking advantage of the associated gas that is burned in the burners in the field. This technique seeks to increase the productivity of wells by applying methods of continuous injection of CO2 and WAG at high pressures. The main objective is to achieve high miscibility between CO2 and oil, resulting in viscosity reduction, thus improving oil mobility, and increasing reservoir sweeping efficiency. These processes led to increased displacement of residual oil and ultimately more efficient oil recovery.
Based on the simulation carried out, it was determined that the recovery factors of the injection methods are as follows: in continuous injection it is 28%, while in WAG injection it amounts to 31%. In this way, it was possible to demonstrate that the most efficient method for the deposit under study is WAG. In addition, a cumulative production of 2.54 MMbbl was obtained for continuous injection during the 8 years of simulation and for WAG injection a cumulative production of 2.72 MMbbl was reached, which justifies the increase in the recovery factor until 2028.
The CO2 storage obtained until 2028, by the WAG injection method is 1.23x10e7 moles of CO2, which represents 36% and the remaining 64% corresponds to the recovered on the surface and with the continuous injection method of 5.73x10e7 moles of CO2, which represents 83% stored and 17% recovered on the surface. It should be noted that the continuous injection method proved to be more effective in terms of storage, managing to store a greater amount of CO2 compared to the WAG method.

