


 nueva página del texto (beta)
 Inglés (pdf)
 Artículo en XML
 Referencias del artículo
 Enviar artículo por email
 Citado por SciELO
  Similares en
SciELO
Similares en
SciELO 
 Permalink
1. Introduction
The world needs for energy have been markedly raised in the last few decades because of several factors, including population growth and industry developments. In the developing countries, the building sector alone consumes up to half of the entire produced energy; the main part goes to heating and cooling devices. In Iraq, for example, it has been reported that 48% of the total produced electricity is consumed by residential building (Abbood et al., 2015). The traditional resources of energy, such as coal, gas, and oil, are not infinite, and it is anticipated not to be sufficient to meet the increasing energy demands soon. This will certainly cause a further increasing in energy prices, particularly under the economic and political unstable situation of some leading oil-producer countries. Furthermore, the negative environmental effect of burning fossil fuels has recently moved to the top of global concern, due to the unprecedented rise in pollution rates and their direct harmful impact on human health and life (Kalogirou, 2009).
In addition to the above-mentioned problems, and although Iraq is considered one of the richest oil and gas reserves on earth, it still suffers from electricity shortage. Based on the official records, the total capacity of available power generation is 24.3 GW, while the peak demand reached 34.18 GW in 2022 (Obeid, 2023). This has led to grave consequences on the national economy and has resulted in rolling blackouts for long hours. Hence, it is necessary for government agencies and institutions, and even for individuals, to seriously look for permanent, renewable, and clean energy resources. The solar energy has been considered one of the best and most attractive options, particularly in the Middle East countries where there is a huge amount of sunlight available for long hours (IRENA, 2019).
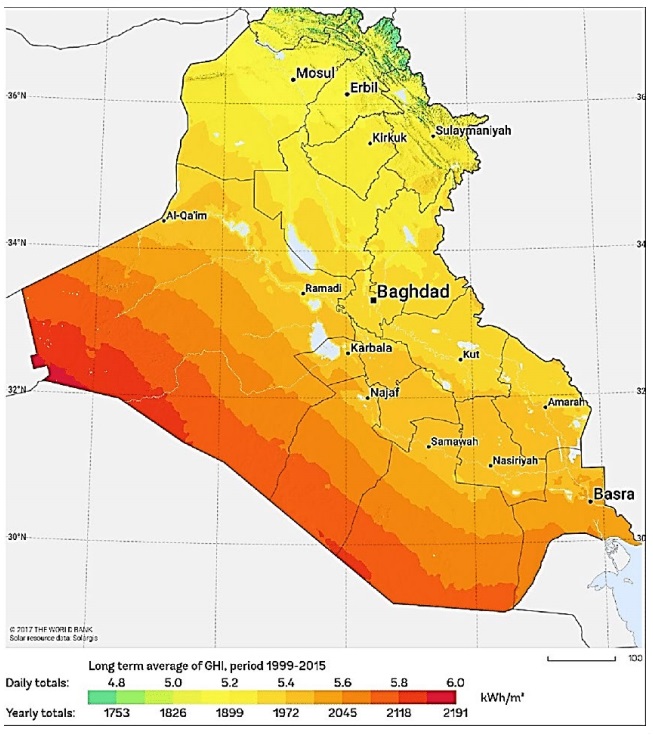
Iraq has an attractive geographical location and great weather conditions for solar energy harnessing. Its dry and rainless wide areas together with an intensive and long-lasting solar radiation make it an appropriate place for solar energy investments. The map of global horizontal irradiation of Iraqi regions is illustrated in Figure 1. The location of the present study, the Babel city located 50 miles south of Baghdad, has a high average global solar radiation reached up to 5.16 kWh/m2/day, with more than 3000 yearly shinning hours (Muslim, 2019).
Despite the obvious advantages of solar energy in Iraq, the solar projects to produce electricity are still limited, commonly for agricultural and domestic purposes. The solar energy contribution to the overall produced electricity was less than 1% in 2020, at only 377 GWh (IRENA, 2022). Since 2019, the government has launched several large-scale projects to invest in solar energy, and at the same time has encouraged its people to start their small and medium-scale residential and commercial projects. The international organizations that existed on ground, including the International Renewable Energy Agency (IREN), International Energy Agency (IEA), Regional Centre for Renewable Energy and Energy Efficiency (RCREEE), and United Nations Development Programme (UNDP), have offered all kinds of assistance and support. The initial plans were not successful due to political conflict and the COVID-19 pandemic (Al-Maleki, 2020; Istepanian, 2020). Recently, the government has resumed its plans and has announced installing large solar power plants with overall capacity of 10 GW by year 2025. Furthermore, the rooftop PV systems have become popular in Iraq, and now can be seen in several locations and applications. They are currently used to provide homes, schools, hospitals, and other private and public buildings with electricity, and to lighten the streets in the big cities, and pump water for drinking and irrigation (Al-Maleki, 2020; IEA, 2019; Istepanian, 2020).
The most important drawback of PV systems is the large capital cost, and the low efficiency of the solar cells (Deambi, 2016). The design of on-grid PV systems is considered an adequate solution that reduces the energy storage costs, which are high. Furthermore, the proper design and optimal sizing of the solar system helps in obtaining the maximum possible performance of the entire system, and hence contributes toward reducing the net costs. There are several commercial packages that can be utilized to determine the capacity and sizes of the PV system components, and to obtain an efficient and economic design. One of the best and most widely used package in this field is the photovoltaic system (PVsyst) software, developed by Geneva University. This software enables users to design the PV system, calculate the possible obtainable energy, and helps in the economic and environmental evaluation of the project. It helps the engineers and designers to take clear and justified decisions regarding the PV systems design.
PV systems design and improvement have been the subject of numerous studies and research. Here, only the most relevant recent investigations using PVsyst program are presented. Alsadi and Khatib (2018) reviewed the already existing techniques utilized in designing the PV systems, including both on-grid and off-grid types. They compared the available design tools and techniques and found that PVsyst program has the most adequate tools for PV systems simulation. Malvoni et al. (2017) and Nicolás-Martín et al. (2020) conducted a simulation study using various commercial PV system design packages, including PVsyst, SAM, and PVLib. Nicolás-Martín et al. (2020) also developed a new PV estimation model, the SoL model. The analysis included comparing the standard desired output data in the design. They found that all packages were useful, but PVsyst had the strongest tools for analysing and presenting data. Baseer et al. (2020) used the PVsyst program to determine the optimal sizes and specifications of the components of a 100 MW on-grid PV system in Abu Dhabi, UAE. They determined the basic design parameters, including solar radiation intensity, panels’ orientation, loss factors, output power, and installation and running cost. It was found that in addition to the obvious positive environmental impact, PV systems had significant economic benefits. Shrivastava et al. (2023) used PVsyst tools and studied a 20 kW on-grid PV system for the Karunya Institute of Technology. They measured the output power, and other design parameters. They concluded that PVsyst could provide fully trustful design data. Kumar et al. (2021) estimated the load demand of an academic building in Biknar, India, and designed a proper PV system for it using PVsyst software. They found that the system losses must be considered in the design to avoid any supply shortage. Furthermore, the researchers calculated the performance ratio and determined the best operation conditions for the system. Baqir and Channi (2022) modelled a 700 kW on-grid PV system in Afghanistan using PVsyst program. They evaluated the system performance and found that the system could operate perfectly for power factor values between 0.7 to 0.9. Tuncer and Sazak (2023) compared the simulation results using PVsyst software with the actual values of an already installed 700 kW on-grid PV system. The results showed the simulation outputs, and the actual data were almost identical. Benchrifa et al. (2023) used PVsyst software to evaluate the economic and environmental benefits of installing a grid-connected PV system based on the annual electricity consumption of the faculty of science in Rabat. They found that this installation could save up to 6142 tCO2. Serat et al. (2023) conducted an economic analysis of an on-grid rooftop PV system in Ghazni using PVsyst software. They showed that a 10-kW capacity PV system could produce an annual energy output at 19323 kWh. The payback period of the PV system was estimated to be 6.3 years. Mishra et al. (2024) compared the measured data of a real 5 MWp PV plant with the corresponding simulation results obtained using PVsyst software. The strong connection between the model and real systems indicated that PVsyst could be used in designing PV systems with confidence. Finally, Amin (2024) conducted a comparative analysis of using two different simulation packages: Helioscope and PVsyst in evaluating and analysing the performance of an on-grid residential PV system under the climate condition of Saudia Arabia. The results showed that both models provided reasonable data, with a minor difference in most evaluated parameters. The annual performance ratio was estimated to be between 74.8 - 78.04%. The 15-kW PV system recommended in the study could produce up to 28 MWh/year based on PVsyst simulation.
In summary, one can conclude the increasing local and international interest in solar energy investment, because of its environmental and economic advantages. Moreover, it can be confirmed that PVsyst program has powerful tools that effectively help the designers to model the PV systems and attain the best possible performances. Although the PVsyst program is a commercial package, and there are many relevant articles available in the literature, the problem still needs more investigations to show and focus on all its benefits. This is particularly true, when the subject significantly contributes toward answering the most important concerns in solar energy investment: the economic and environmental issues. Furthermore, the obtained results may be different from place to another, and the use of solar energy is not always justified. Optimizing the solar system is a principal issue prior to any installation. In the author’s point of view, the current work comes to answer some questions regarding this direction. Such research is required for the sustainable development of the local regions. In this study, PVsyst software is used to design and optimize an on-grid PV system to fulfil the electrical load of a high school in Iraq.
The current research is conducted to achieve the following objectives:
• Encouraging the usage of the commercial software packages in designing the PV system prior to installation, to improve its performance to the latest level.
• Determining the demand electrical load and determining the type and capacity of the different components of the system.
• Examining the proposed system performance and determining the energy output.
• Performing an economic analysis based on the installation and operating costs, and to evaluate the environmental influence of using the proposed system.
2. Photovoltaic systems
The photovoltaic (PV) panels use the electronic properties of semiconductor materials, mostly silicon, to convert the incident sunlight into electricity. PV systems are environmentally friendly as they operate without any harmful emissions. Furthermore, they are economic to operate; they last for a long time and require little maintenance. A PV cell is composed of one or two thin silicon sheets, which receive the light and as result electrical charges are generated. The cells can be packed into module to produce the required current and voltage. Moreover, for large capacities, PV modules can be connected in parallel or series to form panels arrays (Kalogirou, 2009).
The panel output power (P) is represented by the product of the current (I) by the voltage (V), as in Equation 1.
The panel efficiency (η) is defined by the ratio of the output power to the irradiation power (solar radiation intensity G times the panel surface area (A) as in Equation 2.
The typical efficiency of the solar panel ranges between 12 to 15%. Substantial numbers of research are in progress aiming at improving these values (Kalogirou, 2009).
The PV systems are designed into two main categories: Grid-connected (on-grid) and standalone (off-grid), depending on the application. The first type, an on-grid system, uses solar panels and an inverter. The inverter is a device that converts the direct current (DC) resulted from the solar cells into one or three phase Alternating Current (AC) compatible with the different appliances. The second off-grid type, on the other hand, includes storage units (batteries) in addition to the previously mentioned components. In buildings that are near to the public electrical grid or those do not require storing energy to be used during night, such as in the current case, the first type is superior, because it is simpler and more economic (Kalogirou, 2009).
3. Materials and methods
3.1. Project summary
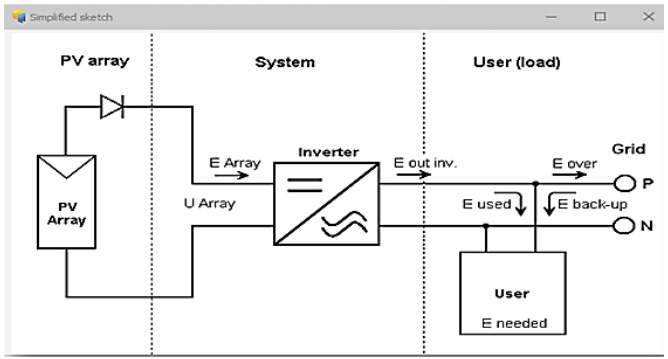
The present project is about designing a rooftop on-grid PV system for the purpose of supplying the full or partial required load for the Hillah High School located in Babel city, Iraq. Figure 2 represents a simplified diagram of such system and its components, PV array, inverter, and an electric load. The required load is determined based on the expected loads of the essential equipment in the building. The analysis includes determining the PV panels’ capacity and/or determining the required area, selecting, and determining the capacities of the other system components, determining the energy output and the performance ratios, determining the system losses, and finally evaluate the economic costs and environmental effects during the project lifetime.
3.2. PVsyst program
The current study uses the PVsyst program to design the PV system and its components. This simulation program was initially created and developed by Geneva University to facilitate the decision-making for the engineers and designers in the PV technology industry. It has unique tools that enable designers to analyse, compare and improve the system orientation and specifications to achieve the best possible performance of the system. The software package also has powerful tools for the economic and environmental evaluations of the designed system.
3.3. Methodology framework
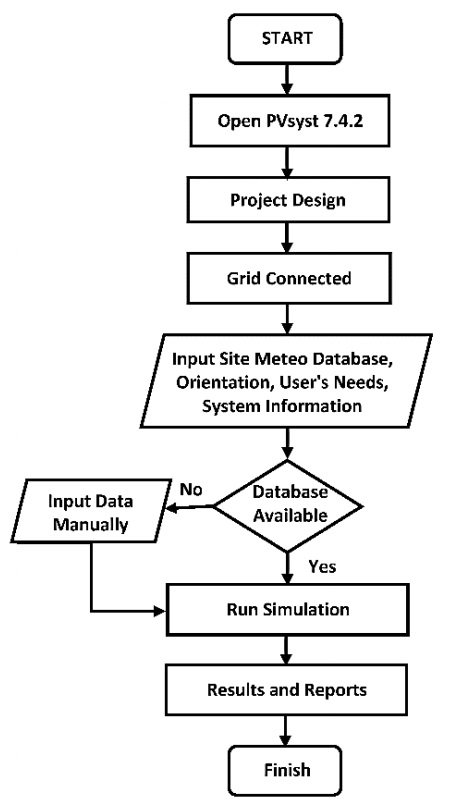
The simulation using PVsyst software follows a procedure shown in Figure 3 and discussed in detail in the following sections.
3.3.1. Site location and weather data
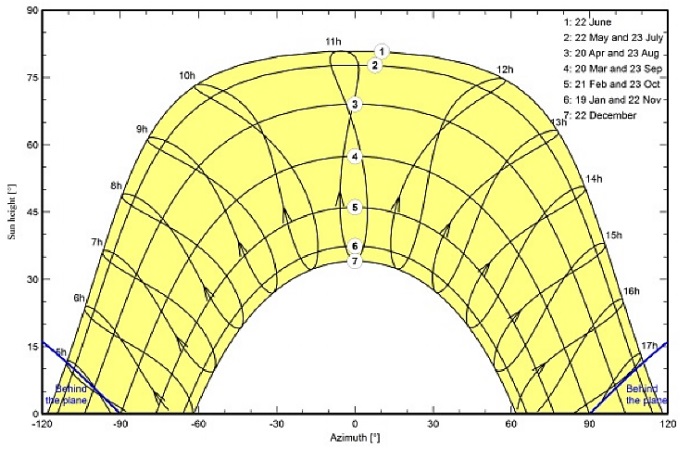
Figure 4 shows the geographical location of the present study, the Hillah High School for specials girls in the Babel city, Iraq. This school is located at latitude (N) 32.4920, longitude (E) 44.4382, and elevation 37 m. The location is firstly defined by introducing the geographical coordinates to the PVsyst program, and then the weather data, particularly the solar radiation and the outdoor temperature are obtained. The sun paths during the year months can also be obtained.
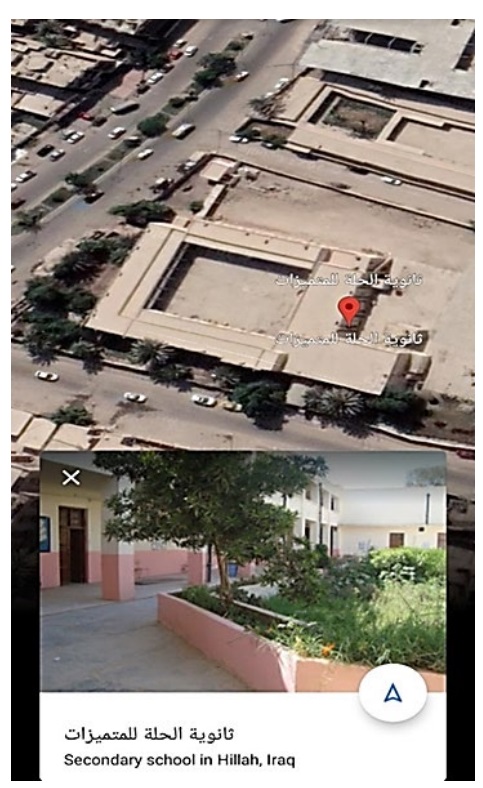
Table 1 and Figure 5 represent the obtained data based on the software database.
Table 1 Monthly weather values: Global horizontal radiation (GlobHor), diffuse horizontal radiation (DiffHor), clearance index (KT), and ambient temperature (T_Amb).
| Interval beginning | GlobHor (kWh/m2/mth) | DiffHor (kWh/m2/mth) | KT (ratio) | T_Am (°C) |
|---|---|---|---|---|
| January | 91.8 | 42.57 | 0.528 | 10.6 |
| February | 109.5 | 43.81 | 0.563 | 12.5 |
| March | 150.7 | 59.73 | 0.563 | 17.3 |
| April | 171.9 | 66.24 | 0.564 | 24.0 |
| May | 209.9 | 72.37 | 0.607 | 30.2 |
| June | 238.2 | 58.94 | 0.690 | 34.3 |
| July | 228.5 | 66.29 | 0.651 | 36.8 |
| August | 214.5 | 55.92 | 0.658 | 36.5 |
| September | 174.6 | 54.49 | 0.634 | 32.9 |
| October | 124.0 | 54.68 | 0.535 | 27.0 |
| November | 88.5 | 44.16 | 0.498 | 18.7 |
| December | 81.8 | 37.79 | 0.513 | 12.4 |
| Year | 1883.8 | 657.69 | 0.597 | 24.5 |
The weather data illuminates the high value of the annular solar radiation intensity of the design location, as it has reached the value 1883.8 kW/m2, with an accumulation clearance index value of almost 0.6. The average ambient temperature has reached the value of 24.5 oC. This clearly indicates that using PV systems can provide an encouraging option for electricity production.
3.3.2. The orientation
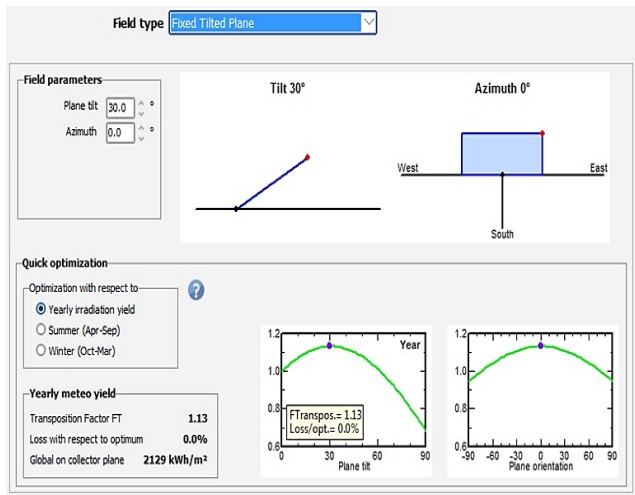
The solar panels must be directed in a way that they can receive the most possible incident radiation over the year, and they can minimize the power losses to the lowest level. Figure 6 demonstrates the panel orientation settings in the present study. The azimuth angle is set to 0o (corresponding to the south direction), and tilt angle is set to 30o, so that the orientation losses are totally avoided.
3.3.3. Electrical load
The load demand of the project must be carefully estimated to determine the required capacity of the PV array panels. This helps in avoiding any unjustified extra costs resulted from system oversizing and helps avoiding any power shortage resulted from system under sizing. The proposed schools comprise forty classrooms and two administration rooms. Considering the usual lighting and electrical equipment in typical classrooms and based on the average electrical consumption rates and normal operating hours, the total load is assumed to be 40 kWh/day. The detailed calculation sheet is not included in this paper.
3.3.4. Selecting system components -panels array and inverter
The designed system is comprised of PV panels and DC - AC inverter. LG 450 N2EW-E6 PV panels from LG electronics were selected in this study, because of their availability and high reliability. This type belongs to mono-c-Si cells, and has a capacity of 450 Wp, and a high efficiency at a value of 20.5%. PVsyst software determines the required number of solar panels based on the demand load. It also determines the area required for PV arrays installation. Table 2 illustrates the details of PV system specifications. The number of PV modules required is 90 units (6 × 15) that nominally produce 41 kWp and cover an area of 198 m2.
Table 2 PV system characteristics.
| PV module | Inverter | ||
|---|---|---|---|
| Manufacturer | Generic | Manufacturer | Generic |
| Model | LG 450 N2W.E6 | Model | Sun2000-12KTL-MS-400V |
| (Original PVsyst database) | (Original PVsyst database) | ||
| Unit Nom. Power | 450 Wp | Unit Nom. Power | 12.0 kWac |
| Number of PV modules | 90 units | Number of inverters | 6*MPPT 50% 3units |
| Nominal (STC) | 40.5 kWp | Total power | 36.0 kWac |
| Modules | 6 Strings × 15 In series | Operating voltage | 200.1000 V |
| At operating cond. (50 oC) | Max power (=<55 oC) | 13.2 kWac | |
| Pmpp | 37.2 kEp | Pnom ratio (DC:AC) | 1.13 |
| U mpp | 572 V | No power sharing between MPPTs | |
| I mpp | 65 A | ||
| Total PV power | Total inverter power | ||
| Nominal (STC) | 41 kWp | Total power | 36 kWac |
| Total | 90 modules | Number of inverters | 3 units |
| Module area | 198 m2 | Pnom ratio | 1.13 |
| Cell area | 176 m2 |
Regarding the inverter, SUN2000-12KTL-M5-400V model from Huawei electronics is selected for this study. The specifications of this inverter type are unit power 12.0 kWac, operating voltage 200-1000 V, and the pnom ratio 1.13. The maximum efficiency of this type reaches up to 98.7 %, based on its datasheet. Three inverter units of a total power at 36 kWac are used in the present study.
4. Results and discussion
4.1. Output power
Table 3 represents the main results, including global horizontal irradiation, ambient temperature, and effective produced energy for each month of the year. As expected, the produced energy is higher in summer months, because of high solar radiation. The maximum produced energy has reached up to 6874 kWh in June. Nevertheless, it is still satisfactory at other months, and has reached its minimum record at about 4335 kWh in November. The total produced electricity for the entire year has reached more than 70 MWh. It can be noted from the table that there is a small difference between the energy produced from the PV arrays and that injected into the grid due transformation losses.
Table 3 Global horizontal irradiation (GlobHor), ambient temperature (T_Amb), and total power generation (EArray and E_Grid) for each month of the year.
| GlobHor | T_Amb | EArray | E-Grid | |
|---|---|---|---|---|
| (kWh/m2) | (oC) | (kWh) | (kWh) | |
| January | 91.8 | 10.62 | 5023 | 4921 |
| February | 109.5 | 12.50 | 5378 | 5269 |
| March | 150.7 | 17.33 | 6375 | 6243 |
| April | 171.9 | 24.05 | 6261 | 6125 |
| May | 209.9 | 30.21 | 6755 | 6599 |
| June | 238.2 | 34.27 | 7038 | 6874 |
| July | 228.5 | 36.78 | 6911 | 6745 |
| August | 214.5 | 36.51 | 7009 | 6844 |
| September | 174.6 | 32.91 | 6596 | 6446 |
| October | 124.0 | 27.04 | 5451 | 5329 |
| November | 88.5 | 18.65 | 4432 | 4335 |
| December | 81.8 | 12.45 | 4598 | 4500 |
| Year | 1883.8 | 24.51 | 71826 | 70230 |
4.2. Performance ratio (PR)
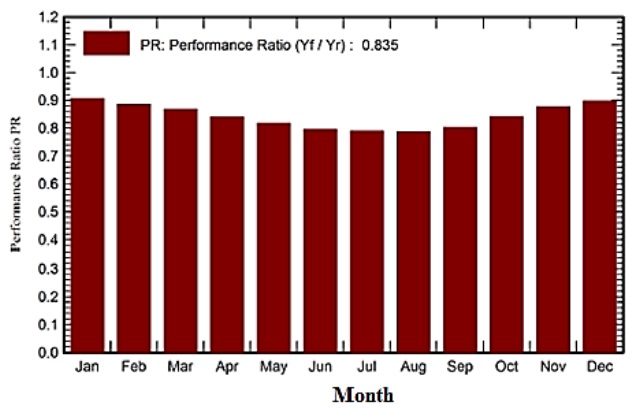
The performance ratio expresses the ratio between the actual PV system obtained output energy to the theoretical predicted energy. Figure 7 demonstrates the values of the performance ratio of the proposed system during all year months. There are slight variations in PR monthly values, with larger values recorded in winter months. This can be attributed to the negative effect of the high ambient temperature on the losses from PV panels. The yearly average value of the performance ratio of the considered PV system is 0.835, which is a high value.
4.3. Normalized productions
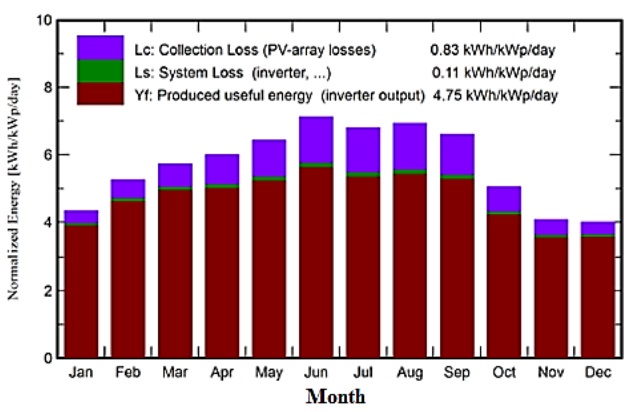
Figure 8 illustrates the normalized produced useful energy together with the PV arrays and system losses. The energy production is higher in summer months due to high solar radiation rates and due to long sun-shining hours in these months. The maximum produced useful energy has reached up to 5.9 Wh/kWp/day. However, at the same time, the rates of energy losses have been noticed to be higher in these months due to the negative impact of the increase in ambient temperatures on PV system performance, as has been mentioned before.
4.4. Losses diagram
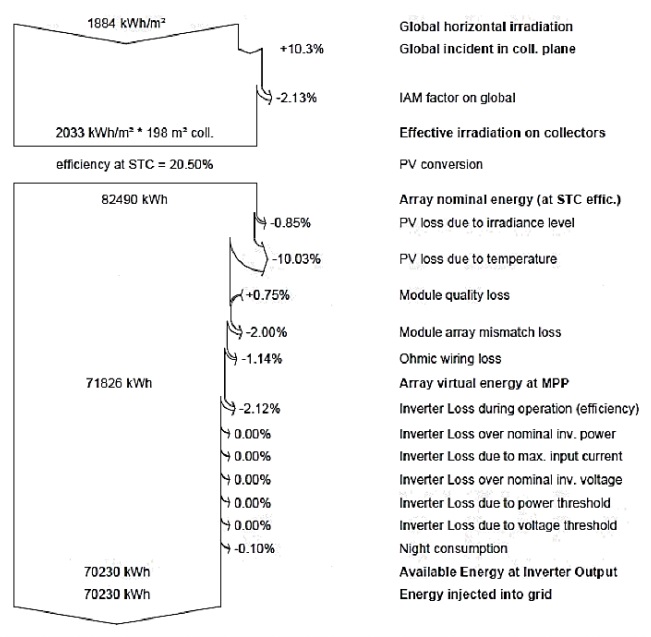
Figure 9 provides detailed data related to the power losses of the PV system, in a form of an arrow diagram. It includes the different losses resources of the complete PV system, starting from the input solar radiation and ending with the output net power. The nominal energy of the PV arrays is 82.49 MWh, whereas the available energy injected into grid is 70.23 MWh. This means that 15% of the possible produced energy is lost due to several causes, including PV cells losses and electrical inverter losses. The PV losses due to temperature itself form more than 10% of the total losses. The proper design of the PV system and its components helps in reducing these losses to the lowest possible level.
4.5. Financial cost
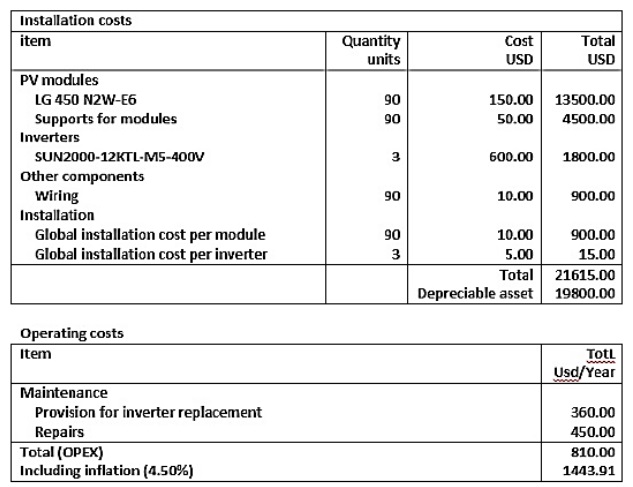
The high capital cost is considered the most crucial drawbacks of PV system installation. Even in the on-grid system, where the storage batteries are not needed, the initial cost is still considerable. Nevertheless, the running cost for such systems is exceptionally low during the entire lifetime of the project. PVsyst program helps in conducting a detailed economic evaluation of the project, but a basic study is enough to display the viability of PV system installation. Figure 10 represents the estimated prices of the different system components and accessories in addition to the estimated costs of supports and installation. The prices have been determined based on the common values in the known local market. An extra 2% of the total project cost is added as an estimation of the yearly maintenance cost, with an inflation rate set at 4.5%.
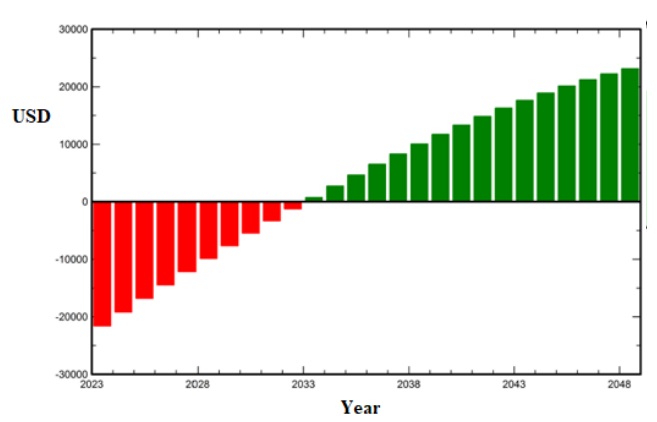
Based on the total cost and the total net produced energy, the levelized cost of electricity (LCOE) is calculated to be 0.055 USD/kWh. Considering a fixed feed-in tariff at 0.046 USD/kWh, and a project lifetime at 25 years, the investment cost can be recovered within 9 years, and the net profit from the project exceeds 20,000 USD. Figure 11 shows the cumulative cashflow of the project.
4.6. Carbon emission saving
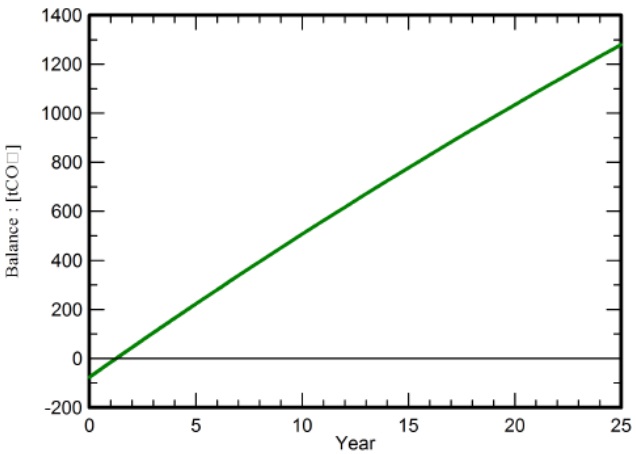
No doubt that PV systems emit harmful gasses, such as carbon, nitrogen, and sulphur oxides, much less compared to fossil fuels systems. The solar energy lifetime emissions are estimated to be less than 40 gCO2/kWh, according to the National Renewable Energy Laboratory (NREL). PVsyst program estimates the CO2 emission savings by comparing the carbon emissions resulted from the PV system and that resulted from a traditional system of a similar capacity. According to the International Energy Agency (IEA), the carbon emissions from Iraqi grid are estimated to be 869 gCO2/kWh for the project lifetime. The calculations show that the total emission of the PV system and its components is 76.3 tCO2 for the project lifecycle. On the other hand, the carbon emission of a fossil fuel system with similar produced energy for the same time is reached 1525.7 tCO2. Figure 12 illustrates the carbon emission balance for the project lifetime, 25 years. It can be noticed that a huge saving in CO2 emission at 1279.6 tCO2 is attained because of PV installation. This finding confirms, for sure, the already known positive environmental impact of the solar energy.
5. Conclusions
This paper includes a design and analysis of an on-grid PV system to feed a high school in Iraq of an estimated electrical load equal to 40 kWh/day using PVsyst program. As a result of this research the following points can be concluded.
•The PVsyst program has efficient input and output tools that make it one of the most important software packages in designing PV systems as it has been already reported by some researchers.
•A PV system composed of 90 (450 Wp) solar panels and 3 (12 kWac) inverters produces a net output power of 70.23 MWh, which is large enough to meet the electrical load demand of the school project.
•Although the large initial cost of the PV systems, they have obvious economic and environmental returns to rely on. The project capital cost recovery time is estimated to be around 9 years, and the system saves more than 1275 tons harmful carbon emissions during the project lifetime.

