


 nueva página del texto (beta)
 Inglés (pdf)
 Artículo en XML
 Referencias del artículo
 Enviar artículo por email
 Citado por SciELO
  Similares en
SciELO
Similares en
SciELO 
 Permalink
1. Introduction
Although diagnostic examinations using computed tomography (CT) modalities are developing rapidly and already used in many routine clinical examinations, on the other hand the massive use of CT scans also raises substantial concerns about radiation exposure to patients patients (Blueprint & Imaging, n.d.). Dose optimization is quite challenging, especially on a CT scan with quite homogeneous objects with low contrast organs, such as an abdominal CT scan (Seyal et al., 2015), so it requires excellent quality to be able to display maximum diagnostic information. Besides there are reproductive organs in the abdominal area which are radiosensitive organs (Ray & Choudhuri, 2011).
The challenge in using the CT scan modality is not limited to improving image quality, because efforts to increase resolution and reduce noise can be achieved by giving a higher patient dose. Radiographers cannot rule out the quality of the images produced in efforts to reduce the dose. Image quality includes spatial resolution, contrast resolution, and noise (Bushong, 2016). Even though they have been equipped with adequate equipment, not all clinicians are quite familiar with the use of dose reduction in CT scan examinations, often the application of dose reduction is associated with a decrease in the quality of the resulting image (Kordolaimi et al., 2013).
Modern computed tomography (CT) modalities are now equipped with several dose reduction features such as tube current modulation, automatic tube voltage selection, filtration, as well as postprocessing methods such as iterative reconstruction (IR) (Kataria et al., 2021), which can be used to improve and optimize data processing so that allows reduction of radiation dose while preserving diagnostic image quality quality (Deák et al., 2013). ASIR is one of the IR algorithms that works in the raw data domain to model noise and objects. Adaptive statistical iterative reconstruction (ASIR-V) is a recently released IR algorithm developed by GE. ASIR-V features more advanced noise and object modeling than ASIR and has implemented physics modelling. ASIR-V settings can be made in the raw data domain with a range of 10% -100% (De Marco & Origgi, 2018).
The challenge in using the CT scan modality is not limited to improving image quality, because efforts to increase resolution and reduce noise can be achieved by giving a higher patient dose. Radiographers cannot rule out the quality of the images produced in efforts to reduce the dose. Image quality includes spatial resolution, contrast resolution, and noise. (Bushong, 2016). Even though they have been equipped with adequate equipment, not all clinicians are quite familiar with the use of dose reduction in CT scan examinations, often the application of dose reduction is associated with a decrease in the quality of the resulting image (Kordolaimi et al., 2013).
Through research conducted by GE, it is known that the use of ASIR-V is proven to reduce doses by up to 82% compared to not using ASIR-V. According to Barca (2021) the application of the ASIR-V software in a CT scan examination can reduce the noise level from 52.9% to 63.7%, while without the implementation of the ASIR-V software the reduction in noise levels is only around 33.8% to 39, 9% (Bahrurridha & Tunggadewi, 2022; Jensen et al., 2020). Whereas in a study entitled: New adaptive statistical iterative reconstruction ASIR-V: Assessment of noise performance in comparison to ASIR-V, CT scan images were reconstructed using standard, soft and bone kernel variations, ASIR-V levels of 40%, 60% and 100% and Slice thickness settings of 0.625 and 2.5 mm show the result that the use of ASIR-V provides a more significant noise reduction than ASIR while maintaining a similar NPS (De Marco & Origgi, 2018).
In other studies, the application of IR such as ASIR and ASIR-V was also combined with a low dose CT scan protocol that applied variations in tube voltage, tube current or using dose reduction software. Singh et al. (2010) in his research entitled: Abdominal CT: comparison of adaptive statistical iterative and filtered back projection reconstruction technique with variations in the use of tube currents of 50 mA, 100 mA, 150 mA and 220 mA the application of ASIR is proven to reduce noise and improve diagnostic information in the form of small abdominal lesions with reduced radiation dose to 8.4 mGy when 30% ASIR reconstruction was performed and in patients weighing ≤ 90 kg radiation dose decreased to 4.2 mGy with 50-70% ASIR reconstructed images (Singh et al., 2010).
Mokhtar et al. (2021), in his research entitled: Studies on the radiation dose, image quality and low contrast detectability from MSCT abdomen by using low tube voltage compared the use of variations in tube voltage (kV) in abdominal CT scan examinations, namely 80 kV, 100 kV and 120 kV found an increase in noise when reducing the tube voltage (kV) on an abdominal CT scan, but it is still possible to apply a reduced dose by reducing kV from 120 kV to 80 kV with high mA usage, even though there is a decrease in image quality (Mokhtar et al., 2021). Whereas in a study entitled: Individualized kV selection and tube current reduction in excretory phase computed tomography urography: Potential for radiation dose reduction and the contribution of iterative reconstruction to image quality which combines the use of automated kV selection (CARE kV; Siemens Healthcare), tube current reduction ( CARE dose 4D; Siemens Healthcare) and IR (SAFIRE; Siemens Healthcare) concluded that this combination can reduce the radiation dose received by patients while maintaining image quality and the diagnostic information displayed (Froemming et al., 2013).
Based on previous research and observations conducted by the author in a hospital with the GE Optima CT scan modality equipped with ASIR-V software, efforts have never been made to reduce the dose by combining more kV settings accompanied by dose reduction settings added with the use of iterative reconstruction. ASIR-V to improve the resulting image. This is unfortunate because the use of ASIR-V software to improve CT scan images with lower exposure factor settings has enormous potential to produce CT scan images with minimal dose and optimal image quality.
2. Materials and methods
This type of research is quasi-experimental with a pretest posttest design. VCT QA phantom, placement of the phantom as shown in figure 1, scanned with abdominal CT parameters with the combination of tube voltage variations (80 kV, 100 kV and 120 kV) and dose reduction settings (50% and 60%). The radiation dose shown by CTDIvol on the CT Scan monitor screen is recorded in the observation table. CTDIvol is used as an index of the radiation dose generated by a CT scan to determine the approximate dose received by the patient.
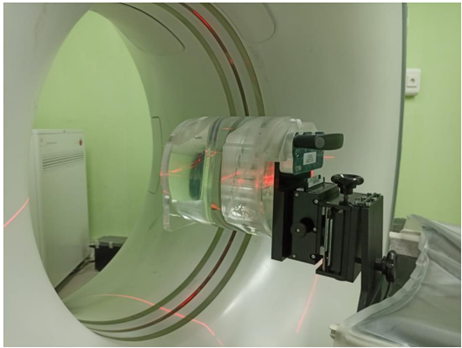
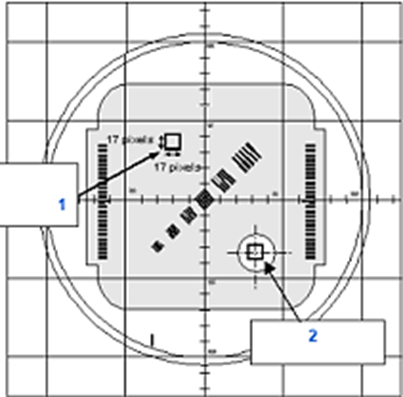
Image quality analysis was performed on the results of each scale in VCT QA phantom as shown as figure 2 scanning with the six combinations of tube voltage variations of 80 kV, 100 kV and 120 kV and the application of 50% and 60% dose reduction to determine differences in image quality acquired with different combinations of tube voltage and dose reduction variations. Image quality assessed includes noise, extreme contrast spatial resolution and low contrast detectability with IndoQCT Software. Each image quality is assessed from 5 slices of phantom images.
Then the image reconstructed using ASIR-V 20%, 60 % and 100%. ASIR-V reconstruction was conducted in the image post processing process after image acquisition. Then an image quality assessment was conducted. Returning to the results of the VCT QA phantom scan, the ASIR reconstruction has been applied, including noise assessment, extreme contrast spatial resolution and low contrast detectability with IndoQCT Software. Image quality data including noise, low contrast detectability (LCD) and extreme contrast spatial resolution (HCR) obtained were analyzed by using the paired t-test statistical test.
3. Results
In this study, scanning of the VCT QA phantom was conducted using 3 variations of tube voltage values (80 kV, 100, 120 kV) and 2 variations of dose reduction (50% and 60%) as the treatment group, while the control group was 120 kV with dose reduction 0%.
3.1. CTDIvol profile
Table 1 shows that there are differences in the resulting dose values. The smaller the tube voltage value used, the smaller the resulting dose value, and the greater the dose reduction setting used, the lower the dose value.
Table 1 Scanning parameter and radiation dose with various tube voltage and dose reduction setting.
| Tube voltage (kV) | Tube current (mAs) | Dose Reduction | CTDIvol (mGy) | |
|---|---|---|---|---|
| Standard acquisition | 120 | 220 | 0% | 15,57 |
| Acquisition using tube voltage and dose reduction variation settings | 80 | 220 | 50% | 2,46 |
| 80 | 220 | 60% | 2,01 | |
| 100 | 220 | 50% | 4,83 | |
| 100 | 220 | 60% | 3,95 | |
| 120 | 220 | 50% | 7,79 | |
| 120 | 220 | 60% | 6,37 |
The highest radiation dose was produced by a scan with a tube voltage setting of 120 kV, 220 mAs and 0% dose reduction which resulted in a radiation dose value of 15.57 mGy, while the lowest dose was produced by a tube voltage setting of 90 kV and a dose reduction of 60% which resulted in dose of 2.01. The average CTDIvol resulting from the treatment group was 4.56 mGy.
3.2. Image noise
3.2.1. Image noise evaluation using various tube voltage and dose reduction setting
The noise evaluation is generated by placing the ROI in the middle of the object which is the image of the VCT phantom water section. Figure 3 shows the ROI placement used to generate image noise values with the resulting noise values presented in Figure 4 below.
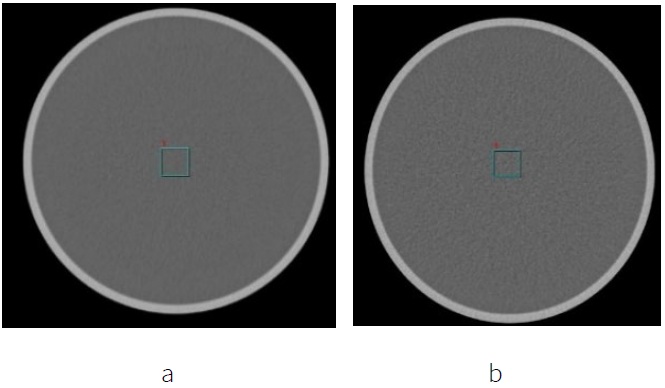
Figure 3 Image noise visualized using a) 80 kV, 220 mAs and 0% dose reduction (standard acquisition), and b) 80 kV and 60% dose reduction setting.
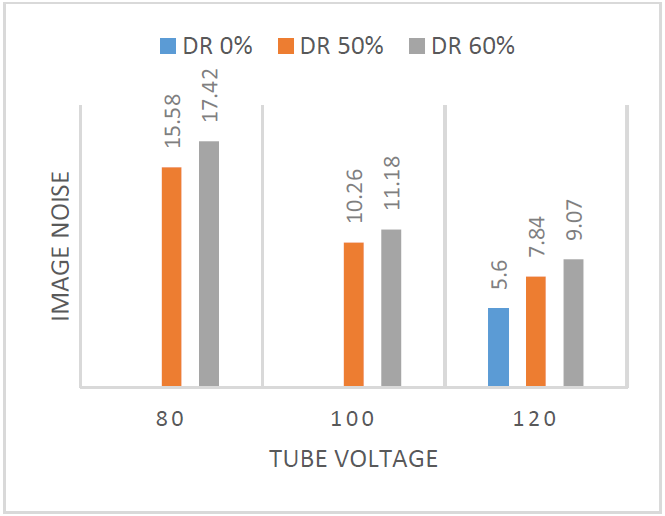
The lowest noise value was generated by the scan with standard settings, namely tube voltage 120 kV, 220 mAs and 0% dose reduction which resulted in a noise value of 5.6, while the highest noise was produced by acquisition with a tube voltage setting of 90 kV and 60% dose reduction. which produces a noise of 17.42. The average noise value of the treatment group is 11.89.
3.2.2. Image noise evaluation after ASIR-V application
The VCT phantom image was scanned with the parameters of an abdominal CT scan and variations were made on the tube voltage and dose reduction settings, then reconstructed with the ASIR-V settings, the following data were produced as shown in Figure 5.
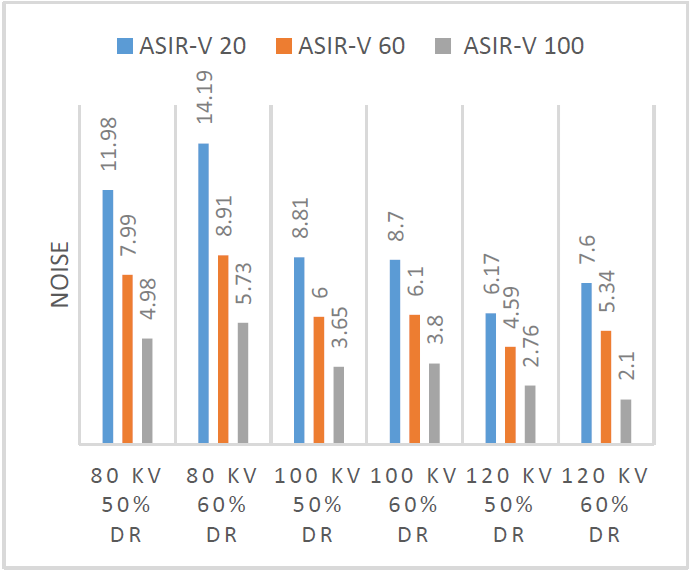
Based on the graph, the noise reduction in each group, the higher the ASIR-V value, the lower the noise value. paired t-test shows that there is a significant difference in the value of image noise in each combination of tube voltage and dose reduction variations before and after ASIR-V reconstruction (20%, 60% and 100%) there is a difference in noise with variations in tube voltage settings, dose reduction and ASIR-V reconstruction on CT scan. After conducting a different test with the paired t-test, the results obtained from 15 variations were significantly different from the control group. Noise values that do not have a significant difference are using 80 kV DR 60% ASIR-V 100%, 100 kV DR 50% ASIR-V 60% and 120 kV DR 60% ASIR-V 60%.
3.3. High contrast spatial resolution
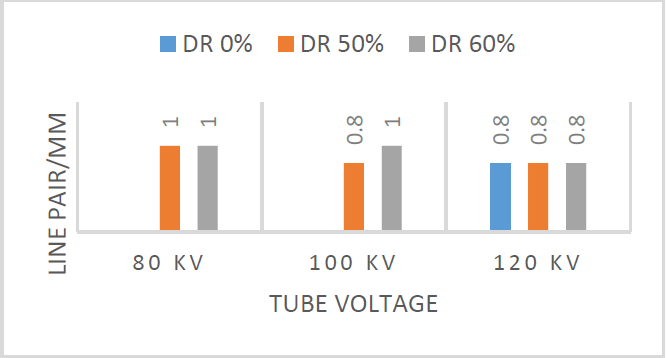
3.3.1. High contrast spatial resolution evaluation using various tube voltage and dose reduction setting
Evaluation of extreme contrast spatial resolution (HCR) is produced by observing the bar pattern image which can still be clearly defined by the five lines in the image of the VCT phantom section 1. Figure 6 below shows the image of the VCT phantom section 1 resulting from different tube voltage and dose reduction settings. The measurement results of the bar pattern description that can still be clearly defined are presented in Figure 7 below.
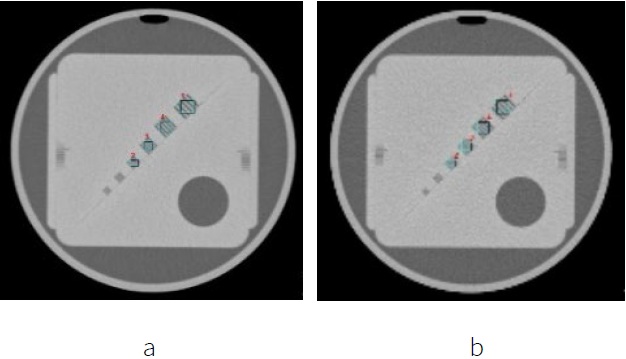
Figure 6 Extreme contrast spatial resolution visualized using a) 80 kV, 220 mAs and 0% dose reduction (standard acquisition), and b) 80 kV and 60% dose reduction setting.
The graph in Figure 7 shows that the smallest bar pattern size that appears is 0.8 mm obtained from standard acquisition images (120 kV tube voltage and 0% dose reduction), images with a combination of 120 kV tube voltage settings and 50% & 60% dose reduction, as well as tube voltage settings of 100 kV and 50% dose reduction. The largest visible bar pattern size of 1 mm was obtained from images with a tube voltage setting of 100 kV and a dose reduction of 60%, and a tube voltage setting of 80 kV with a dose reduction of 50% and 60%.
3.3.2. High contrast spatial resolution evaluation after ASIR-V application
The VCT phantom image was scanned with the parameters of an abdominal CT scan and variations were made on the tube voltage and dose reduction settings, then reconstructed with the ASIR-V settings and the size of the bar pattern was observed which could still be seen between one line and another clearly and the following data were produced as showed in Figure 8.
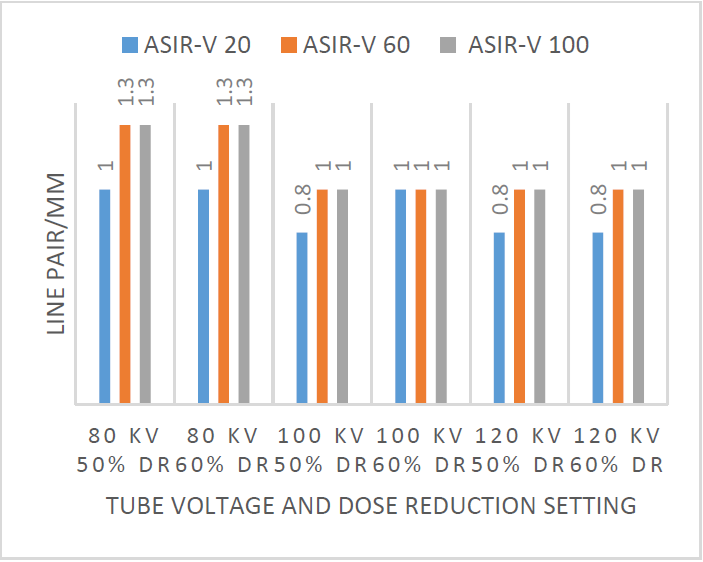
Based on the graph, the extreme contrast spatial resolution decreased in several groups after the ASIR-V reconstruction was applied and there were no results with improved extreme contrast spatial resolution after the ASIR-V reconstruction was conducted. Paired t-test between HCR images without using ASIR-V and images using ASIR-V showed that there were differences in extreme contrast spatial resolution in the 14 groups of combinations of tube voltage variations and dose reduction after ASIR-V reconstruction (20%, 60% and 100). Whereas in the comparison between images using tube voltage and dose reduction settings accompanied by ASIR-V compared to control images, the results obtained were 15 variations that had significant differences with the control group, HCR images that did not have significant differences, namely the combination of 100 kV DR 50% settings. ASIR-V 20%, 120 kV DR 50% ASIR-V 20% and 120 kV DR 60% ASIR-V 20%.
3.4. Low contrast detectability
3.4.1. Low contrast detectability evaluation using various tube voltage and dose reduction setting
Evaluation of low contrast detectability is generated by placing a grid-shaped ROI in a homogeneous area to obtain the minimum detectable contrast (MDC) value. Figures 9 show the placement of the ROI used to produce low contrast detectability images with the results of the minimum detectable contrast values presented in Figure 10 below.
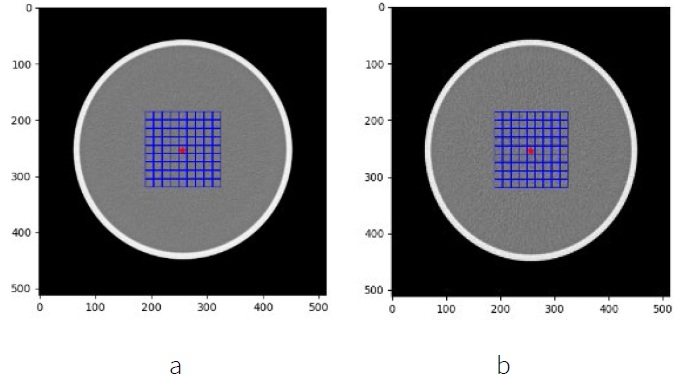
Figure 9 Low contrast detectability measured a) 80 kV, 220 mAs and 0% dose reduction (standard acquisition), and b) 80 kV and 60% dose reduction setting.
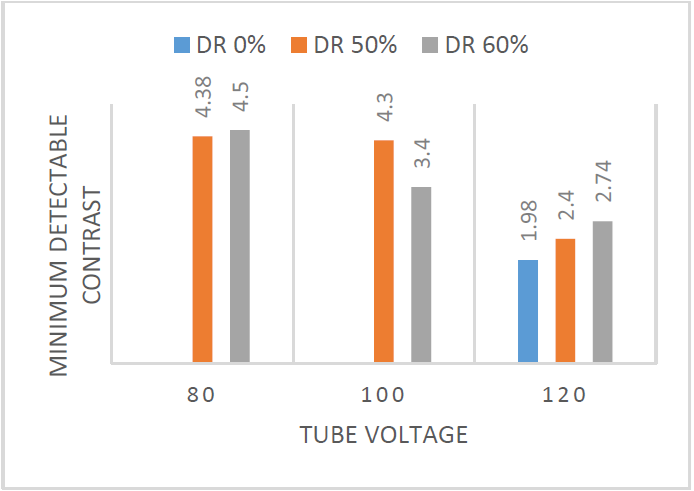
The lowest low contrast detectability value was produced by setting a tube voltage of 120 kV, 220 mAs and 0% dose reduction, namely 1.98, while the highest was produced by setting a tube voltage of 80 kV and 50% dose reduction, namely 4.5. The low contrast detectability average of the treatment group was 3.62.
3.4.2. Low contrast detectability evaluation after ASIR-V application
The VCT phantom image was scanned with the parameters of the CT scan examination, which were varied with the tube voltage and dose reduction settings, then reconstructed with the ASIR-V settings and the following data were produced as showed in Figure 11.
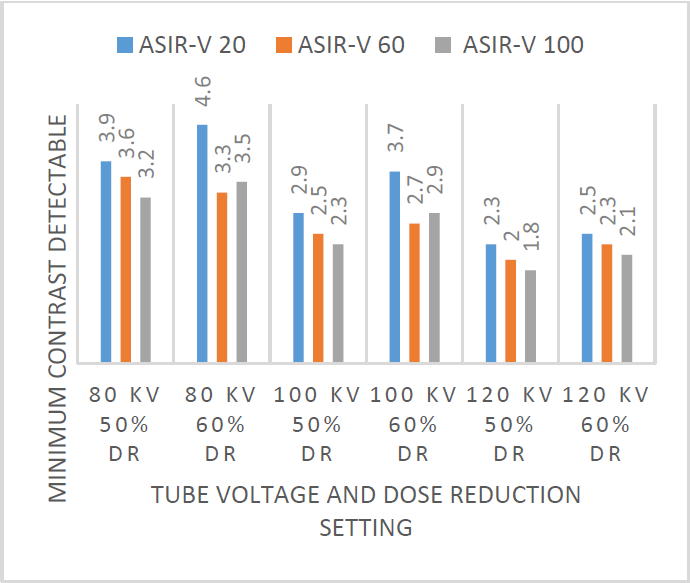
Based on Figure 11, the minimum contrast detectability value decreases in each group, so that the higher the ASIR-V value, the lower the minimum contrast detectability value. In the paired t-test that compared the LCD between the images before and after being given ASIR-V, it showed that 15 groups of combinations of tube voltage variations and dose reduction with ASIR-V (20%, 60% and 100%) had differences in low contrast detectability compared to the images before reconstruction. ASIR-V. In the table data after a different test with the paired t-test it can be concluded that the -value results obtained from 14 variations have differences with the control group, so it can be concluded that almost all variations have differences in low contrast detectability values with the control group except for a combination of settings 100 kV DR 60% ASIR-V 100%, 120 kV DR 50% ASIR-V 60%, 120 kV DR 50% ASIR-V 100% and 120 kV DR 60% ASIR-V 60%.
4. Discussion
4.1. Radiation dose profile in variations of tube voltage and dose reduction settings
In this study the researchers optimized the tube voltage and dose reduction values for the protocol with acceptable image quality at a lower dose value. So that it can be said that the decrease in dose that occurred in the treatment group ranged from 49% -84%. There is a decrease in the CT scan dose along with the reduced value of the tube voltage given, while dose reduction functions to reduce the value of the tube current so that the higher the dose reduction value setting, the tube current will decrease as well as the resulting dose. The lowest dose value was produced by the treatment group with a tube voltage setting of 80 kV and a dose reduction of 60% which resulted in a CTDIvol dose of 4.26 mGy.
Reduction of tube voltage and tube current are the 2 primary mechanisms for obtaining a reduced radiation dose in the use of CT scans (Froemming et al., 2013). This is evidenced by the dose reduction resulting from the application of a combination of tube voltage settings and dose reduction that occurred in the treatment group due to the tube voltage (kV) and tube current (mAs) affecting the quantity of X-rays produced.
In principle radiography tube current and scan time (mAs) are closely related to radiation dose and image quality. Increasing mAs will increase the dose proportionately, and vice versa. An increase in tube voltage can also increase the radiation dose, on the other hand the increase in energy resulting from an increase in tube voltage also affects the penetrating power of X-rays (Goldman, 2007).
4.2. Image quality in variations of tube voltage and dose reduction settings
4.2.1. Image noise
In CT Scan imaging, noise changes can be influenced by exposure factors, window settings, and pitch (De Marco & Origgi, 2018; Jensen et al., 2020). Changes in the noise value could happen when reducing the tube voltage and applying dose reduction. The smaller the tube voltage value used, the higher the noise produced, and the greater the dose reduction setting used, the noise value will also increase (Froemming et al., 2013). The mA value will change the intensity of the X-ray beam and the number of x-rays proportionally. On the other hand, increasing the tube voltage (kV) can increase the number of X-rays that penetrate the patient and reach the detector, so increasing the tube voltage (kV) can reduce image noise but can also reduce subject contrast (Goldman, 2007).
In the different tests performed, it appears that the noise value of the image before and after the ASIR-V reconstruction shows a significance value of <0.001, respectively. This shows that the use of ASIR-V with higher level will further reduce noise in the image and it can be concluded that there are differences in noise with variations in tube voltage settings, dose reduction and ASIR-V reconstruction on CT scans. The lowest noise value was produced by the treatment group with tube voltage settings of 120 kV and 50% dose reduction which initially had a noise value of 7.84, then after 100% ASIR-V reconstruction the image noise value decreased to 2.76. Noise reduction methods such as iterative reconstruction improve image quality so that a reduced dose can be achieved with image quality that can be maintained (Froemming et al., 2013).
Although it does not affect the number of detected X-rays, the reconstruction filter affects the appearance of noise in CT scan images. Smoothing type filters can obscure the appearance of noise and reduce its visual impact, while sharpening type filters can increase the appearance of noise. In soft tissue images, noise is more disturbing than blur in the image, so the application of a smoothing type of filter is suitable for improving the visual appearance of the image (Goldman, 2007). One example is the CT scan examination which is expected to be able to display an overview of the soft tissue organs that make up the organ systems in the abdomen35. The application of ASIR-V reconstruction can help improve the visual appearance of CT scan images in protocols that apply tube voltage reduction and dose reduction. So that it can produce acceptable image noise with a lower dose value.
4.2.2. High contrast spatial resolution
Extreme contrast spatial resolution on a CT scan is defined as the ability to distinguish small objects that are close together. The smaller the size of the bar pattern, which can be seen clearly, indicates that the spatial resolution of the image is better, and vice versa (Anam et al., 2022). Factors that are the main cause of decreased spatial resolution are the size of the X-ray tube focal spot and the blur that occurs at the image receptor (Goldman, 2007).
The results showed that a decrease in the tube voltage setting accompanied by an increase in the dose reduction setting can cause a decrease in the quality of extreme contrast resolution, which is indicated by the inability to clearly show the bar pattern with a smaller size. Meanwhile, in the different tests performed, the HCR of the image for each combination of tube voltage and dose reduction variations before and after the ASIR-V reconstruction showed that there was a decrease in the extreme contrast spatial resolution of the images in several groups. The combination variations that show a visual difference in HCR between before and after the application of ASIR-V are 80 kV, dose reduction 50% & ASIR-V 60%; 80 kV, dose reduction 50% & ASIR-V 100%; 80 kV, dose reduction 60% & ASIR-V 60%; and 80 kV, dose reduction 60% & ASIR-V 100% which experienced a decrease in HCR was marked by an evaluation of the bar pattern that appeared after the ASIR-V reconstruction was applied, namely a bar pattern measuring 1.3 mm, whereas previously a bar pattern with a size of 1mm; while the 100 kV group, 100 kV, dose reduction 50% & ASIR-V 20%; 100 kV, dose reduction 50% & ASIR-V 60%; 100 kV, dose reduction 50% & ASIR-V 100%; 100 kV, dose reduction 60% & ASIR-V 20%; 100 kV, dose reduction 60% & ASIR-V 60%; 100 kV, dose reduction 60% & ASIR-V 100%; 120 kV, dose reduction 50% & ASIR-V 20%; 120 kV, dose reduction 50% & ASIR-V 60%; 120 kV, dose reduction 50% & ASIR-V 100%; 120 kV, dose reduction 60% & ASIR-V 60%; 120 kV, dose reduction 60% & ASIR-V 100% experienced a decrease in HCR marked by an evaluation of the bar pattern that appeared after the ASIR-V reconstruction, namely you can see a bar pattern measuring 1 mm, whereas previously a bar pattern with a size of 0.8 mm was visible.
While pixel size can affect image resolution, the reconstruction filters used during reconstruction to remove noise from an image can often significantly affect image resolution. These filters are deliberately used to produce images that are a bit blurry or to give a smooth effect. This is because CT images that are too sharp or have too high a resolution are usually visually very disturbed by the noise generated by the image for some diagnostic evaluations (Goldman, 2007). Noise which is the fluctuation (standard deviation) of the CT number value in homogeneous tissue or material will affect the contrast resolution, the higher the noise, the contrast resolution will decrease (De Marco & Origgi, 2018; Jensen et al., 2020).
Based on the test results, it can be concluded that the application of ASIR-V reconstruction makes a difference in the spatial resolution of the image, but the difference provided cannot improve the quality of the extreme contrast spatial resolution image of the image. The use of ASIR-V on images with high noise can worsen the spatial resolution of the image due to the blurring or smoothing effect provided by the ASIR-V reconstruction, the higher the ASIR-V value setting, the stronger the blurring effect.
4.2.3. Low contrast detectability
Low contrast detectability on a CT scan is the ability to distinguish between materials with similar attenuation. The ability of a CT scan to visualize structures with low contrast is inherently limited by image noise (quantum mottle), the detection of small objects on a CT scan can be disrupted by noise in the image, especially when the image contrast is low (Goldman, 2007; Hernandez-Giron et al., 2015). The test is conducted is by evaluating the QA phantom water section. Statistically defined low contrast detectability (SD-LCD) is a measurement based on the assumption that a target with a certain size and density can only be distinguished from the background if the contrast value exceeds noise on the same spatial scale by a certain amount37. Measurements are made by placing a grid-shaped ROI in a homogeneous area to obtain a minimum detectable contrast (MDC) value in the specified ROI area ( Anam et al., 2022).
Based on the evaluation of low contrast detectability on images of variations in tube voltage and dose reduction settings, it shows that there are differences in low contrast detectability in CT scan images using abdominal examination parameters with differences in tube voltage settings and dose reduction settings. The lowest minimum contrast detectability value was produced by setting a tube voltage of 120 kV, 220 mAs and 0% dose reduction and the treatment group was setting a tube voltage of 120 kV, 220 mAs and 50% dose reduction, namely 1.98 while the highest was produced by setting a tube voltage of 80 kV and 50% dose reduction is 2.74. These data indicate that the use of variations in tube voltage settings accompanied by dose reduction settings causes differences in low contrast detectability.
VCT phantom images that have been evaluated for image quality are then reconstructed with ASIR-V values of 20%, 60%, 100%. In the different tests performed, the MCD image of each combination of tube voltage and dose reduction variations before and after ASIR-V reconstruction (20%, 60% and 100%) showed that there was a decrease in the minimum contrast detectability value in each group. so that the higher the ASIR-V value, the lower the resulting minimum contrast detectability value.
In the combination of tube voltage and dose reduction settings, there is a decrease in low contrast detectability caused by increased noise in this combination setting. The decline that occurred was in the range of 38% -127%. Whereas in the application of the ASIR-V algorithm, there is an increase in low contrast detectability that occurs when the noise in the image increases. This is because the detectability of low contrast CT scan images is influenced by exposure factors, slice thickness, FOV and algorithm reconstruction. In addition, low contrast detectability is also affected by the noise level of the image, the higher the noise, the lower the detectability of low contrast (De Marco & Origgi, 2018; Jensen et al., 2020).
4.3. Recommended combination for tube voltage, dose reduction and ASIR-V setting
A statistical test has been conducted between the control group and the treatment group that has been reconstructed with ASIR-V to compare image quality including noise, extreme contrast spatial resolution and low contrast detectability. The purpose of the different tests is to find out which combination of tube voltage, dose reduction and ASIR-V settings has the most similar image quality to the control group according to each category. Similar image quality was indicated by the results of the differential test which showed no significant difference in the image quality of the treatment group compared to the control group.
Based on the research data it can be concluded that the combination with image quality that is closest to the image quality of the control group is a combination of 120 kV tube voltage settings, 60% dose reduction and 60% ASIR-V which produces a radiation dose of 6.37 mGy. There is almost no significant difference in image quality in the group including noise and low contrast detectability. There is a slightly difference in high contrast spatial resolution of the treatment group compared to the control group, as indicated by the results of the evaluation which stated that in this group a bar pattern with a size of 1 mm could only be defined, while in the control group the smallest bar pattern that could be evaluated clearly was 0.8 mm.
The setting of tube voltage 120 kV, 60% dose reduction and 60% ASIR-V were chosen on the consideration that the abdominal protocol examination is used to evaluate organs with low contrast and not to focus on displaying high-resolution images. So that by using a combination of tube voltage settings of 120 kV, 60% dose reduction and 60% ASIR-V, a lower radiation dose of 6.37 mGy (59%) is obtained with image quality that resembles the control group with tube voltage settings of 120 kV, dose reduction. 0% which results in a dose of 15.57 mGy.
By using a combination of tube voltage settings and dose reduction accompanied by improved image quality using ASIR-V, it is hoped that radiographers will be able to produce CT scan radiographs with acceptable image quality and diagnostic information at the minimum possible dose. This is in accordance with the principle of dose optimization which is intended to ensure that the dose given to the patient is kept as low as possible (ALARA). The principle of optimization refers to reducing the radiation dose while maintaining the image quality required to make a diagnosis (Padole et al., 2015).
Efforts to optimize radiation dose which is often associated with image quality degradation can now be done by using iterative reconstruction such as ASIR-V. So that the increase in noise by reducing the tube voltage (kV) and tube current can be corrected by using this reconstruction. There are some drawbacks of its application, namely ASIR-V reconstruction which gives a blurring effect to image noise which can result in a decrease in the quality of spatial resolution, so that in examinations that require high detail and spatial resolution using ASIR-V reconstruction is possible to reduce image quality. While the advantages of applying ASIR-V include reducing noise in the image so that it can reduce the exposure factor associated with reducing the radiation dose received by the patient (Seeram, 2009).
5. Conclusions
Decreasing the tube voltage and increasing the dose reduction value results in a lesser radiation dose accompanied by a decrease in image quality, while the application of ASIR-V is proven to improve the quality of CT scan images including noise and low contrast detectability, in the other hand the excessive use of ASIR-V may also decrease high contrast spatial resolution of the image. The combination of image quality that is closest to the image quality of the control group is a combination of tube voltage settings of 120 kV, 60% dose reduction and 60% ASIR-V which produces a radiation dose of 6.37 mGy.

