


 nueva página del texto (beta)
 Inglés (pdf)
 Artículo en XML
 Referencias del artículo
 Enviar artículo por email
 Citado por SciELO
  Similares en
SciELO
Similares en
SciELO 
 Permalink
1. Introduction
The popularity of electric vehicles (EVs) is increasing due to their efficiency and cost-effectiveness compared to traditional internal combustion engines that contribute significantly to carbon emissions and environmental degradation. The use of batteries in EVs offers an opportunity to eliminate vehicular CO2 and NO2 emissions, which is crucial in a world dealing with climate change (Tian et al., 2022). EVs present both economic development challenges and opportunities. The battery capacity plays a significant role in the performance of EVs, and its temperature is a crucial factor. To improve the efficiency and reliability of batteries, it is essential to optimize their utilization and protection. The internal and external variables affecting the electric drivetrain, such as state of charge (SOC), internal resistance, battery voltage, current, and temperature, must be detected and analyzed (Liu et al., 2023). Battery temperature has a significant impact on the charging and discharging rate, and understanding the SOC is crucial for developing a control strategy. This paper presents the results of various data analysis and regression models used to predict the SoC and battery temperature of the BMW i3, which can help understand the battery's thermal behavior and design an effective battery management system (BMS) (Hannan et al., 2017). The estimation of state of charge (SoC) and battery temperature in electric vehicles (EVs) is a crucial task for battery management systems. In recent years, various research studies have been conducted to develop accurate and efficient methods for SoC and temperature estimation. This literature review will highlight some of the significant works in this field (Ghosh, 2020). In a study by Yang et al. (2022) a neural network-based approach was proposed for the estimation of SoC and temperature in lithium-ion batteries. The proposed approach uses a combination of long short-term memory (LSTM) and fully connected neural networks to estimate the SoC and temperature of a battery. The results showed that the proposed approach achieved high accuracy in both SoC and temperature estimation. Another study by Zhou et al. (2023) proposed a model-based approach for the estimation of SoC and temperature in a lithium-ion battery used in an EV. The proposed approach used a coupled electro-thermal model to estimate the battery's SoC and temperature. The results showed that the proposed approach achieved a high accuracy in SoC and temperature estimation, even under varying driving conditions. In a study by Song et al. (2022) a multi-model adaptive estimation approach was proposed for the estimation of SoC and temperature in EV batteries. The proposed approach used a combination of a Kalman filter and a particle filter to estimate the SoC and temperature of the battery. The results showed that the proposed approach achieved a high accuracy in SoC and temperature estimation, even under varying operating conditions. A study by Cai et al. (2022) proposed a dual-estimation approach for the estimation of SoC and temperature in EV batteries. The proposed approach used a combination of a Kalman filter and an unscented Kalman filter to estimate the SoC and temperature of the battery. The results showed that the proposed approach achieved high accuracy in SoC and temperature estimation, even under varying driving conditions. In conclusion, the estimation of SoC and temperature in EV batteries is a crucial task for BMSs. Various approaches, including neural network-based approaches, model-based approaches, and dual-estimation approaches, have been proposed for SoC and temperature estimation. These approaches have shown promising results in achieving high accuracy in SoC and temperature estimation, even under varying operating and driving conditions.
As batteries become increasingly crucial for energy transition and electric vehicles, buyers consider various factors when making their decisions, including pricing and battery infrastructure. One important factor is understanding the reliability, robustness, and performance of the electric vehicle, based on how long and how well its battery can perform before requiring charging or replacement (Tang et al., 2019).
Another critical factor is the EV's range, which can be affected by factors such as terrain, passenger load, driver behavior, and outdoor temperature. Therefore, understanding battery capacity, life, and internal resistance is essential in devising a control strategy that includes important indicators such as battery temperature and state of charge (SoC). Battery temperature significantly affects battery modeling because it can significantly impact the rate at which the battery charges and discharges, reducing battery life and the drivability of the vehicle. Accurate SoC estimation is critical for preventing battery overcharging and discharging and accurately forecasting the remaining range during a trip.
2. AI based SoC and temperature estimation
The proposed work aims to identify a supervised machine learning technique which utilizes the input data from the vehicle and predict accurate SoC and temperature. Regression analysis can be used to establish the relationship between dependent and independent variables and predict continuously changing values of the vehicle's battery state of charge and battery temperature.
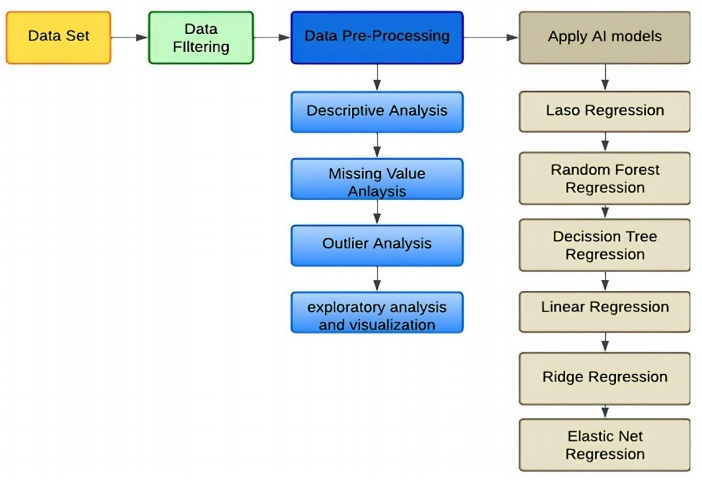
The schematic of the proposed work is shown in Figure 1. The dataset is sourced from IEEE Dataport and undergoes a process of data cleaning to remove corrupt or inaccurate records from the database. This involves replacing, altering, or deleting incomplete, inaccurate, or irrelevant portions of the data. Various algorithms are then applied to the data, ranging from linear models to tree-based models, to determine if any improvements can be made. The ultimate objective is to measure the accuracy of the model using different metrics such as mean absolute error (MAE), root mean squared error (RMSE), mean absolute percentage error (MAPE), and R-Squared Score, which provide additional insights. The data used for this study was obtained from IEEE Dataport and was used to validate a model for the BMW i3 (60 Ah), including readings from the powertrain and heating circuit. The dataset includes 72 recorded driving trips with the BMW i3 (60 Ah) and is divided into two categories: Category A, recorded in summer, which contains incomplete data due to measurement system issues, and Category B, recorded in winter, which contains consistent data. Therefore, this analysis focuses on Category B data and the overview dataset of Category A and Category B. Each trip in the dataset includes environmental data (e.g., temperature, elevation), vehicle data (e.g., speed, throttle), battery data (e.g., voltage, current, temperature, SoC), and heating circuit data (Dai et al., 2018).
3. Data processing
Raw data from the real world can be complex, containing errors and inconsistencies, and may not be uniformly structured. Therefore, data obtained from IEEE Dataport requires processing prior to modeling, which is a crucial first step in machine learning (Tom & Febin, 2023). This involves applying various data cleaning techniques, such as handling NaN values and duplicates. The process typically includes the following steps:
• Analyzing missing values
• Identifying and handling duplicate values
• Analyzing outliers
• Scaling the data
Incomplete or missing data can weaken the statistical power of analysis, affecting the validity of results by omitting crucial insights. To ensure data is reliable and relatable, it's essential to handle missing data using imputation methods or domain knowledge. For this dataset, SimpleImputer from scikit-learn was used to impute missing values, replacing NaN with a specified placeholder such as mean or median for numeric variables and mode for categorical variables. Duplicate values are repeated values in the same dataset, which can lead to overfitting and affect model efficiency. To identify and remove duplicate values, the duplicated method returns a set of true and false values indicating which rows are duplicated. This dataset had zero duplicate values. Outliers are extreme values that deviate significantly from other observations, affecting the model's efficiency.
It's important to perform outlier analysis to identify unusual observations and treat them appropriately. There are three types of outliers: global, contextual, and collective. Differences in scale between input variables can make modeling challenging. Scaling input variables depends on the problem and variable specifics. Normalizing and standardizing are the most common techniques used to scale numerical data before modeling. Normalization rescales data to range between 0 and 1, and Standardization rescales the distribution of values to have a mean of 0 and a standard deviation of 1, assuming a normal distribution. MinMaxScaler from scikit-learn is used for normalization, and StandardScaler is used for standardization, which subtracts the mean value of the data (Jawahar et al., 2022).
4. AI models for prediction
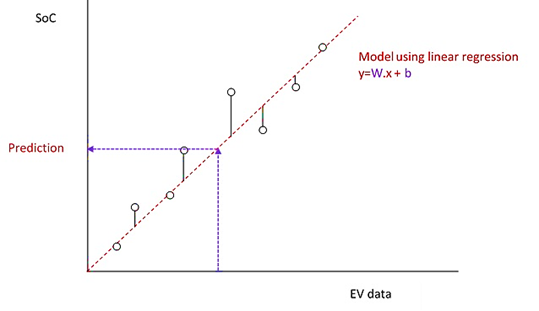
Linear regression analysis involves using one variable to make predictions about another variable. The dependent variable is the one being predicted, while the independent variable is the one used to make the prediction. In the linear regression model, the outcome (y) is influenced by a weight (W) assigned to the independent variable (x), as well as a bias (b). Figure 2 illustrates the linear regression model (Godbin & Jasmine, 2023).
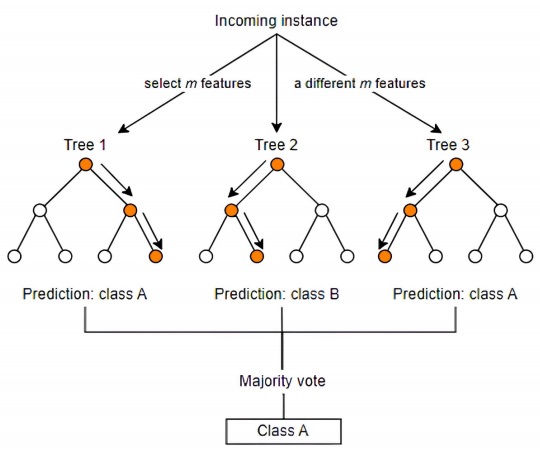
Random forest is a popular supervised machine learning algorithm used for classification and prediction of data. It builds decision trees using various samples, and in cases of regression, as depicted in Figure 3, it sorts and averages the data based on the majority vote outcome. One of its distinguishing features is its ability to handle datasets with both categorical and continuous variables. When it comes to classification problems, the random forest algorithm typically yields superior results (Deepthi & Febin, 2016).
Decision tree regression is used for both classification and regression problems. In regression problems, it is a non-parametric method that is useful in building a model that maps an input to an output using a tree-like structure. The decision tree model starts with a single node called the root node that represents the entire dataset. The decisión tree regression model is depicted in Figure 4. The tree structure is built by recursively splitting the dataset into smaller subsets based on the value of a chosen feature, with the aim of minimizing the variance of the response variable. Each internal node in the tree represents a feature, and the branches emanating from that node represent the possible values of that feature. The leaves of the tree represent the predicted value of the response variable for a given set of input values. The decision tree regression model is shown in Figure 5.
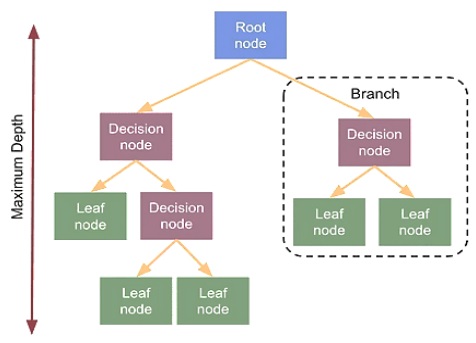

One of the advantages of the decision tree regression model is its interpretability. It provides a clear understanding of the decision-making process and the underlying features that contribute to the prediction. It can also handle non-linear relationships between the input and output variables.
One of the regression methods in machine learning is ridge regression, often utilized when there is strong correlation among independent variables. This technique is effective in dealing with multicollinear data since it leverages least square estimates, producing unbiased values. However, in situations where collinearity is exceptionally high, bias values may still arise.
To address this, a bias matrix is incorporated into the ridge regression equation. This approach is highly robust and reduces the risk of overfitting in the model. The ridge regression contour is represented in Figure 5.
Lasso regression, also known as L1 regularization, is a type of linear regression model that helps to estimate the relationship between a dependent variable and a set of independent variables. The goal of lasso regression is to select a subset of independent variables that are most important in predicting the dependent variable, while shrinking the coefficients of the remaining variables to zero. The lasso regression model adds a penalty term to the standard linear regression equation, which penalizes the sum of the absolute values of the coefficients of the independent variables. This penalty term encourages the model to eliminate the coefficients of irrelevant variables and reduces the influence of noisy or redundant variables. Lasso regression selects only a subset of variables and avoids overfitting, leading to improved prediction accuracy and interpretability. The contours of error and constraint functions are shown in Figure 6.

The elastic net regression model is created by augmenting the traditional linear regression equation with both lasso and ridge regularization terms. The lasso penalty minimizes the coefficients of irrelevant features to zero, resulting in sparsity, while the ridge penalty reduces the coefficient magnitudes to prevent overfitting. An advantage of the elastic net regression
model is its capability to handle datasets with high multicollinearity, where predictor variables are highly correlated. Lasso regression may choose only one of the correlated features, while ridge regression tends to give similar weights to all correlated features. The elastic net regression achieves a balance between these approaches and is more effective at handling correlated features (Febin et al. 2016).
5. Results and discussion
The dataset retrieved from IEEE Dataport was partitioned into three sets: training, validation, and testing. The training set was comprised of a total of 64,486 data values and was split in an 85:15 ratio between the training and validation sets, respectively. After processing and scaling the dataset, various analyses were conducted to assess the target variable and its correlation with other independent variables (). Through the exploration of existing features and the creation of novel ones, the predictive capabilities of the model were notably enhanced. The simulations were carried out under diverse test cases, and the EV parameters, including SoC and temperature, were graphed. The experiments were performed at different load conditions by altering the load connected to the 60Ah rated battery. It is worth noting that fluctuations in temperature can impact the battery's performance.
Figure 7 through Figure 12 exhibit a comparison between the predicted and actual state of charge (SoC) percentages using distinct models, namely linear regression, decision tree, random forest, elastic net, lasso regression, and ridge regression. Correspondingly, Table 1 shows the performance metrics considering R2 score, mean absolute error (MAE), mean squared error (MSE), and root mean squared error (RMSE). It can be observed that the SoC estimation models were able to estimate the values correctly. The advantage of lasso regression is that it can help to reduce dimensionality within a dataset by shrinking the weight parameters to zero, eliminating less important features from the model. The lasso regression model stands out for its superior predictive capabilities. This is substantiated by its highest R2 score, signifying its ability to account for 99.4% of the data's variability. Moreover, it records the lowest MAE, MSE, and RMSE values, attesting to its remarkable accuracy. Notably, the lasso regression model leverages L1 regularization, which curtails the influence of less significant features and mitigates overfitting issues. The ridge regression model also performed well in the SoC estimation. The advantage of this model is that the datasets that have many correlated features can be modeled accurately.
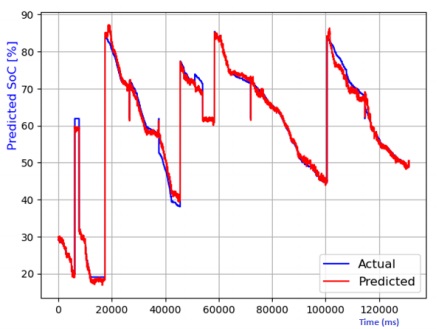
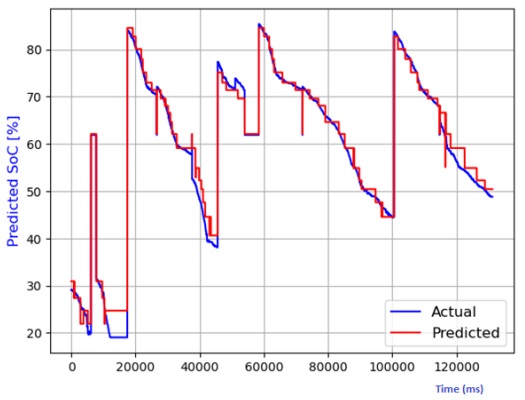
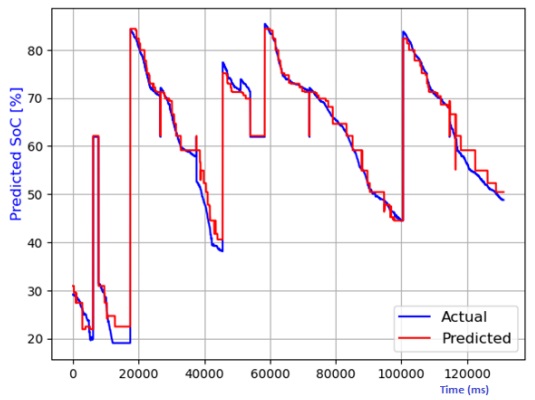
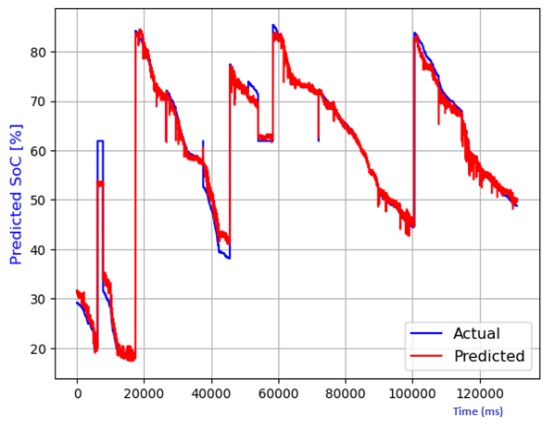
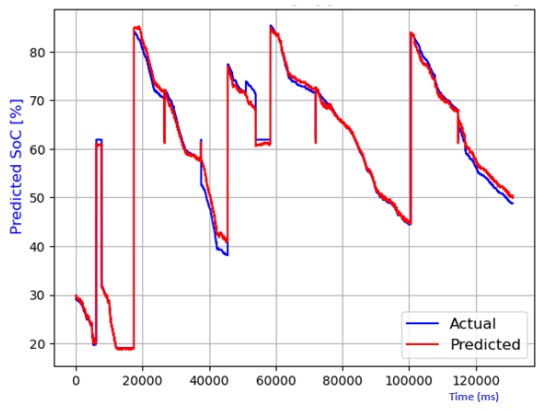
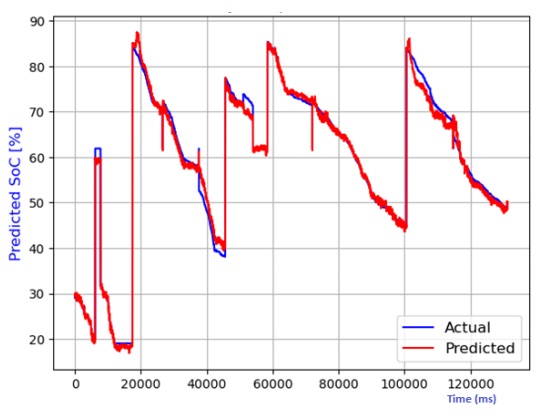
Table 1 Performance comparison of various models for SoC temperature estimation.
| Model | R2 Score | MAE | MSE | RMSE |
|---|---|---|---|---|
| Linear regression | 0.94323 | 0.53495 | 0.49056 | 0.63457 |
| Decision tree | 0.930485 | 0.43456 | 0.41064 | 0.5234 |
| Random forest | 0.930384 | 0.45658 | 0.38956 | 0.58790 |
| Elastic net | 0.956272 | 0.49056 | 0.42967 | 0.61345 |
| Lasso regression | 0.976745 | 0.43497 | 0.31245 | 0.49345 |
| Ridge regression | 0.963738 | 0.47048 | 0.32343 | 0.5238 |
The analysis also extends to the estimation of battery temperature using diverse AI models. The comparison between predicted and actual temperatures is depicted in Figures 13 to 20, encompassing linear regression, decision tree, random forest, elastic net, lasso regression, and ridge regression models. Performance metrics, including R2 score, MAE, MSE, and RMSE, are compiled in Table 2 for each model. Notably, the lasso regression model emerges as the most adept at predicting battery temperature, boasting the highest R2 score and the lowest values for MAE, MSE, and RMSE. While ridge regression exhibits a higher R2 score, it lags lasso regression in predicting battery temperature due to its comparatively elevated average prediction errors
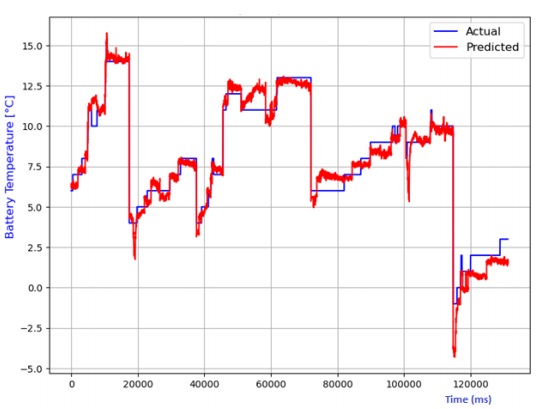
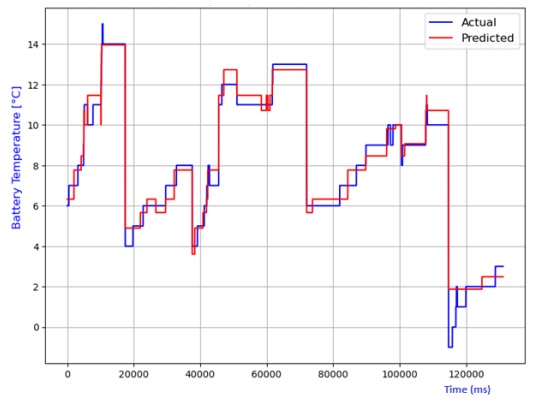
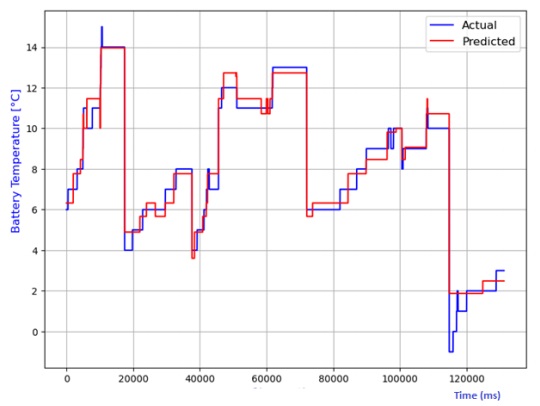
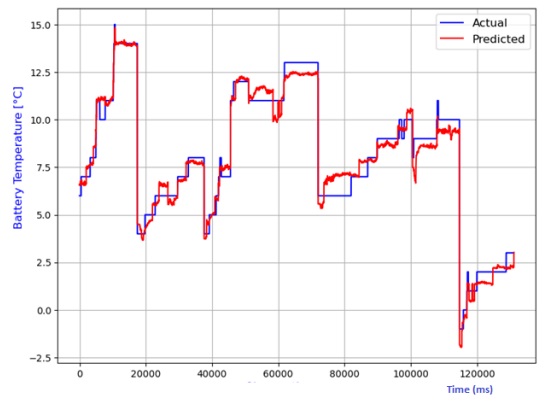
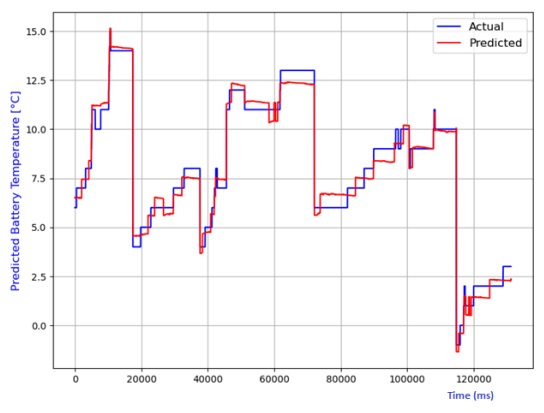
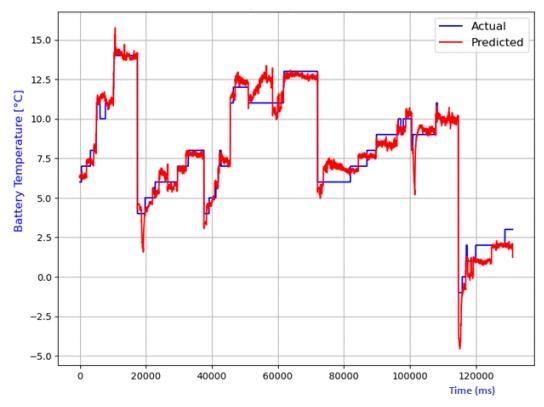
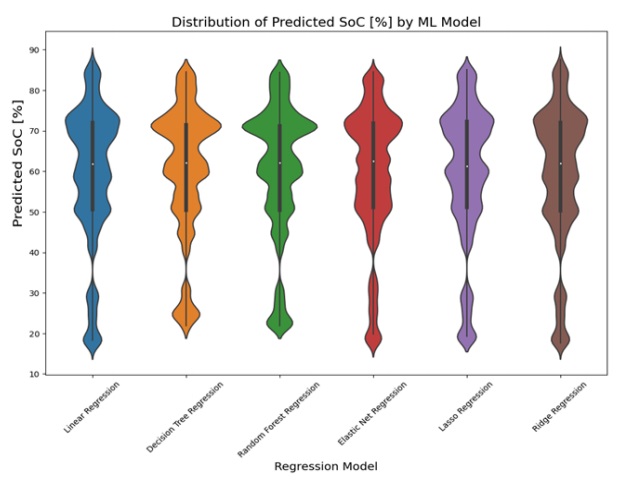
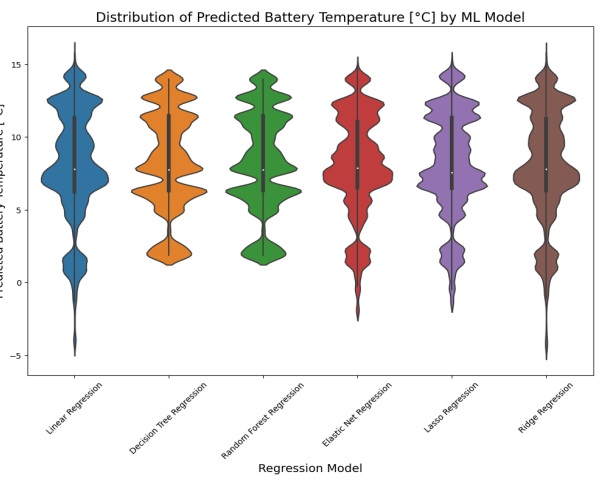
Table 2 Performance comparison of various models for battery temperature estimation.
| Model | R2 Score | MAE | MSE | RMSE |
|---|---|---|---|---|
| Linear regression | 0.96034 | 0.54453 | 0.50354 | 0.70960 |
| Decision tree | 0.971724 | 0.46390 | 0.35990 | 0.59920 |
| Random forest | 0.971747 | 0.46333 | 0.35875 | 0.59895 |
| Elastic net | 0.961645 | 0.52537 | 0.48701 | 0.69786 |
| Lasso regression | 0.980952 | 0.44154 | 0.24186 | 0.49180 |
| Ridge regression | 0.975033 | 0.47048 | 0.31701 | 0.56304 |
The violin plot displayed the predicted values for each AI model. The plot for predicting state of charge (SoC) was shown in Figure 19, while the plot for estimating battery temperature was shown in Figure 20. The lasso regression model had the narrowest part in the violin plot, indicating the least variability in predicted values, which was consistent with its low values for MAE, MSE, and RMSE in the results table. On the other hand, the random forest regression and decision tree regression models had wider parts in their violin plots, suggesting more variability in predicted values. However, they still had relatively high probability densities near their median predicted values, indicating good predictive performance.
6. Conclusion
Predicting the SoC in lithium-ion batteries stands as a pivotal element within electric vehicle battery management systems, exerting a direct influence on vehicle performance. This investigation utilizes three AI-driven algorithms: linear regression, random forest, decision tree, as well as lasso, ridge, and elastic net regression models to anticipate both battery SoC and temperature. The comparison of results with respect to various performance indices is presented in Table 1 and Table 2. It can be observed that all the models investigated in the paper were able to estimate the SoC and battery temperature of the vehicle. However, the lasso regression model stands superior compared to the other models investigated in this work. The proposed machine learning models enable the analysis of non-linear mapping of input features, such as voltage and current, for SoC estimation. AI algorithms are preferred for SoC estimation due to their effective handling of non-linear data. In the future, a robust neural network could be trained on this dataset for improved performance, as neural networks can capture non-linearities and accurately fit the underlying function. Additionally, exploring and implementing real-time scaling for this project is a potential avenue for future research.

