


 nueva página del texto (beta)
 Inglés (pdf)
 Artículo en XML
 Referencias del artículo
 Enviar artículo por email
 Citado por SciELO
  Similares en
SciELO
Similares en
SciELO 
 Permalink
1. Introduction
Bentonite is a natural clay mineral that is employed widely as an adsorbent for cations, radioactive substances, and harmful organic substances, as well as a lubricant for drilling tools at civil engineering construction sites (Amutenya et al., 2022; Erdoğan & Demirci, 1996; Kexin et al., 2019; Liu et al., 2022; Shirazi et al., 2020); essentially, more than 20 million tons of bentonite are used annually (Idoine et al., 2016). The wide applicability of bentonite is owing to the structure of montmorillonite, which is the major component of bentonite (Thuc et al., 2010). Montmorillonite is a layered clay mineral, wherein an octahedral alumina layer is sandwiched between tetrahedral silica layers. In addition, montmorillonite is negatively charged because part of the Si4+ in the tetrahedral silica layer and the Al3+ in the octahedral alumina layer are replaced by Al3+ and Fe2+ or Mg2+, respectively (Olphen, 1964a; Duman & Tunç, 2009). Since montmorillonite has a negative charge, it maintains an electrical balance by adsorbing alkali and alkaline earth cations, such as Na+, Ca2+, and Mg2+, between the layers (M’bodj et al., 2004; Shaikh et al., 2018). These cations readily get exchanged with other cations in water. Na-type bentonite, i.e., bentonite that contains Na+ as an interlayer cation, is the most natural bentonite and has high dispersibility and swelling in water; therefore, Na-type bentonite suspensions are useful as drilling fluids. However, bentonite wastewater produced from industrial sources cannot be discharged into natural water sources owing to its aforementioned properties (Boylu et al., 2010; Shaikh et al., 2017a; Thuc et al., 2010). Direct discharge of stably dispersed bentonite wastewater into the natural environment without proper treatment can adversely affect the health of aquatic organisms (Al-Risheq et al., 2022a; Chatterjee et al., 2009; Ministry of Environment in Japan, n. d.). Hence, separation of bentonite particles from suspension is necessary; however, bentonite forms highly stable colloidal clay suspensions, thus rendering difficulty in its separation (Al-Risheq et al., 2022a; Shaikh et al., 2017b). Therefore, flocculants are used to form large flocculates and quickly separate bentonite from the suspension. Filtration of suspensions containing large flocculates can be performed rapidly while suppressing clogging (Besra et al., 2003).
There are many reports on the use of electrolytes, metal ions and polymer flocculants to flocculate bentonite with highly dispersible (Al-Risheq et al., 2022b; Duman & Tunç, 2009; Gorakhki & Bareither, 2015; Lagaly & Ziesmer, 2003; Shamlooh et al., 2020; Wilkinson et al., 2017). Among them, the use of positively charged polymer flocculants, such as cationic polyacrylamide (Shaikh et al., 2017a; Shaikh et al., 2018; Wilkinson et al., 2017) and cationic guar gum (Levy et al., 1995; Nakamura et al., 2020; Zhang et al., 2013), increased the flocculation rate of bentonite and decreased the turbidity of the supernatants solution. In our previous study, flocculation and filtration tests were performed using guar gum or cationic guar gum as flocculants (Nakamura et al., 2020). In flocculation and filtration tests of a 0.5 wt% bentonite suspension with 50-500 ppm of guar gum, bentonite precipitation was not observed after 30 min, and the shortest filtration time was 1 h. On the other hand, the addition of 200 ppm of cationic guar gum formed bentonite flocculates over 1 mm, and the filtration time was shortened down to 4 min due to improved permeability of filter cake. In addition, when 0.5 wt% bentonite suspension was filtered with poly(N,N-diethylaminomethyl methacrylate), which is positively charged lower than pH 8, and CaCl2 as flocculants, the filtration rate increased with increasing concentration of flocculants (Bonczek et al., 2002). This is because the cationic flocculants absorbed negatively charged bentonite and the flocculation effect of bentonite was promoted (Shaikh et al., 2017a; Shaikh et al., 2018). It is also known that cationic ions and surfactants are adsorbed between the layers of montmorillonite, which is the main component of bentonite (Bonczek et al., 2002; de Paiva et al., 2008; Wijayanto & Nakashima, 2022; Xi et al., 2004). In this way, there are respective reports for the effect of cationic flocculants on bentonite flocculation and filtration, and the adsorption on bentonite. However, the relationship among the adsorption of cationic flocculants on bentonite, their flocculation and filtration rates has not been clarified. Herein, it is guessed that the use of polymer flocculants has a complicated structure to evaluate the relationship, and an accurate determination of the mechanism is difficult, so cationic surfactant with small molecular, hexadecyltrimethylammonium bromide (CTAB: C16H33N(CH3)3Br), has attracted attention.
In this study, flocculation and filtration tests were performed using CTAB, which is cationic small molecules, as flocculates, and the properties of the bentonite flocculates were evaluated under different CTAB concentrations and pH values. Furthermore, the flocculation and filtration mechanism of bentonite and adsorption mechanism of CTAB was discussed based on the results obtained, and the relationship was evaluated.
2. Materials and methods
2.1. Material
Natural Na-type bentonite mined at Gunma prefecture in Japan was used in this study. The particle size distribution of bentonite was measured using the laser diffraction/scattering method (Microtrac BEL, MT3300EX II), and its particle size range was 0.75-125 μm. In addition, the representative metal oxide composition of bentonite was determined by X-ray fluorescence (XRF) (Shimadzu, XRF-1700), as listed in Table 1. The hydrochloric acid used for pH adjustment was purchased from Nacalai Tesque Ltd., and CTAB was purchased from Fujifilm Wako Pure Chem. Ind. Ltd.
2.2. Flocculation test and characterization of flocculates
Bentonite (0.5 g) and distilled water (40 mL) were added to a 50 mL graduated cylinder; the graduated cylinder was shaken many times until there were no aggregates of bentonite at the bottom of the cylinder, and then bentonite was completely dispersed. The pH of bentonite suspension was 11 and hydrochloric acid (5 wt%) was added to adjust the pH to 4 or 7. An amount of 100-2000 ppm CTAB was added, and the graduated cylinder was filled to 50 mL with distilled water. The suspension was shaken manually and left to stand in a thermostatic bath at 25 °C for 20 min. After taking a bath and shaking again manually, flocculation tests were conducted at 25 °C for 30 min. Subsequently, 10 mL of the supernatant solution was collected from a height of 30 mL from the bottom, and the turbidity was measured using a turbidity meter (Thermo Scientific, TN-100).
2.3. Filtration test
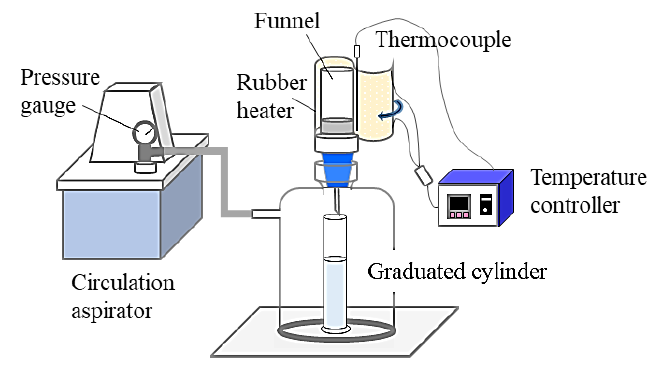
Bentonite (1 g) and distilled water (85 mL) were added to a 100 mL graduated cylinder, and the cylinder was shaken until we can confirm that there were no lump of bentonite at the bottom of the cylinder. Five wt% hydrochloric acid was added to the cylinder until pH was 4. The graduated cylinder was filled to 100 mL with distilled water after 100-2000 ppm CTAB was added to the cylinder. The bentonite suspension (100 mL) was prepared and left to stand in a thermostatic bath at 25 °C for 20 min. The suspension was shaken manually after taking from the bath and filtered at 0.05 MPa by the filtration equipment shown in Figure 1, and the time required for the filtrate volume to reach 90 mL was measured. A membrane filter with a filtration area of 11 cm2 and retained particle size of 0.8 μm was used. The funnel was covered with a rubber heater to maintain a filtration temperature of 25 °C.
2.4. Characterization of bentonite flocculates
A bentonite suspension was prepared under the same conditions as in the flocculation test. The suspension was allowed to stand in a thermostatic bath at 25 °C for 20 min. This suspension was taken from the bath and poured into a plastic container, and the bentonite flocculates were observed using an optical microscope (3R-MSBTVTY, 3R solution Corp., Japan). The particle size of the bentonite flocculates was photographed using a microscope with autofocus adjustment function, and the average particle size was calculated. The particle size distribution of bentonite was calculated using the Gaussian distribution, as shown in Equation (1).
Where x is the particle size of the bentonite flocculate; σ is the standard deviation; and µ is the average particle size.
After a flocculation test for 30 min, the supernatant was removed from the graduated cylinder. The bentonite flocculates were subsequently filtered and dried overnight at 20-25 °C. After that, the bentonite particles were crushed. The chemical structures of dry-bentonite were analyzed by Fourier transform infrared spectrometer (FTIR, Shimadzu, IRAffinity-1). Potassium bromide 2 g and the sample 0.01 g were mixed, and the sample pellets were prepared by molding the mixture 0.1 g at 3 t by a hydraulic press. FTIR spectra for each sample were measured in adsorption mode at 4000-400 cm-1 using 32 scans with 2 cm-1 resolution.
The lattice spacings of the raw bentonite and the flocculates were measured using X-ray diffraction (XRD) analysis (Rigaku, UltimaIV) with CuKα radiation at 40 kV and 40 mA. Each sample was scanned from 3° to 20° at intervals of 0.02° at a rate of 10°/min. The lattice spacing of (001) (d001) of bentonite was calculated using Bragg’s equation, as follows.
Where n is an integer (n = 1); λ is the X-ray wavelength (λ = 0.154 nm); and 𝜃 is the angle of incidence.
The amount of CTAB adsorbed in the bentonite flocculates was calculated from the weight loss obtained by thermogravimetry (TG) (Shimadzu, TGA-50) at 10 °C /min up to 900 °C under a 35 mL/min flow of air. To eliminate weight, change due to the loss of moisture adsorbed on the bentonite surface, the sample weight after holding at 150 °C for 10 min was set to 100 wt%.
3. Result
3.1. Flocculation and filtration bentonite
Figure 2 and Figure 3 show images of the bentonite flocculation test and turbidity of the supernatant solution after 30 min, respectively. In the absence of CTAB, flocculation of bentonite was not observed at pH 11, whereas the supernatant solution and precipitated bentonite flocculates were separated at pH 4 and the turbidity of the supernatant solution was reduced to 167 NTU (nephelometric turbidity units). When CTAB was used, the separation of the supernatant solution and the sediment of flocculates was observed with increasing CTAB concentration at pH 11, and the turbidity of the supernatant solution was <50 NTU at CTAB concentrations of ≥1500 ppm. In contrast, the turbidity of the supernatant solution at pH 4 was 51 NTU with CTAB 500 ppm, which changed negligibly even with CTAB concentration >500 ppm.
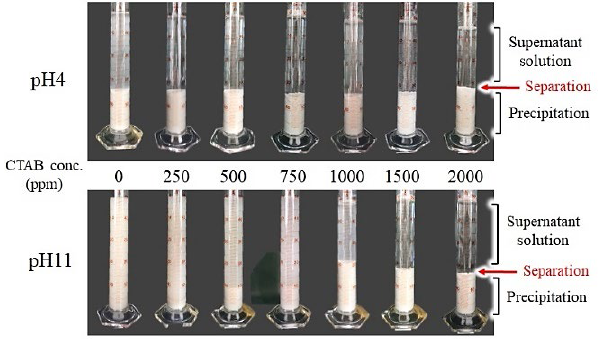
Figure 2 Images of bentonite suspension after 30 min of flocculation test under different pH and CTAB concentration.
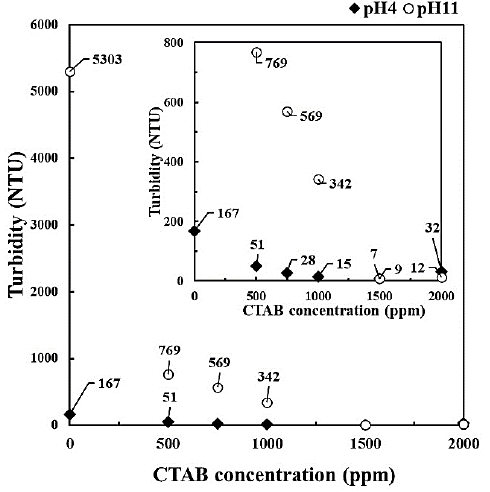
Figure 3 Turbidity of supernatant solution after 30 min of flocculation test under different pH and CTAB concentration.
The filtration time of the bentonite suspension under different pH values and CTAB concentrations is shown in Figure 4. The filtration time without CTAB exceeded 2 h regardless of pH. When CTAB was used, the filtration time was reduced with increasing CTAB concentration and decreasing pH, and the filtration time with CTAB of 1000 ppm was 4.9 min at pH 4; it was more than 40 min lesser than that at pH 11. At CTAB concentration of ≥1500 ppm, the filtration time was reduced to 2.4-3.5 min regardless of pH. The surface state of bentonite cake after filtration is shown in Figure 5. The cake surface with CTAB 250 ppm was observed to be wet and smooth. However, the cake surface became rougher with increasing CTAB concentration from the smooth state. Furthermore, the cake surface at pH 11 with 1000 ppm of CTAB and pH 4 with 750 ppm was observed to be rough, and at pH 4 became rougher at lower concentrations compared with pH 11. The increase of roughness on the bentonite surface indicates that drainage from the bentonite cake was promoted and the permeability of its cake increased. Therefore, the increase of CTAB concentration at pH 4 progressed the permeability of the cake and shortened the filtration time.
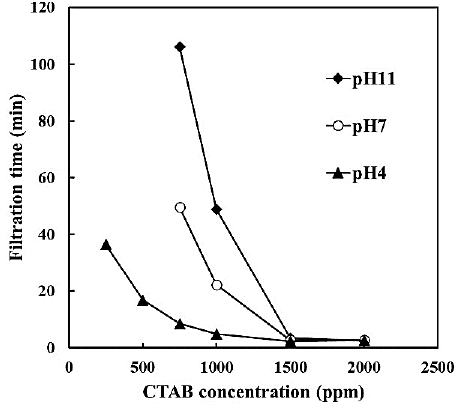
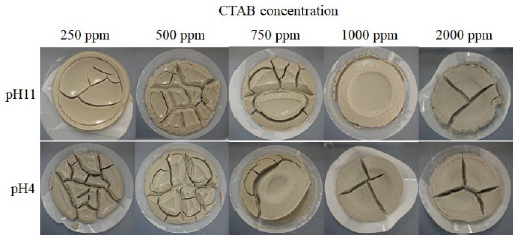
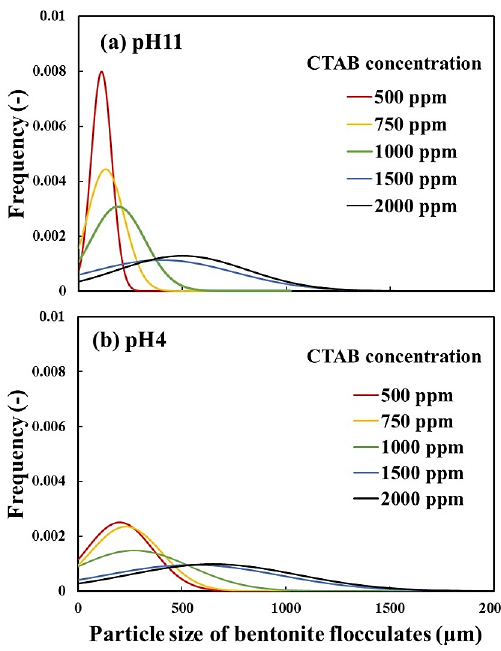
Figure 6 shows the micrographs of the bentonite flocculates. The bentonite in suspension without CTAB remained as fine particles regardless of pH. Bentonite flocculates formed with CTAB of 500-1000 ppm at pH 11 were fragile and easily disintegrated upon shaking. In contrast, at pH 4, bentonite flocculates were partially observed at a CTAB concentration of 100 ppm and transformed into a round, large, and less collapsed state between 500 and 1000 ppm concentration. In the range of 1500-2000 ppm CTAB concentration, the size of bentonite flocculates became larger irrespective of pH, and flocculates larger than 1 mm were observed, particularly at 2000 ppm. With careful attention to the formed flocculates, the secondary flocculates were observed to be formed by the gathering of small flocculates (primary flocculates). In addition, from the particle size distribution of bentonite flocculates, as shown in Figure 7, the flocculate size increased with increasing CTAB concentration, and at pH 4, the size was larger than that at pH 11.
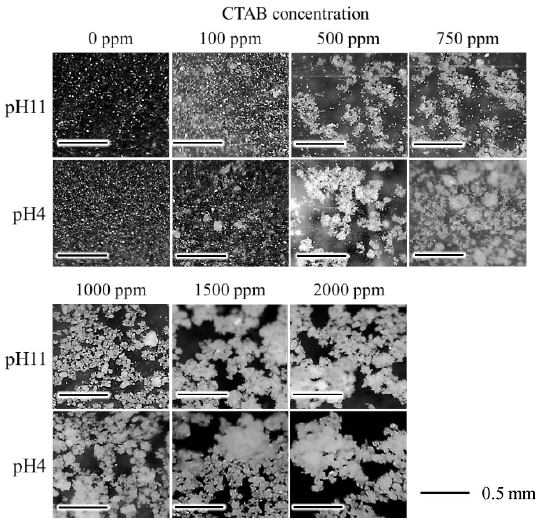
Figure 6 Micrograph of bentonite flocculates with CTAB 0-2000 ppm at pH 4 and pH 11 (Scale bar is 0.5 mm).
From the above results, we conclude that the bentonite flocculates became larger with decreasing pH and increasing CTAB concentration, thereby resulting in low turbidity of the supernatant solution by increasing the sedimentation rate of the bentonite flocculates. Furthermore, the roughness of the cake surface suggests that the porosity of the bentonite cake increased owing to the formation of large flocculates, and the enhanced water permeability of the cake increased the filtration rate.
3.2. Characterization of bentonite flocculates and the effect of pH and CTAB concentration
FTIR spectra and peaks of each sample are shown in Figure 8 and Table 2. In the FTIR spectra of bentonite and bentonite flocculates with CTAB, peaks of 3440-3462 and 1633-1640 cm-1 were attributed to O-H stretching and bending vibration due to water adsorbed in bentonite surface (Alabarse et al., 2011; Li et al., 2015; Shettigar et al., 2018; Xue et al., 2007; Zhu et al., 2021). For this reason, it was found that moisture is present in bentonite. In addition, peaks of 2924-2940, 2851-2857 and 1472-1479 cm-1 for bentonite flocculates were assigned to asymmetric stretching, symmetric stretching, and bending vibration of -CH2 groups in the alkyl chain derived from CTAB. Hence, it was confirmed that CTAB is adsorbed in bentonite.
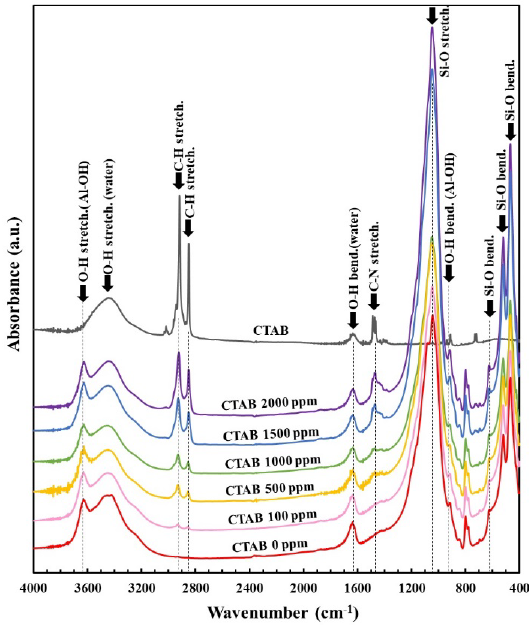
Table 2 The main absorption types of CTAB, bentonite and CATB adsorbed bentonite.
| Wavenumber (cm-1) | |||
| Absorption type | CTAB* | Bentonite** | CTAB adsorbed
bentonite (CTAB: 100-2000 ppm) |
| O-H stretching vibration from Al-OH | 3635 | 3631-3633 | |
| O-H stretching vibration derived from water | 3445 | 3422 | 3440-3462 |
| C-H stretching vibration | 3018 2918 2850 | 2924-2930
2851-2857 |
|
| O-H bending vibration from water | 1630 | 1638 | 1633-1640 |
| C-N stretching vibration | 1480 | 1472-1479 | |
| Si-O stretching vibration | 1079
1042 |
1045-1049 | |
| O-H bending vibration from Al-OH | 916 | 916-918 | |
| quartz impurity | 799 | 797-799 | |
| Si-O bending vibration from Si-O-Al or Si-O-Mg | 623
521 467 |
622-624
521-522 466-468 |
|
Figure 9 shows the XRD patterns of bentonite flocculates. The (001) lattice spacing without CTAB (d001) was 1.23 nm at pH 11 and 1.47 nm at pH 4. It is reported that a peak is observed at 2𝜃 = 7-7.5 degree (d001 = 1.18-1.26 nm) when one layer of water molecules is intercalated between the montmorillonite layers (Bonczek et al., 2002; Devineau et al., 2006; Holmboe et al., 2012; Laird, 2006; Parolo et al., 2014; Xi et al., 2004). Hence, water molecules were intercalated into dry bentonite obtained at pH 11 in this study. In the case at pH4, protons in hydrochloric acid were replaced with exchangeable cations and attacked the montmorillonite layers, thereby resulting in the release of the central atoms from the tetrahedral and octahedral layers into the interlayers as hydrated cations, such as Mg2+, Al3+, and Fe3+ (Komadel, 2016; Pentrák et al., 2018). Additionally, d001 increased from 1.39 nm to 1.80 nm in the 500-1500 ppm concentration range of CTAB. As shown in Figure 10, since the unit cell of montmorillonite, which is the main component of bentonite, is 0.96 nm (Lee & Kim, 2002), the interlayer distance of montmorillonite is 0.43 nm at d001 = 1.39 nm, and 0.84 nm at d001 = 1.80 nm, thus indicating that the layer spacing in montmorillonite doubled as the CTAB concentration increased. In previous reports of CTAB adsorption on bentonite (Bonczek et al., 2002; Ouellet-Plamondon et al., 2014; Xi et al., 2004), it is known that d001 = 1.34-1.45 nm and d001 = 1.77-1.80 nm indicates monolayer and bilayer adsorption of CTAB, respectively. d001 values in this study were like that previous report, indicating that the adsorption of CTAB into the interlayer changed from monolayer to bilayer with increasing CTAB concentration.
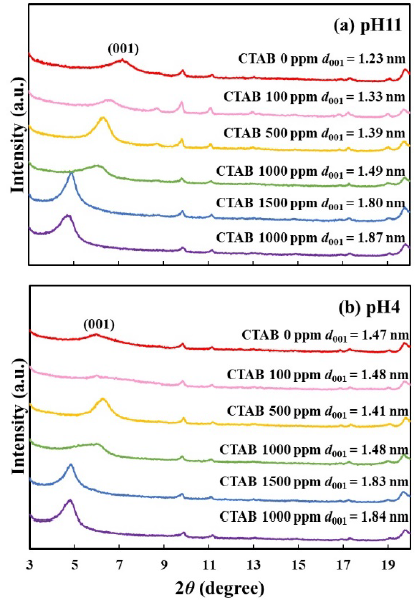
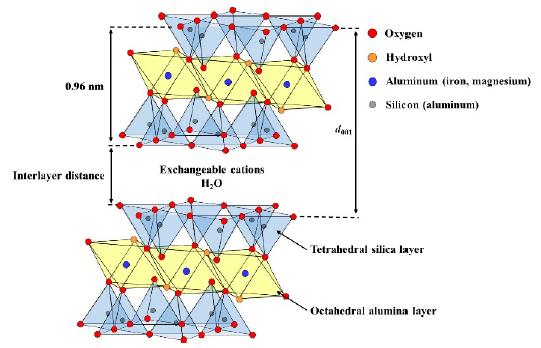
Figure 11 shows the TG profiles of bentonite flocculates. Although minimal difference in the weight loss ratio was observed owing to the difference in pH, the weight loss ratio increased with increasing CTAB concentration, and the amount of CTAB adsorbed in the bentonite flocculates also increased. To investigate the adsorption sites of CTAB, Figure 12 shows the DTG profiles at 150-450 °C, where CTAB was decomposed. Additionally, the DTG profiles were separated using the Gaussian distribution in Equation (1). The DTG profiles were separated into four temperature ranges: (I) 220-260, 270-300, 330-340, and 350-380 °C. At CTAB concentration of 500 ppm, a large weight loss was observed in the two temperature regions of peaks (III) and (IV), and at CTAB 1000 ppm, the weight loss at peak (II) increased. Furthermore, Figure 13 shows the peak area obtained by the waveform separation. The areas of peaks (IV) and (III) increased up to 500 ppm and 1000 ppm, respectively, and then remained constant, whereas the area of peak (II) increased from 1000 ppm. At pH 4 or pH 11, no difference in the weight loss ratio and temperature range was observed, thus suggesting that the adsorption capacity of CTAB on bentonite did not depend on the pH.
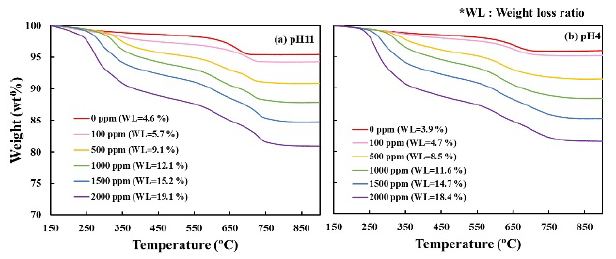
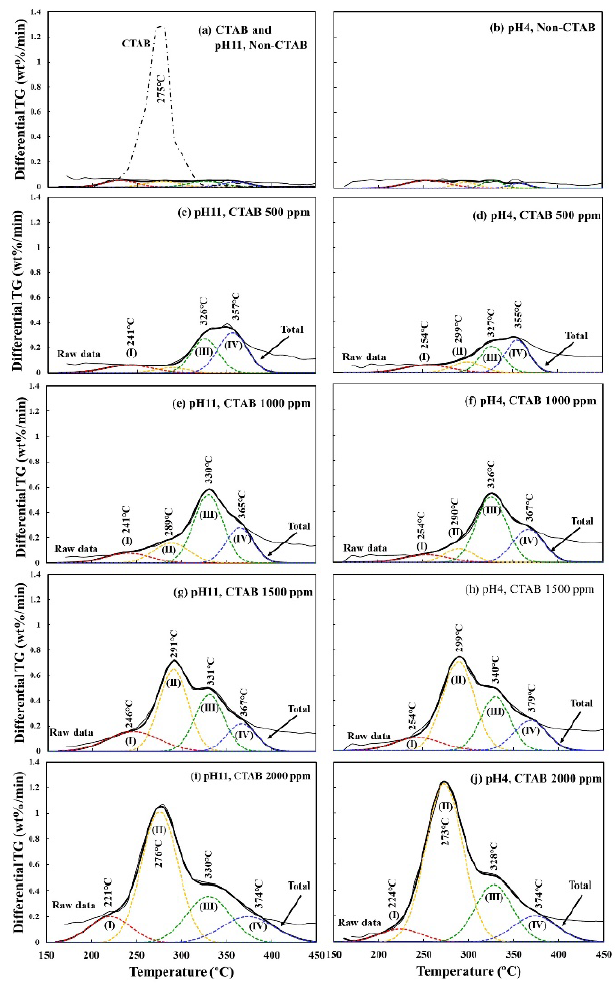
Figure 12 DTG curves of bentonite flocculate with different CTAB concentrations at pH 11 and pH 4, and the peak separation.
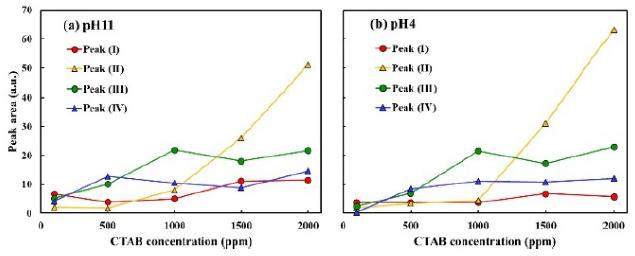
The weight loss at peak (I), which starts below 200 °C, occurred because of the loss of water molecules from the hydration sphere of Na+ cation between the montmorillonite layers (Shakar & Dana, 2022). From the DTG profiles, peaks (IV) and (III) were observed at CTAB concentrations of 500 ppm and 1000 ppm, respectively, and at the same time, d001 shifted from monolayer to bilayer adsorption. Furthermore, when CTAB concentration exceeded 1000 ppm, the areas of peaks (III) and (IV) remained constant, and the weight loss ratio of peak (II) increased at 270-280 °C. Also, the area of peak (II) tended to increase even when CTAB was added up to 2000 ppm. Xi et al discuss the adsorption of octadecyltrimethylammonium bromide as follows (Xi et al., 2004): In the case of low surfactant concentration, the organic cations exchange with Na+ between the montmorillonite layers. With the increase of the concentration of cationic surfactant, the surfactant not only exchanges cation at interlayer but also adsorbs on the montmorillonite surface. As the concentration is further increased, the surfactant concentration exceeds the cation exchange capacity of montmorillonite, so the surfactant adheres on the surface-adsorbed surfactant by van der Waals forces. From this report, it is suggested that CTAB below 1000 ppm was adsorbed to the montmorillonite surface (peak (III)) and interlayers (peak (IV)). Above 1000 ppm of CTAB, the excess CTAB adhered to the surface adsorbed CTAB by hydrophobic interaction (peak (II)), thereby resulting in an increase in the amount of CTAB in the flocculates.
3.3. Flocculation mechanism of CTAB to bentonite and effect of pH
Based on the above results, we discuss the flocculation mechanism of bentonite using CTAB and the effects of the pH and CTAB concentration.
At 100-1000 ppm CTAB, primary flocculates were formed by adsorbing CTAB to montmorillonite surface and between the montmorillonite layers as monolayers and bilayers. Above 1000 ppm of CTAB, excess CTAB adhered to CATB adsorbed on montmorillonite surface through hydrophobic interactions and formed the secondary flocculants by bridging the primary flocculants. Hence, we conclude that an increase in CTAB concentration was effective in improving the sedimentation rate and shortening the filtration time owing to the formation of bentonite flocculates.
However, the adsorption behavior of CTAB on bentonite was not affected by pH. At pH 4, the turbidity of the supernatant solution was lower, and the filtration time was shorter than that at pH 11. In addition, the formation of primary and secondary flocculates at pH 4 was observed at low concentrations of CTAB compared with that at pH 11. The edge surface of the montmorillonite layer acquires positive charge as the pH is lowered, and montmorillonite forms a card-house structure (Benna et al., 1999; Choo & Bai, 2015; Olphen, 1964b). Furthermore, the addition of CTAB at pH 4 caused the formation of large flocculates even at lower concentrations because CTAB was adsorbed onto the interlayer of bentonite formed the card-house structure. Hence, at pH 4, the particle size of the bentonite flocculates became larger and the water permeability in the filter cake improved compared with that at pH 11, thus resulting in an accelerated filtration even at low CTAB concentrations.
6. Conclusions
The effect of CTAB on the flocculation and filtration of bentonite suspension and the adsorption behavior of CTAB in bentonite flocculates were investigated under different pH values and CTAB concentrations, and those relationship were evaluated. The turbidity of the supernatant solution in the flocculation tests was lower and the filtration rate increased with increasing CTAB concentration. In addition, the morphology of the bentonite flocculates changed from primary to secondary with increasing CTAB concentration. CTAB adsorbed to montmorillonite surface and between the layers and formed primary flocculates of bentonite. Moreover, excess CTAB adhered on the surface adsorbed CTAB by hydrophobic interaction and formed secondary flocculates of bentonite. In contrast, no difference in the CTAB adsorption behavior were observed at pH 4 and 11; however, the flocculation effect and filtration rate at pH 4 increased more compared with at pH 11. This is because part of the bentonite at pH 4 was positively charged, and bentonite formed a card-house structure. From these results, it was found that the use of CTAB as a flocculant progress bentonite flocculation by the adsorption of CTAB to the montmorillonite surface and interlayers and promote the filtration of bentonite suspension due to the formation of large flocculates.

