


 nueva página del texto (beta)
 Inglés (pdf)
 Artículo en XML
 Referencias del artículo
 Enviar artículo por email
 Citado por SciELO
  Similares en
SciELO
Similares en
SciELO 
 Permalink
1. Introduction
The use of environmentally friendly materials is an integral part of the modern concrete production process (Parashar & Gupta, 2021), for this reason the construction industry is increasingly considering the addition of by-products or agricultural residues as supplementary cementitious materials (SCM) (Charitha et al., 2021), as these contribute improving the properties of concrete, obtaining good results in strength and durability (Huaquisto Cáceres & Belizario Quispe, 2018). Currently in Colombia there are companies that promote the use of coffee waste (van Keulen & Kirchherr, 2021), however, there are organizations that do not use waste management and they are not used (Gaddam, 2021), due to this, the reuse of these materials is proposed in order to reduce the level of contamination (Amran et al., 2022). However, for the production of concrete we need cement and its production generates environmental problems due to the emission of toxic gases (Ibrahim et al., 2021), and its demand has increased due to population growth and the construction industry (Koshe Hareru et al., 2022). In addition, empirical practices for making concrete have impaired the quality of concrete, creating a hazard to construction and society (Gautam et al., 2020).
Recently some countries approved the use of coffee husk ash (CHA) for its pozzolanic properties (de Almeida et al., 2019), these were discovered when conducting a study to determine the properties of paste, mortar and concrete (Golewski, 2022). Proof of this are recent studies where it has been reported that the preparation of concrete using CHA in replacement of cement, showed optimum compressive strength with 10% substitution without compromising the behavior of the concrete, since the strength only differed by 7.14% in relation to the standard concrete. In the same way (Reta & Mahto, 2019) mention that cement replacement by CHA results up to 10%, as it presents maximum compressive strength with a difference of 12.12% with respect to the standard concrete. In addition, (Tarekegn et al., 2022) mention that partial replacement of cement by CHA is acceptable up to 10%, since the tensile strength only decreases by 3.15% and the flexural strength evidences an increase of 1.44% with respect to the standard concrete. This means that by increasing higher doses of CHA, higher percentages of strength loss are present (Gedefaw et al., 2022).
Instead, to reinforce and improve the performance of concrete, fibers are incorporated to improve the composition of the mix (Shen et al., 2020), offering better results when performing mechanical tests (Abd El Aal et al., 2022). One of the most used materials are polypropylene fibers (PPF) (Hossain, et al 2019), these can alter the behavior of concrete offering the necessary ductility to absorb large amounts of energy before failure (Li & Liu, 2020). Recent studies by Ali et al. (2022) highlighted that the addition of 1% PPF presents improved flexural strength characteristics showing an increase of 13.6% over standard concrete. Similarly, (de Souza Castoldi et al., 2019) developed concrete designs with PPF where they highlighted that the addition at 0.22% evidence an increase in compressive strength of 4.54% over standard concrete. In addition, (Zhang et al., 2018) they also studied the behavior of concrete with PPF additions, where they obtained that for concretes with w/c ratio of 0.5, the addition at 1.2% increases the tensile strength by 26.53%.
Considering the literature review, studies of concrete with CHA and PPF incorporations have been carried out independently, however, the effects produced by the combination of these elements on concrete properties have not yet been studied (Mena et al., 2020). Even some studies with CHA focus on partial cement substitution, as they seek to make concrete less polluting and more economical to produce (Wang et al., 2019). In this sense, the present study aims to analyze the effects of coffee husk ash at 5, 10 and 15% with polypropylene fibers at 1, 2.5 and 5% on the mechanical properties of concrete to establish an optimal design combination.
2. Materials and methods
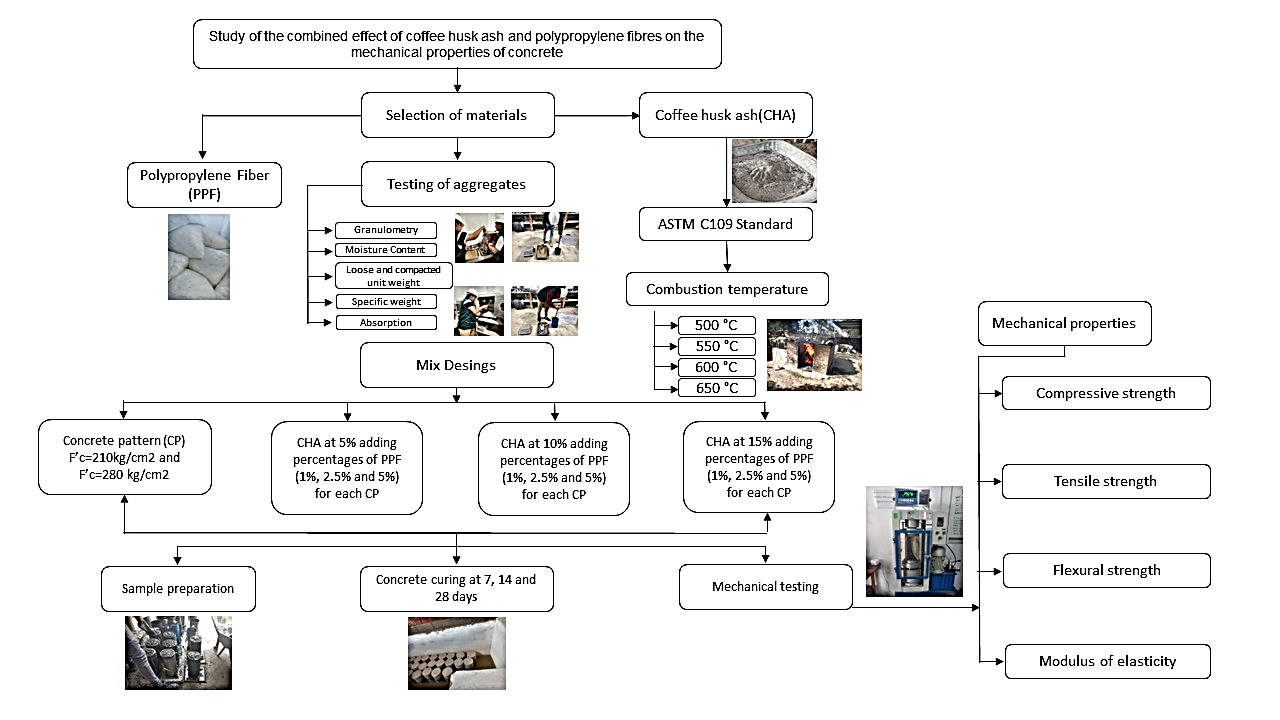
Figure 1 details the flowchart that describes the procedures conducted in this investigation.
2.1. Materials
In this investigation, type I Portland cement was used, the water supplied meets the requirements for the production and curing of concrete samples. A quarry study was conducted to determine the quality of the aggregates in accordance with the ASTM C33/C33M-18 (2018). These were purchased from quarries located in the Lambayeque region, the coarse aggregates were purchased from the Tres Tomas - Ferreñafe quarry and the fine aggregates were purchased from the Corporation Guevara - Pátapo quarry. The characteristics of the aggregates are shown in Table 1.
Table 1 Characteristics of the aggregates.
| Characteristics | Reference | Fine
aggregate |
Coarse
aggregate |
| Fineness modulus | (ASTM C136/C136M, 2019) | 2.61 | - |
| Maximum nominal size (in.) | - | 1" | |
| Loose unit weight (kg/m3) | (ASTM C29/C29M, 2017) | 1611 | 1458 |
| Compacted unit weight (kg/m3) | 1736 | 1560 | |
| Moisture content (%) | (ASTM C566-19, 2019) | 1.71 | 1.33 |
| Specific weight (kg/m3) | (ASTM C127-15, 2016) | 2748 | 2726 |
| Absorption (%) | (ASTM C128-15, 2016) | 1.05 | 1.31 |
15 mm synthetic microfibers that comply with the ASTM C1116-03 (2017) Fiber reinforced concrete standard were used; the specifications are found in Table 2.
Table 2 Polypropylene fiber specifications.
| Density | 0.91 g/cm3 |
| Length | 12.7mm - 19mm |
| Diameter | 0.03mm - 0.05mm |
| Absorption percentage | 0.0% |
| Tensile strength | 165MPa |
| Modulus of elasticity | 1.4GPa |
| Elongation at break | > 250% |
| resistance to alkalinity | high |
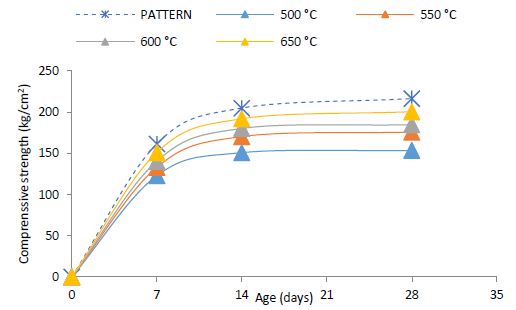
For this research, combustion temperatures were selected according to the review of studies conducted with CHA and temperatures of 500 to 650 °C were chosen, burned in a kiln for 3 hours to obtain ashes with an optimum fineness modulus. Subsequently, the compressive strength test of the hydraulic cement mortars was conducted using 50 mm cubic specimens according to ASTM C109/C109M (2021), adding the ash obtained at 650 °C for better results. Figure 2 shows the compressive strength of cubic specimens.
2.2. Experimental setup
In the development of this study, mix designs were elaborated for concretes of f'c= 210 kg/cm 2 and f'c= 280 kg/cm2 indicated in Table 3, samples were prepared with cylindrical molds of 150 mm in diameter. and 300 mm in height, and samples with 150x150x500 mm prismatic molds in accordance with ASTM C31/C31M (2022). Finally, they were subjected to compression, flexion, traction, and modulus of elasticity tests, as specified by ASTM C39/C39M (2021), ASTM C78/C78M (2022), ASTM C496/C496M-17 (2017), and ASTM C469/C469M (2022) standards, respectively, at 7, 14, and 28 days. Table 4 describes the experimental treatments with their respective percentages of added coffee husk ash and fiber, depending on the amount of cement used.
Table 3 Proportions of the master mix designs.
| Component | C21: 210 kg/cm2 | C28: 280 kg/cm2 |
| Cement (kg/m3) | 375 | 441 |
| Coarse aggregate (kg/m3) | 1089 | 1089 |
| Fine aggregate (kg/m3) | 774 | 715 |
| Water (lt/m3) | 188 | 188 |
Table 4 Designation and description of the experimental treatments for concrete of 210 and 280 kg/cm2 .
| Nomenclature | Description |
| T1 | Standard concrete with 5% CHA + 1% PPF |
| T2 | Standard concrete with 5%CHA + 2.5%PPF |
| T3 | Standard concrete with 5% CHA + 5% PPF |
| T4 | Standard concrete with 10% CHA + 1% PPF |
| T5 | Standard concrete with 10% CHA + 2.5% PPF |
| T6 | Standard concrete with 10% CHA + 5% PPF |
| T7 | Standard concrete with 15% CHA + 1% PPF |
| T8 | Standard concrete with 15% CHA + 2.5% PPF |
| T9 | Standard concrete with 15% CHA + 5% PPF |
3. Results and discussion
3.1. Mechanical properties
For depicting the macrostructure, steel specimens were macro etched by keeping it in a 50% Hydrochloric acid solution at 80°C temperature for 30 minutes.
Compressive strength Figure 3 shows the behavior of the concrete to the compressive strength at 7, 14 and 28 days, the T1 treatment increases progressively evidencing the maximum compressive strength reached. at 28 days of curing, with a difference of 8.94% compared to C21, which is the standard design, and in the other treatments at 28 days, the resistance decreases even below treatment T1.
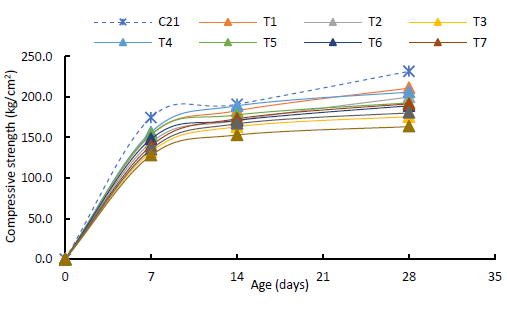
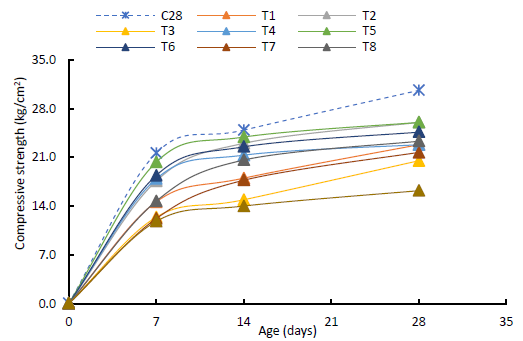
Figure 4 shows the behavior of the concrete to the compression resistance at 7, 14 and 28 days, the T5 treatment increases progressively evidencing the maximum resistance to compression reached. at 28 days of curing, with a difference of 4.11% compared to C28, which is the standard design, and in the other treatments at 28 days, the resistance decreases even below treatment T5.
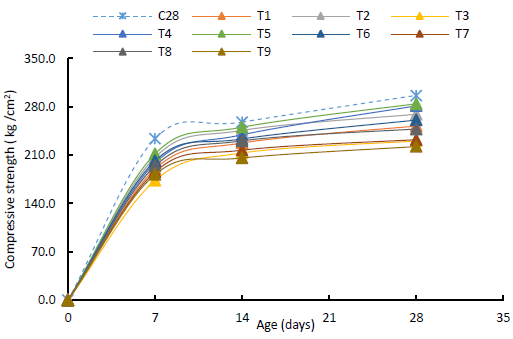
The results of Reta & Mahto and Gedefaw et al., support the research showing a decrease in the compressive strength of concrete due to the partial substitution of cement by CHA.
On the other hand de Souza et al, and Hossain et al, point out that the addition of PPF in concrete increases the compressive strength, however, the results of this research show that at day 28 of breakage, treatment T1 of concrete f'c=210 kg/cm2 presents an optimum compressive strength compared to the other treatments, but lower than C21. Furthermore, for concrete f'c= 280 kg/cm2, treatment T5 presents an optimum compressive strength compared to the other treatments, but lower than C28.
Tensile strength
Figure 5 shows the behavior of the concrete to tensile strength at 7, 14 and 28 days, the T4 treatment progressively increases, evidencing the maximum tensile strength reached. at 28 days of curing, with a difference of 8.55% compared to C21, which is the standard design, and in the other treatments at 28 days, the resistance decreases even below treatment T4.
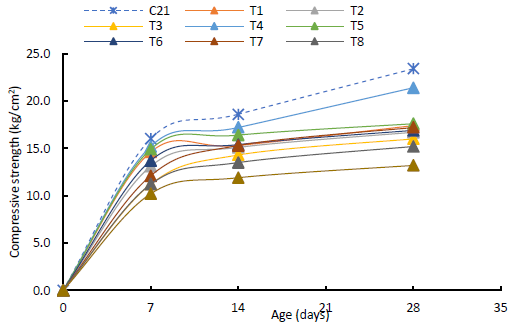
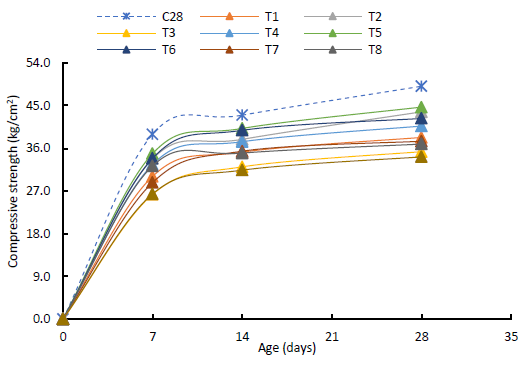
Figure 6 shows the behavior of concrete to tensile strength at 7, 14 and 28 days, treatment T2 and T5 increase progressively, evidencing the same tensile strength reached after 28 days of curing, with a difference of 15.03% compared to C28, which is the standard design, and in the other treatments at 28 days, the resistance decreases even below treatments T2 and T5.
The results obtained by Tarekegn et al., support the research showing a decrease in the tensile strength of concrete due to the partial substitution of cement by CHA.
On the other hand, Zhang et al. and Hossain et al. agree that the addition of PPF in concrete increases the tensile strength, however, the results of this research show that at day 28 of breakage, the T4 treatment of concrete f'c=210 kg/cm2 presents optimum tensile strength compared to the other treatments, but lower than C21. Moreover, for the 280 kg/cm2 concrete, the T2 treatment presents the optimum tensile strength compared to the other treatments, but lower than C28.
Flexural strength
Figure 7 shows the behavior of the concrete to the flexural resistance at 7, 14 and 28 days, the T4 treatment increases progressively evidencing the maximum flexural resistance reached. at 28 days of curing, with a difference of 10.89% compared to C21, which is the standard design, and in the other treatments at 28 days, the resistance decreases even below treatment T4.
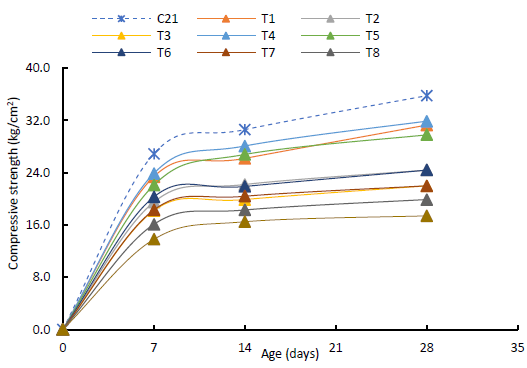
Figure 8 shows the behavior of the concrete to the flexural resistance at 7, 14 and 28 days, the T5 treatment increases progressively evidencing the maximum flexural resistance reached. at 28 days of curing, with a difference of 8.96% compared to C28, which is the standard design, and in the other treatments at 28 days, the resistance decreases even below treatment T5.
The results obtained by Tarekegn et al., support the research showing a decrease in the flexural strength of concrete due to the partial substitution of cement by CHA.
On the other hand, Ali et al, and Hossain et al, agree that the addition of PPF in concrete increases the flexural strength, however, the results of this research show that at day 28 of rupture, the T4 concrete f'c=210 kg/cm 2 treatment presents optimum flexural strength compared to the other treatments, but lower than C21. Moreover, for concrete f'c= 280 kg/cm 2, treatment T5 shows the optimum flexural strength compared to the other experimental treatments, but lower than C28.
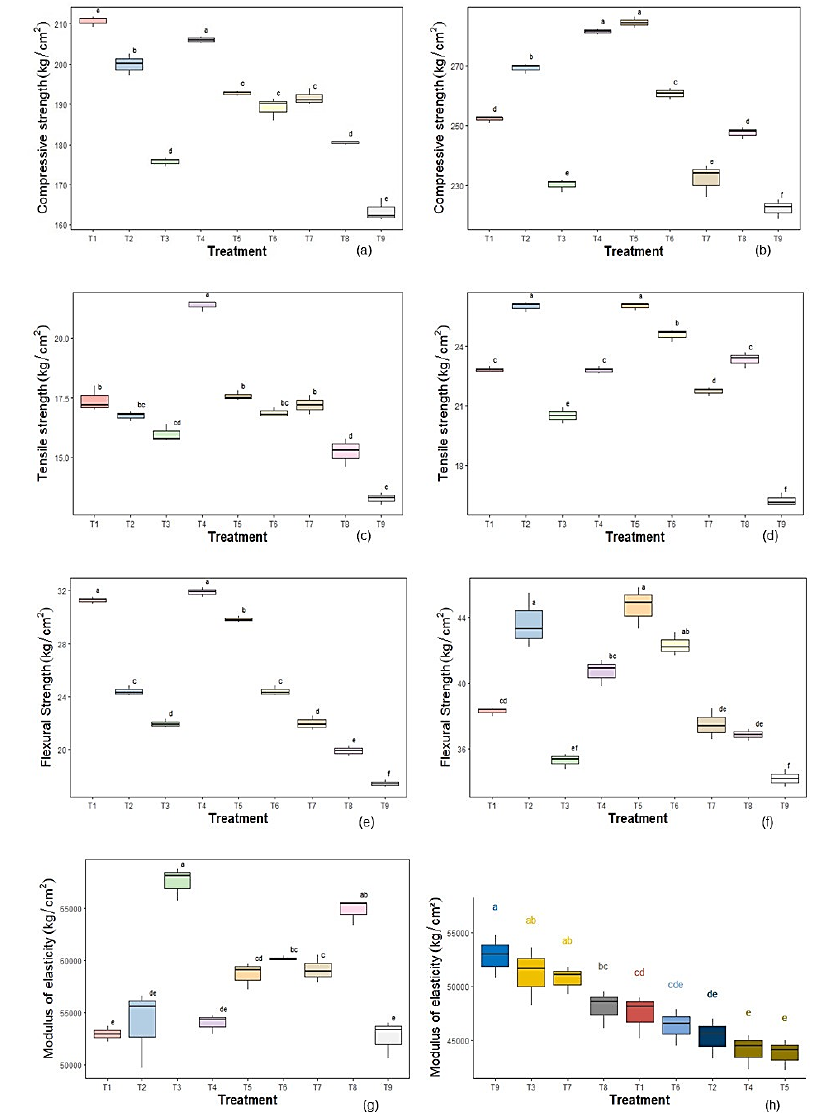
Considering the results of Figure 9 (a) corresponding to the compressive strength at 210, the unifactorial ANOVA test presented a p-value less than 0.05 (p=8.32e-16<0.05), that is, there is a significant difference. in at least two treatments, in addition, the Tukey post hoc test identified that treatments T1 and T4, did not they presented a significant difference (they presented the same letters above the box diagrams), and likewise they were the treatments that managed to maximize the response variable, it should be noted that it was in treatment T1 where the highest sample average compressive strength was displayed, with a value of 210.77 kg/cm², while in Figure 9 (b) the evaluation of the compressive strength at 280, the unifactorial ANOVA test, reached a p-value of significance less than 0.05 (p=2e-16<0.05), that is, the null hypothesis of equality of means is rejected, as well as the post hoc test of multiple comparisons of Tukey revealed that the T4 treatments and T5 did not present a significant difference, being also the treatments that allowed maximizing the resistance to compression at 280, where it was the T5 treatment. Who presented the highest sample average compressive strength with a value of 284.30 kg/cm², in Figure 9 (c) corresponding to the variable tensile strength at 210, the p-value of significance of the unifactorial ANOVA test, turned out to be less than 0.05 (p=1.47e-13<0.05), that is, the hypothesis of equal means is rejected, in addition to Tukey's multiple comparison test. , established treatment T4 as those treatments that allowed maximizing the response variable, presenting a sample average tensile strength of 21.37 kg/cm², in Figure 9 (d), typical of the variable resistance to traction at 280, the unifactorial ANOVA test, exhibited a p-value of significance less than 0.05 (p=2e-16<0.05), so we can affirm that there is a significant difference in at least two treatments, as well as the posttest hoc de Tukey revealed that there is no significant difference between the treatments T2 and T5, also being the treatments that allowed maximizing the response variable, whose sample average was 26.00 kg/cm² in both treatments, likewise in Figure 9 (e) n the evaluation of the variable resistance to flexion at 210, the unifactorial ANOVA test, presented a p-valve r of significance less than 0.05 (p=2e-16<0.05), that is, there is a significant difference in at least two treatments, likewise, the post hoc test of multiple comparisons of Tukey, established that there is no significant difference between the treatments T1 and T4, highlighting in both treatments T4, where the highest average sample flexural resistance was found with a value of 31.87 kg/cm², in the same way in Figure 9 (f) referring to the variable flexural resistance at 280, it was stated that the test of unifactorial ANOVA, showed a p-value of significance less than 0.05 (p=7.3e-11<0.05), that is, we can affirm that there is a significant difference in at least two treatments, in addition to Tukey's multiple comparison test, established than T2 treatments T5 and T6, did not present significant differences, being the treatment T5, who presented the highest sample average flexural strength, with a value of 44.67 kg/cm², in Figure 9 (g) in reference to the variable modulus of elasticity at 210, it was observed that the p-value of significance of the unifactorial ANOVA test turned out to be less than 0.05 (p=9.53e-09<0.05), with which we can affirm that there is a significant difference in at least Two treatments, as well as Tukey's multiple comparison test, established that treatments T3 and T8 did not show differences. significant, where was the treatment T3 who presented the highest average sample modulus of elasticity with a value of 67534.33 kg/cm², finally in Figure 9 (h) concerning the variable modulus of elasticity at 280, the test of Kruskal Wallis, reached a p value of significance less than 0.05 (p=0.00689<0.05), that is, there is a significant difference in at least two treatments, in addition, with Dunn's multiple comparison test, it was possible to know that there is no difference between treatments T9, T3 and T7, being the treatments that also managed to maximize the response variable, where it was treatment T9, which presented the highest average sample elasticity modulus, whose value was 52827.0 kg/ cm².
4. Conclusions
The study was developed with the purpose of using combinations of coffee husk ash and polypropylene fibers to analyze the mechanical properties of concrete. From the research, for concrete with a 210 kg/cm2 design the compressive strength of the T1 treatment showed the optimal results with a difference of 8.94% compared to C21, it is also shown that the tensile and flexural strength of the T4 treatment evidence optimal results with a difference of 8.55% and 10.89% compared to C21. In addition, the modulus of elasticity of the T3 treatment shows a maximum increase of 50.66% compared to C21.
Finally, for concrete with a 280 kg/cm2 design the resistance to compression and flexion of the T5 treatment showed optimal results with a difference of 4.11% and 8.96% with respect to C28, it is also shown that the traction resistance of the T2 treatment evidence optimal results with a difference of 15.03% compared to C28. In addition, the modulus of elasticity of the T9 treatment shows a maximum increase of 14.15% compared to C28.
It was evidenced that the mechanical properties of the concrete are affected by the incorporation of coffee husk ashes, being acceptable up to 10% of addition for concretes of 210 and 280 kg/cm2. It should be noted that the addition of polypropylene fiber also influences the mechanical properties of the concrete, indicating an optimum percentage of addition at 1% and 2.5% for concrete of 210 and 280 kg/cm 2 respectively. Finally, it is established that the optimal design combination for 210 kg/cm2 concrete is the T4 treatment and for 280 kg/cm2 concrete it is the treatment T5.

