


 nueva página del texto (beta)
 Inglés (pdf)
 Artículo en XML
 Referencias del artículo
 Enviar artículo por email
 Citado por SciELO
  Similares en
SciELO
Similares en
SciELO 
 Permalink
1. Introduction
Keratoconus (Cavas-Martínez et al., 2017) is a degenerative eye disease characterized by progressive thinning and changes in the shape of the cornea. The severity of the disease is variable, ranging from allegedly suspected keratoconus to really existing one. Signs and symptoms of keratoconus vary depending on the disease severity. They include slightly blurred or actually distorted vision. With an increased sensitivity to bright light, there is insistently a need for frequent changes in eyeglass prescriptions and sudden worsening or clouding of vision.
While etiology is unknown, several risk factors may increase the chances of developing keratoconus, notably, constant rubbing of the eyes, the presence of allergies, family history, Down syndrome and environmental factors. Early and valid detection of keratoconus is one of the most important challenges, which the ophthalmologists may face.
This paper focus on the development of a medical imaging and an analytic system using digital image processing tools and multimodal artificial intelligence techniques, which can detect keratoconus cornea, classify them and provide visual evidence to ophthalmologists. In this context, an application, which allows storing, processing, and analyzing data in addition to medical images for the purpose of monitoring and early detection and classification of keratoconus, is conducted.
Furthermore, the methodology used to conduct this study is also quantifiable, simply by designing statistics, specifying the most influential risk factors.This paper is structured by four sections ; the second is an overview of the keratoconus screening current technologies. The third section contains a detailed description of the different angles of the proposed application. Finally, the last section entails a drawn conclusion as well as a future research perspective related to the current study.
2. Current keratoconus screening technologies
Optical coherence tomography (OCT) (Yip & Chan, 2019) is a non-invasive imaging technique, which has an important clinical impact on ophthalmology. It has particularly contributed to the quantitative evaluation of keratoconus. The average corneal pachymetry in a normal adult eye is about 470 ± 30 μm in the centre and gradually increases towards the periphery. Several researches have extensively used corneal pachymetry in the keratoconus diagnosis.
Specular topography is the primary diagnosis tool for keratoconus detection. Specular topography examines the corneal anterior face. It allows to study the morphology of the cornea both the qualitatively and quantitatively.
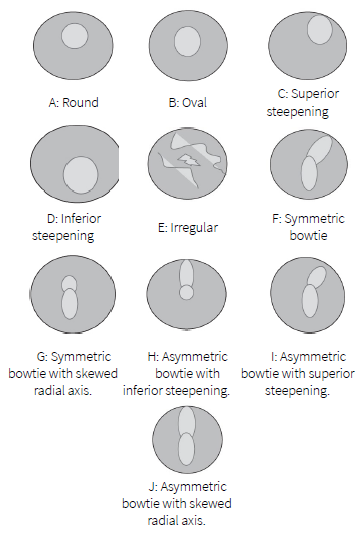
Bogan et al. (1990) suggests a classificatory scheme of the patterns observed in anterior corneal topography maps for normal subjects. Bogan’s classification is, in turn, expanded by Rabinowitz et al. (1996) who introduces five additional cases. They open the existing classification to include asymmetric corneal topographic patterns as shown in Figure 1. D, H, G and J are the patterns, which are at risk.
In addition to these qualitative criteria, several others are proposed to detect keratoconus such as, KISA index proposed by Rabinowitz and Rasheed (1999). The KISA index is derived from four indices: central K, Inferior-Superior asymmetry (I-S), astigmatism (AST) and skew of steepest radial axis (SRAX) index. It is calculated as follows:
In normal case, KISA index is less than 60, between 60 and 100 in the case of a suspected keratoconus and greater than 100 for keratoconus. Rabinowitz (1995) criteria depend on two indices: central K value > 47.20 D and Inferior-Superior asymmetry (I-S value) > 1.4 D for patients with keratoconus.
Later, many ophthalmologists have proposed that the posterior corneal elevations anomalies are useful for the diagnosis of suspected keratoconus. In this context, elevation topography (ORBSCAN) provides information related to the anterior and posterior faces beside pachymetry.
Central pachymetry (CP) is an important parameter to evaluate keratoconus. Average ordinary CP is around 470 μm (Gab-Alla, 2020). Corneas with central pachymetry less than 470 µm are abnormal.
Several quantitative criteria using multivariate combinations facilitate the diagnosis of keratoconus, namely, the Screening Corneal Objective Risk of Ectasia "SCORE" (Chan et al., 2015). The value of the score is the result of a discriminant function comprising 12 variables. A negative score value is predictive of a normal cornea while a positive score value is predictive of a cornea affected by keratoconus.
The difference between the central pachymetry and the thinnest point (CP-TP) is less than 10 µm for keratoconus cornea; it is greaterthan 30 for normal cornea.
The Efcarpides criterion is defined as the ratio between the radius of the anterior best fit sphere and the radius of the posterior one. The cornea is considered normal if this criterion is less than 1.21, whereas with suspect keratoconus if the Efarpides criterion is between 1.21 and 1.27.
In normal corneas, the posterior best fit sphere BFS is less than 52 D, between 52 and 55 D in the case of a suspected keratoconus and greater than 55 D for keratoconus.
Tanabe introduces a qualitative criterion (Tanabe et al., 2002); maps having four or more colors within the central 3 mm area are found to be suffering from keratoconus.
3. Graphical interface description
The proposed software is written in Matlab by the graphical user interface development environment. This software is available for the ophthalmologist by downloading and installing the "keratocode.exe". All of the required toolboxes and settings will be installed. A graphical user interface (GUI) (Raj et al., 2016) can make the programs much easier to use by providing the ophthalmologists with a consistent appearance
as well as with intuitive controls. In the same veins, ensuring the protection of the patients’ personal information, each ophthalmologist is advised to long in with their username and password in the authentication page for application access. If the operation of authentication is successful, the ophthalmologists are directed to the application home page. Otherwise, they remain on the authentication page while the screen shows an error message.
The home page contains five buttons with links to other windows: "PATIENT SHEET" button, "OCT" button, "ORBSCAN" button, "REGISTRATION" button and "STATISTICS" button, ultimately leading to the statistics window.
3.1. Patient sheet window
The digitization of the patient records is surely conducive to an easily search access. It instantly helps to process the patients’ data, complete and read the documentation of the patients’ status, with a better sharing of information intra-medically.
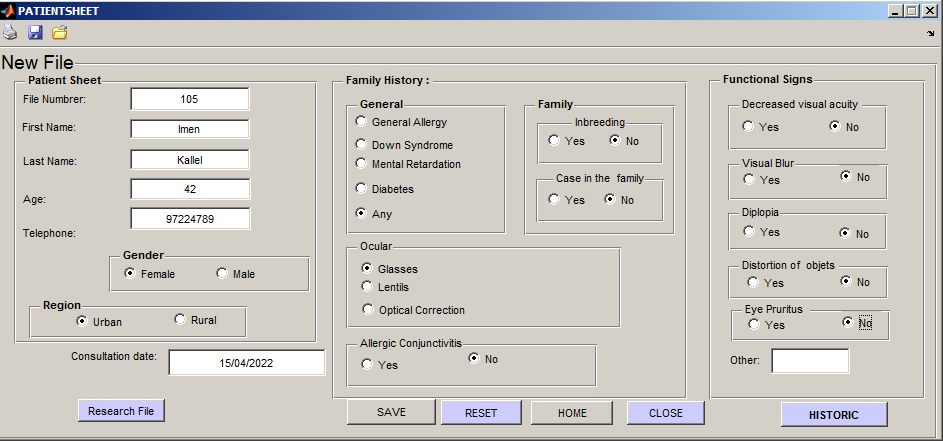
This window is used as a digitization means of the patient files. Moreover, it creates an easily accessible medical database. The ophthalmologists are able to design a new patient sheet. The patients are presented by their first names, last names, their ages, gender, regions and their telephone numbers. The second part of the patient sheet is kept for the surveying factors of keratoconus, notably the presence of allergies, family history, Down syndrome etc.
In addition, the ophthalmologists are able to look for former patients through their file numbers. If necessary, the ophthalmologists can possibly access the historic of the patient file with "HISTORIC" button in order to get historical records of their last visits, interpret the series of the medical information and detect the disease evolution.
Furthermore, the window contains four buttons, as shown in Figure 2. The first buttons identified as "RESET". The second is for the return to the home page. The "SAVE" button is used to save data in a table designed in excel. Next, the "CLOSE" button, as its name suggest, closes the sheet patient window. Finally, the toolbar offers the possibilities of printing, opening the intended, and saving the considered options.
With regard to the above mentioned demonstration, the currently used application is not only a simple means of managing the patient files but also of analyzing the images, which the ophthalmologists feel their importance.
3.2. OCT window
The GUI offers an option to open image files, display input image and manipulated image. Ophthalmologists can view and manipulate images. There is a zoom option, used to focus on the most interesting parts of the images as shown in Figure 3.
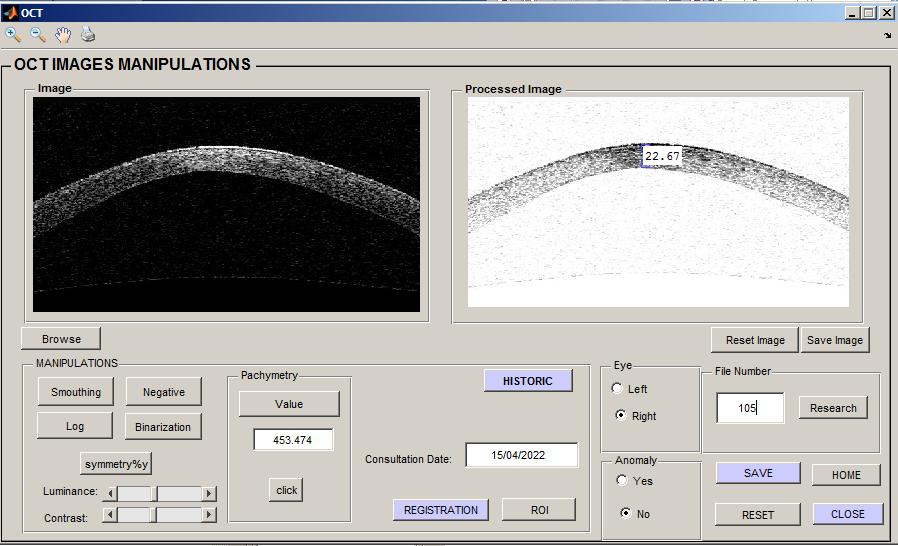
OCT images are usually contaminated with speckle noise (Rabbani et al., 1999). Different image processing can reduce the effect of this noise and improve image quality (Chaari et al., 2020). This interface will give a very simple way to choose exactly the desired operations for an image:
Smoothing: Used to reduce noise, which distorts information.
Negative: Produced by subtracting each pixel from the maximum intensity value.
Log transformation: Used to enhance the image.
Vertical Mirror: Allowed vertically mirroring the current image.
Binarization: Otsu’s (Qin et al., 2019) thresholding approach is applied.
Besides, the user can also manipulate the contrast and the luminosity in order to improve the illumination uniformity of the image.
Pachymetry is possibly estimated by calculating the distance between the two corresponding points of the lower and the upper boundary of the cornea. The pachymetry value is calculated by the following equation.
d: The distance calculated from processed image in pixels.
R: The resolution of the OCT device (=20µm) (Korobelnik, 2019).
"Reset image" button is used to restore the original image and the "Save image" button next to the "Processed Image" window, which helps the user to reuse the manipulated image.
The "Registration" button automatically displays registration window.
3.3. Registration window
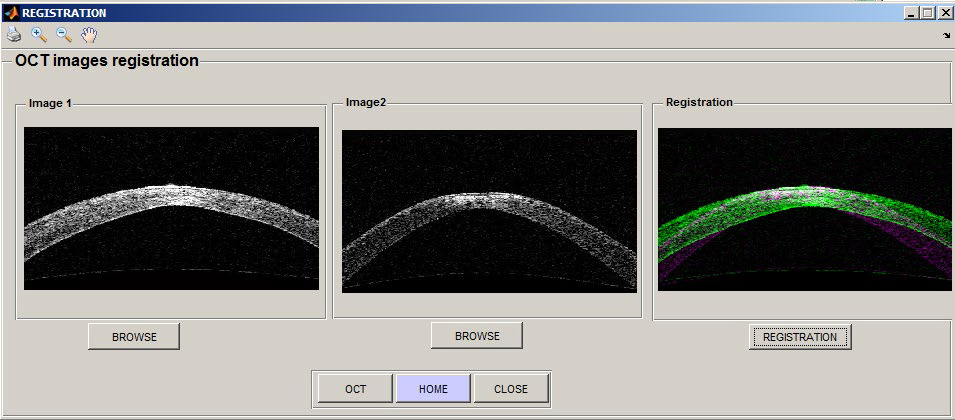
The interface offers an option for comparing two images by registration technique. The registration (Glocker et al., 2011) aims at identifying the geometric transformation between two medical images to:
Compare images acquired at various stages of the development of pathology.
Compare a cornea at risk with a healthy cornea.
Compare two images acquired before and after an intervention, to check if the expected results have been obtained.
The applied approach is the iconic registration method with a rigid transformation. This approach is used to align cornea images at various states and acquired at different times, facilitating the therapeutic follow-up.
The iconic methods are based on image content using image intensities directly without any reduction. The mean square function is applied as similarity criterion. Afterwards, this criterion will be optimized by an iterative gradient descent method in order to achieve the optimal transformation
The shown registration window in Figure 4 gives an option to open and display the two images for comparison. With the "REGISTRATION" button, the ophthalmologists can view the results of the registration.
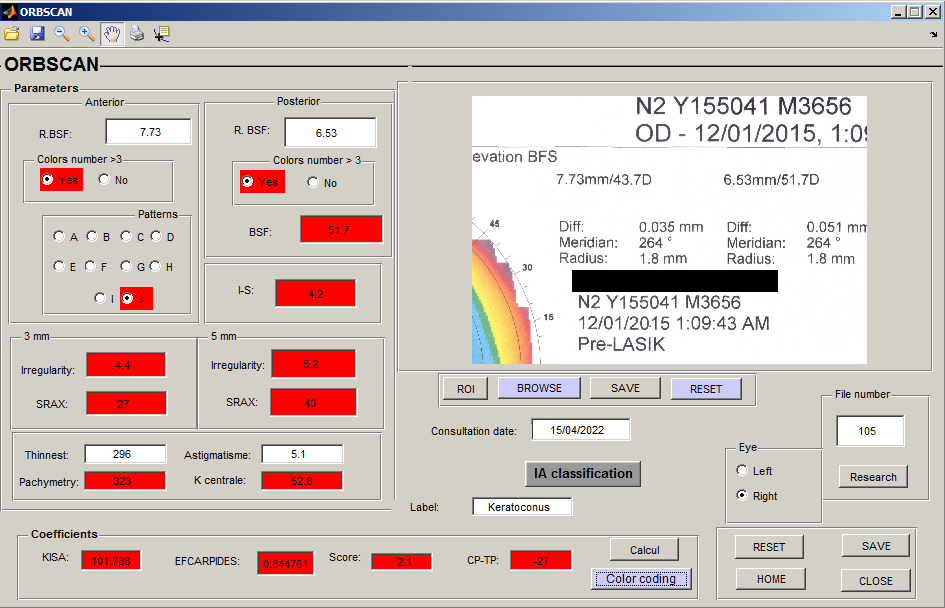
3.4. ORBSCAN window
The user can open an image file and display the ORBSCAN image, which facilitates the parameters input.
These parameters are used to calculate the most used criteria by the ophthalmologists, which are embodied in KISA, Efcarpides, CP-TP, and others, thus allowing a direct classification. The cut-off values, which permit the discrimination between the normal, the suspect keratoconus, and the keratoconus corneas, are used. In fact, a color code helps to easily distinguish between the three classes: the green for the normal cornea, the magenta for the suspected keratoconus, and the red for the keratoconus. The "EVALUATE" button displays the color code on the parameter fields as shown in Figure 5.
Similarly, these selected and specified corneal parameters, which are under the direction and supervision of the ophthalmologists, are used through an artificial intelligence technique, so as to automate the detection and the classification of the keratoconus. A screening program, based on an Artificial Neural Network (ANN), has been developed. This program is designed to improve the sensitivity of keratoconus detection. Ten parameters are used to build the algorithm, which could best distinguish keratoconus, suspected keratoconus and normal cornea: Corneal topography patterns, colours number in posterior and in anterior float, KISA index, Irregularity in 3mm area, Irregularity in 5mm area, TP, CP, BSF and EFCARPID criterion.
All the existing features are normalized in order to avoid significant differences between variable magnitudes.
The used normalization is z-scores (Tounsi et al., 2022). It is calculated as follows :
The dataset used in this work consists of 98 labelled patient folders. Each patient folder contains an ORBSCAN corneal image, an OCT image and a clinical report. With reference to the ophthalmologists' experience, all the patient records are classified into three different classes: normal, suspected keratoconus and keratoconus. The dataset is segmented as follows: 60% are exploited for the model training, 20% for its validation, and the remaining 20 % for its testing.
Four classifications are mainly schematized. The first classification is binary; it is formed up with two classes: the normal cornea and keratoconus. It is done by using restrictively the already mentioned ten parameters of the ORBSCAN corneal image. However, the second classification is basically designed by three classes: keratoconus, suspected keratoconus and normal, depending on the ORBSCAN clinical signs. The third classification is achieved by combining the ORBSCAN corneal image features with the measures of the corneal pachymetry derived from the OCT image and the clinical judgement. In this light, the patient’s data is sub-divided into two classes: the normal and the keratoconus. The fourth classification is organized by subsuming the patient’s data under three classes, using the 16 multimodal and hybrid features.
The used ANN model is characterized by a multilayer feed-forward network. It contains three distinct layers, namely the input, the hidden, and the output. The information in the network is propagated from one layer to the other. In this regard, the first classification is detailed. The network input layer consists of 10 input neurons, which receive the 10 input values from the ORBSCAN corneal image and then transmit them to the hidden layer. The neural network is evaluated solely by a single hidden layer. Different numbers of neurons, existing within the hidden layer from 1 to 20, are iteratively tested to obtain the best possible accuracy of both training and validation samples. It occurs that the network, containing 11 neurons in the hidden layer performs slightly better, compared to the other tested values. Each hidden neuron layer receives information from the previous one. It performs the weighed summation, which is shown in equation 4. Subsequently, it transforms such information according to its activation function. Referring to the current study, the hyperbolic tangent activation function is adopted, which sends this response to the neuron output layer as a next step.
Where xi (i = 1,2,3 ....n ): inputs coming to the neuron j; Wi (i = 1,2,3 ....n ): weights; n : number of input to the node j; b : Bia is for neuron j and f : activation function. Yj: output value, which will be passed to the next layer from the neuron j.
The output layer consists of one neuron, which represents both the normal and the keratoconus classes. Each class takes binary values of either 0 or 1. Accordingly, the sigmoid activation function is used for the output layer.
The weights are randomly initialized. During the training process, they are adjusted in accordance with the Levenberg-Marquardt (LM) optimization method (Sapna et al., 2012). It makes the predicated outputs either close to the target or to the actual outputs of the network.
The mean square error between the targets and the predicated outputs of the network is calculated by the following expression.
N represents the total number of the samples, Y signifies the sample actual value, and Y stands for the sample estimated value.
The squared error decreases as the training progresses. The network training stops when the performance reaches the global minimum of the error function in the best case. However, the training exceeds the maximum number of epochs if it is identified as 1000, or else if it exceeds the maximum duration set at 3600 s.
At the same time, the squared error is also evaluated on the validation basis. It allows to validate the learning of the network and to determine its quality to generalize on other examples, as well.
Figure 6 below represents the evolution of the mean square error during the training, validation and testing in relation to the number of Epochs.
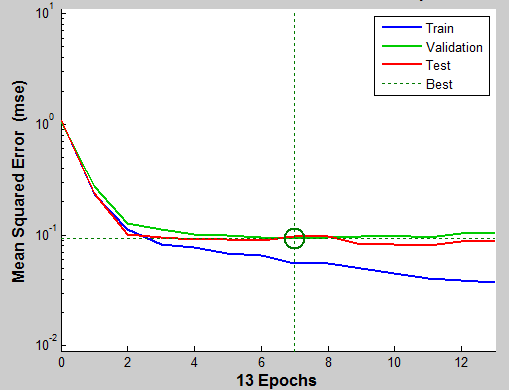
The smaller value of the MSE indicates that the ANN model is well trained and has already fitted into the data in an appropriate way. In this respect, the best validation performance occurs at seventh Epochs, with a mean square error of 0.093.
The same overall network architecture of the first classification is applied to the three others, except for a number of parameters presented in Table 1 just below.
Table 1 ANN classifier parameters
| Parameters | First ANN
classifier |
Second ANN
classifier |
Third ANN
classifier |
Forth ANN
classifier |
| Number of neurons in input layer | 10 | 10 | 16 | 16 |
| Number of neurons in outputs layer | 1 | 3 | 1 | 3 |
| Number of hidden layers | 1 | 1 | 1 | 1 |
| Number of neurons in hidden layer | 11 | 11 | 13 | 13 |
| Activation function of the output layer | Sigmoid | Softmax | Sigmoid | Softmax |
| Accuracy | 96% | 92% | 99% | 94% |
After training the network, the proposed classification models for the early detection of keratoconus are tested and evaluated by calculating the accuracy (Sahli, 2020), which is mathematically expressed as:
As shown in Table 1, these classification models have appropriate accuracy for detecting the keratoconus of 96% and 92%, by considering two and three keratoconus classes, respectively. They are increased to 99% for two keratoconus classes while 94% for the three other keratoconus classes, particularly when they are combined with the measures of the corneal pachymetry obtained from the OCT image and the clinical judgement. In this respect, complete data about the living environment, the family history and the cornea pachymetry from the OCT image could considerably refine the diagnosis
The findings prove that the use of the parameters, which are derived from different devices and equally the corneal techniques such as ORBSCAN and OCT, are actually in combination with the five risk factors namely: allergy, family history, eye rubbing, visual blur and primary optical aid. They are likely to result in the detection of the subclinical keratoconus with a higher accuracy rate. The increased performance of the classification models, when adding risk factor, reveals that their evaluation is significantly relevant.
The most appropriate clinical judgment, which is associated with topography and OCT criteria, is the key for building an intelligent multimodal ensuring an effective diagnosis of keratoconus.
This study is aimed at helping ophthalmologists, particularly novice ones, to make right decisions in the light of accurate diagnoses.
The performance of the classification models presented in this research is comparable to the keratoconus detection approaches displayed in the literature as (Cao et al., 2020; Issarti et al., 2019; Lavric et al., 2020). Moreover, this work introduces more efficient overall performance, compared to the deep learning models used by Zéboulon et al. (2020) and Chen et al. (2021). These models illustrate the effectiveness of machine learning algorithms on small datasets vis-à-vis deep learning algorithms.
The software is connected to Microsoft Excel to export data as the Excel file. This application has created database containing information and medical parameters which can be useful for other artificial intelligence applications, ameliorating diagnostic aids and statistics.
3.5. Statistics Window
The estimated prevalence in the general population worldwide is estimated at 1.38 / 1000 (Hashemi et al, 2020). It varies widely from 2.3% in central India (Gokhale, 2013) to 0.0003% in Russia.
A certain identification of the prevalence of keratoconus in TUNISIA with its risk factors is helpful for not only setting up an effective monitoring and screening system but also assessing the impact of this disease on the professional, social and personal life of its carriers.
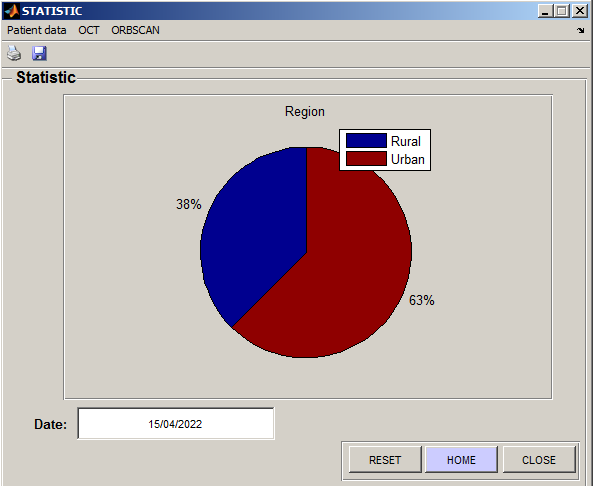
The understanding of the developmental causes of keratoconus has still been limited so far. The statistics ensure a better study of keratoconus by identifying the most attacked people as well as the most influential risk factors.
As shown in Figure 7, this interface presents the statistics space. The ophthalmologists chose the factor, which are to be taken for the study of the prevalence of the disease. These results show that keratoconus appears positively associated with urban region, notably pollution.
The proposed application is converted to an executable file, which can be run independently. This software "keratocode.exe"is tested and used in ophthalmological investigations, with promising results in the detection of keratoconus are obtained.
4. Conclusion and Futurework
The current applicationis produced in collaboration with the ophthalmology department of CHU Habib BOURGUIBA. This project is a basic version, which can be an initiative for a wide range of features, easing the early detection of keratoconus.
Indeed, this achieved application creates a practical environment for the ophthalmologists to process, store medical data, and to participate in the decision-making on the severity of keratoconus. It also ensures the creation of large databases, allowing the real effective medical studies, which influence an early detection of this disease.
The use of multimodal and hybrid features has improved the accuracy of the presented classification models and at the same time it has given an access to the early detection of keratoconus by taking advantage of the strengths of each device. In addition, it corroborates that risk factors can possibly endow the outcome of the automatic screening of the currently treated disease with much more efficiency than it was believed before. Accordingly, researchers and ophthalmologists may profit from the presented data and results of this paper.
In our future works, we will improve the accuracy of our classification model and we will address web and mobile applications that facilitate and help in the detection of keratoconus.
The used dataset is considered relatively small. Hence, it is suggested to collect more data in order to make the automatic classification models more open to generalization.

