


 nueva página del texto (beta)
 Inglés (pdf)
 Artículo en XML
 Referencias del artículo
 Enviar artículo por email
 Citado por SciELO
  Similares en
SciELO
Similares en
SciELO 
 Permalink
1. Introduction
Advances in nanotechnology, metal nanoparticles, such as silver, zinc or copper emerge as a new generation of antimicrobials for biomedical applications (Allaker, 2010; Cheng et al., 2009). Copper oxide nanoparticles (CuONPs) exhibit a broad spectrum of antimicrobial activity against various species of microorganisms, gram-positive and gram-negative, and fungi (Ramyadevi et al., 2012). Copper is also cheaper than silver, mixes easily with polymers and has relatively stable chemical and physical properties (Cava, 1990). Some of the applications of the CuO nanoparticles in the medical field include doping materials in semiconductors, such as chemical sensors, antimicrobial agents, catalysts for different cross-coupling reactions, anti-cancer formulations, coating materials, etc. Future biomedical applications of CuONPs are intensively focused on disease detection and could present potential applications in many other fields, for example, in detecting viruses in the human body (Ahamed et al., 2014).
The synthesis technique to obtain copper oxide nanoparticles can be carried out by several methods such as spray pyrolysis, sol-gel, hydrothermal and precipitation. This method has several weaknesses, namely complicated sample preparation, complicated equipment and using additional materials during synthesis so that the resulting nanoparticles consist of various compounds. There is another technique that is more effective in obtaining copper oxide nanoparticles using the laser ablation method. The laser ablation method is one of the techniques used for the synthesis of metal nanoparticles by utilizing pulse lasers as an energy source to produce nanoparticles with high purity. The purity of particles is basically determined by the purity of the target and the media (gas or liquid) without contamination from the reactants (Kim et al., 2017).
The nanoparticles shot with a laser require a liquid medium. The nanoparticles that collect in the liquid form a copper oxide compound, known as copper oxide nanoparticles (CuONPs). The synthesized nanoparticles require a particle stabilizer to prevent agglomeration. Chitosan has been shown to be used successfully as a stabilizing medium in copper nanoparticles synthesized using laser ablation (Usman et al., 2013;Sportelli et al., 2017). However, the ablation techniques are commonly used with higher laser energy for material ablation. In this present work, we applied low-energy Nd:YAG laser (30 mJ) for production of CuONPs using high-purity copper plate in chitosan medium. The produced CuONPs was then tested as an antibacterial agent of gram-positive bacterium.
2. Materials and methods
2.1. Synthesis and Characterization Copper Oxide Nanoparticles
The CuONPs were produced using pulse laser ablation method utilizing the Nd:YAG (New Polaris II model, base wavelength 1064 nm, the pulse width of 7 ns) with a laser energy of 30 mJ. The copper plate was immersed in the chitosan solution with a concentration of 0.1% and then placed under a convex lens which will reflect the laser light right above the high purity copper plate (99.95%, Nilaco Japan). To produce colloidal CuONPs with a concentration of 100 part per million (ppm), the Nd:YAG laser beam was directly bombarded to the surface of copper metal plate for 12 hours. In addition, for producing the CuONPs with a concentration of 80 and 60 ppm, the laser beam was focused on the Cu surface for 10 and 8 hours, respectively. The colloidal nanoparticles formed was then characterized using ultraviolet visible (UV-Vis) spectrometry, Fourier Transform Infra-red (FTIR) spectrometry, scanning electron microscopy (SEM), and energy dispersive X-ray (EDX) spectrometry to determine the absorbance value, the content of functional groups, the shape of the nanoparticles and their size, and the copper content in them. Furthermore, to measure and quantify the concentration of CuONPs, atomic absorption spectroscopy method was also used.
2.2. Antibacterial Test
In this present study, the produced colloidal CuONPs were examined their ability as antibacterial agent by using Enterococcus faecalis gram-positive bacterium, which is one of the bacteria that grows in tooth root canals and is easy to be cultured. For control agent, we used standard sample of NaOCl with a concentration of 2.5%. For potential application of CuONPs as antibacterial agent of gram-negative bacteria, further study in the near future will be conducted.
Experimentally, the Enterococcus faecalis colonies from blood agar dissolved in 2 ml sterile saline solution. Then the turbidity was measured using a standard of 0.5 Mc Farland. Antibacterial test was made using disc diffusion method utilizing disc paper with a diameter of 6 mm. Incubation of bacteria was conducted for 24 hours at 37oC. There are 5 groups with 2 control groups and 3 treatment groups, each group being repeated 5 times so that there are 25 samples.
2.3. Statistic Analysis
Data is processed using IBM SPSS Statistics software. Then the normality test was made using the Saphiro Wilk test (normal criteria p> 0.05) for the normality of the variant and for the homogeneity of the variants, using Lavene's test. The data were normally distributed and homogeneous with the One-way Anova and Post Hoc Tukey HSD tests.
3. Results and Discussion
3.1. Samples
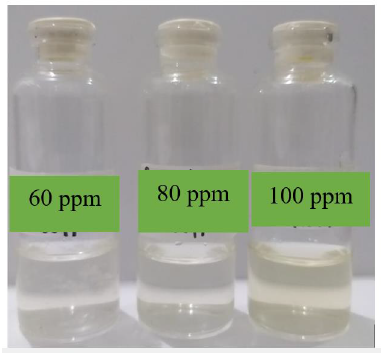
Figure 1 shows the colloidal copper oxide nanoparticles with varies concentrations of (a) 60 ppm, (b) 80 ppm, and (c) 100 ppm. The figure shows that the higher the concentration of copper oxide nanoparticles, the colloid color will change from transparent to cloudy yellow. This shows that copper oxide nanoparticles with various concentrations have been successfully synthesized. The darker the color indicates the increase in the concentration of the nanoparticles (Zamiri et al., 2013).
3.2. UV-Vis Spectrophotometric Analysis
The increase in concentration in the solution is indicated by the absorbance rate in the solution, where the absorbance value is directly proportional to the level of nanoparticle concentration, as shown in Figure 2.
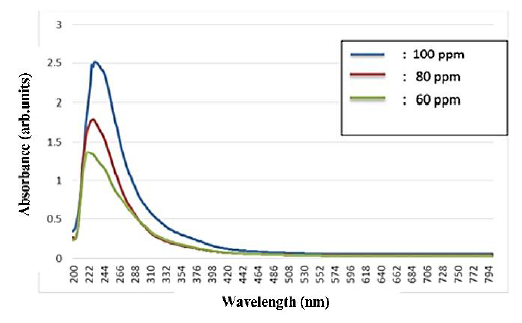
Figure 2 The absorption spectrum of copper oxide nanoparticles with concentrations of 60, 80, and 100 ppm.
The addition of material in the liquid was then confirmed using UV-Vis spectrophotometry (UH5300 spectrophotometer with a wavelength of 200 nm - 800 nm). The maximum absorption intensity (maximum absorbance) and maximum wavelength value showed that the higher the concentration of CuONPs, the higher the absorption rate. The difference in absorbance indicates that the density of the particles in the solution increases (Satriyani, 2019). The peak absorbance values in the 60 ppm, 80 ppm and 100 ppm groups were 224.0, 228.0, 230.0 arbitrary units, respectively. Another study conducted by Rajivgandhi et al. (2019) showed that the UV-Vis absorption spectrum showed that the wavelength absorption peak in CuONPs was ~ 290 nm (Rajivgandhi et al., 2019).
3.3 FTIR Analysis
Figure 3 shows transmittance spectrum obtained from the colloidal CuONPs with various concentrations of 60 ppm, 80 ppm, and 100 ppm. Functional group result is shown in Table 1. FTIR test was carried out using a tool with the Perkin Elmer brand type frontier AA spectrum 100, which can be used to detect functional groups of materials at a wavelength of 600-4000 cm-1. According to the research conducted by Usman et al. (2013), the peak intensity representing copper nanoparticles is at a wavelength of 629 cm-1 and 427 cm-1 where vibrations in the two bands indicate an interaction between copper nanoparticles and chitosan media (Usman et al., 2013). The wavelength of 1209.2 cm-1 in the 60 ppm group and 1289.49 cm-1 in the 80 ppm group showed Cu-OH characteristics. The peak in the 881 cm-1-1366 cm-1 wave region has the characteristic Cu-OH (Martin et al., 2013). The wavelength of 625.61 cm-1 in the 80 ppm group and 625.46 cm-1 in the 60 ppm group showed Cu-O characterization. The absorption of metal oxides is usually below 1000 cm-1 (Choudhary et al., 2019). The chemical bond in the 650 cm-1 wave band shows the characteristics of CuO, as in the research of which states that the peaks are in the region of wave numbers 622 cm-1 to 650 cm-1(Moniri et al., 2017).
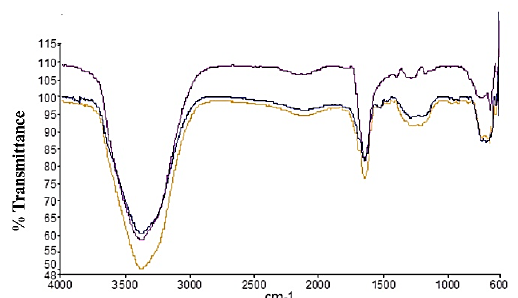
Table 1 The functional group results of FTIR analysis on CuONPs
| Functional groups | Wavenumber (cm-1) of CuONPs | ||
| 60 ppm | 80 ppm | 100 ppm | |
| 3000 -3500 (N-H, O-H) | 3383.66 | 3383.87 | 3390.41 |
| 1500 -2000 (C=O,N-H) | 1646.03 | 1643.75 | 1646.12 |
| 1000-1500 (C-O, C-C, Cu-OH) | 1289.49 | 1209.2 | |
| 500-1000 (C-H aromatic, Cu-O) | 703.06,
625.61, 609.95, 601.66 |
672.59,
625.46, 609.95, 601.82 |
673.08,
618.03 |
According to research conducted by Sportelli et al. (2017) on copper nanoparticles with 0.1% chitosan solvent, the entire spectral region between 690 cm−1 and 520 cm− 1 shows the Cu-N and Cu-O stretches whose intensity is proportional to the concentration of Cu in the colloid (Sportelli et al., 2017).
3.4 EDX Analysis
To obtain information of elemental composition from the produced colloidal CuONPs, EDX analysis was made. Figure 4 shows EDX spectrum of CuONPs.
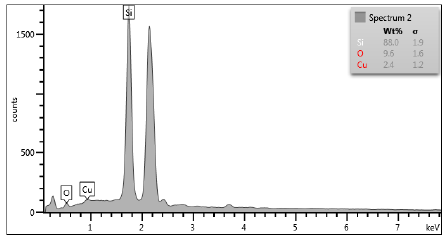
The test results on EDX of CuONPs show the content of Silicon (Si), Oxygen (O), and Copper (Cu). Copper is detected in this spectrum because the precursor used in the synthesis is pure copper plate. The presence of oxygen in the spectrum indicates the formation of copper oxide compounds in which copper is very easily oxidized by an aqueous environment. The silicon peaks in the spectrum come from the substrate used for testing, namely the silica plate. The highest peak after silicon is the Au or gold as a condition for testing using the EDX tool so that the sample can be reactive, and the element can be detected. Based on this result, it can be concluded that the colloidal nanoparticles produced in this study have high purity without any contamination of additional chemical agents such as in the chemical method.
3.5 Morphology Analysis of CuONPs
The shape of the resulting nanoparticles was described in the SEM analysis. The resulting nanoparticles are spherical in shape as shown in Figure 5.
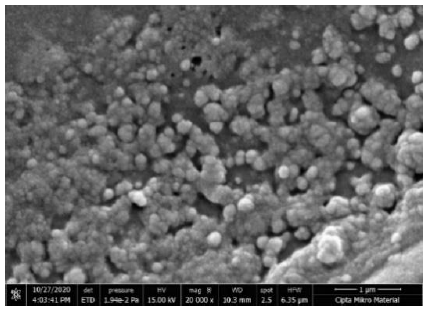
The shape of the nanostructures can affect its antibacterial activity, as in research on silver nanoplate with a triangular shape cut into planes (1,1,1) showing better bactericidal activity than rod-shaped nanoparticles. Silver nanoparticles with a spherical shape showed a better killing power of K. pneumoniae bacteria than silver nanoparticles in the form of rods (Acharya et al., 2018). This difference is influenced by the proportion of active parts in the nanoparticles with different shapes (Pal et al., 2007). Morphological analysis using Scanning Electron Microscopy (SEM) in this study showed that the nanoparticles were formed in a spherical shape. This is the same as previous research using distilled water and polyvinylpyrrolidone (pvp) as a solvent for copper oxide nanoparticles that were synthesized using laser ablation (Budiati et al., 2019; Satriyani, 2019), CuONPs with chitosan medium were synthesized using chemical methods (Usman et al., 2013), and chemical reduction methods (Sagadevan, 2015).
3.6 Distribution of Material Size
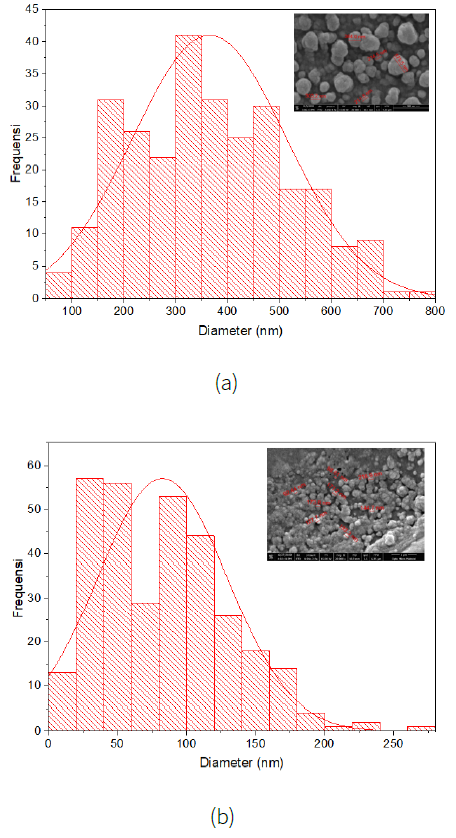
The size of the nanoparticles was analyzed using ImageJ software with image results from the SEM test. Nanoparticle size distribution is shown in Figure 6.
Nanoparticles with a small size can function as antibacterial by changing the surface charge, hydrophobicity, and other physical and chemical characteristics of the bacteria (Nel et al., 2009). Nanoparticles attached to the surface of the cell membrane will interfere with the functions of the bacterial cell such as membrane permeability and the process of cell respiration. When the nanoparticles successfully enter the bacterial cell, the nanoparticles will cause further damage due to possible interactions with sulfur and phosphorus-containing compounds such as DNA. Nanoparticles can also release ions which provide a bacterial effect (Lok et al., 2007). The inverse relationship between nanoparticle size and antibacterial activity has been widely described wherein particles in the 1-10 nm range have shown greater antibacterial activity against bacteria compared to larger particles (Lok et al., 2007).
The distribution of particle size (diameter) produced in this study at a concentration of 60 ppm was 79 nm - 785 nm with an average of 365 + 0.9 nm while at a concentration of 100 ppm that was 4 - 265 nm with an average of 83 + 1 nm. This is in accordance with the theory which states that the smaller the size of the nanoparticles the greater the antibacterial power, where in this study the concentration of 100 ppm resulted in a larger inhibition zone than the 60 ppm concentration group. Research conducted by Ebrahim-Saraie et al. (2018) using CuONPs from Neutrino Corporation, Iran with a particle size is less than 50 nanometers shows the highest inhibition zone diameter at the highest concentration used, namely 50 µg / mL (50 ppm) of 22.9 ± 1.7 mm at 1.5 × 10⁸ Colony Forming Units (CFU) / ml clinical Enterococcus faecalis (Ebrahim-Saraie et al., 2018). Whereas in this study using the same CFU value, but with a larger particle size range (4 - 265 nm), the largest inhibition zone value was obtained, namely 12.12 ± 2.44 mm at a concentration of 100 ppm, which means that the smaller the size of the nanoparticles, the more the resulting zone of inhibition. This is because the smaller size has a large surface area for interaction with the cell membrane so that it can change some of the main functions of bacteria, such as permeability and cellular respiration (Panáček et al., 2006). However, in a study conducted by Usman et al. (2013) CuONPs with chitosan stabilizer with a susceptible size of 2-350 nm showed that the smaller the size of the nanoparticles produced did not affect their antibacterial activity (Usman et al., 2013).
3.7 Antimicrobial Test
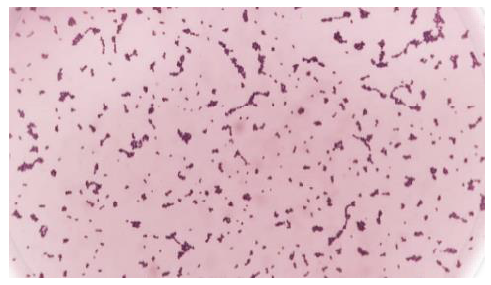
This study received approval from the Health Research Ethics Commission (KEPK), Faculty of Medicine, Diponegoro University with No.74 / EC / H / FK-UNDIP / VII / 2020. Growth of pure culture of Enterococcus faecalis was identified using a simple Gram test and catalase test. The results of the Gram staining of bacteria used are purple, in the form of cocci lined up showing the characteristics of gram-positive coccus bacteria as shown in Figure 7.
Furthermore, the catalase test on the bacteria used showed negative results because there were no bubbles after being given 3% H2O2 solution as in Figure 8.
Based on the simple Gram stain test and catalase test, the bacteria that grew had the characteristics of the Enterococcus faecalis bacteria because salt tolerance and bile-esculin positivity to identify (Enterococcus spp). The results of the inhibition zone measurement in the disc diffusion test using ImageJ software are as shown in Figure 9 and Table 2.
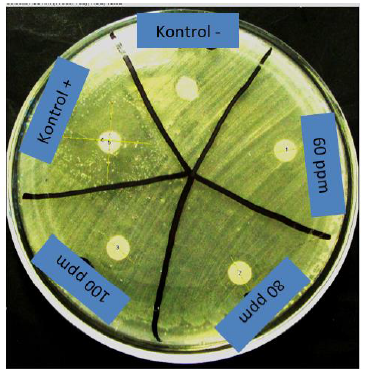
Table 2 Measurement of the diameter of the zone of drag in mm.
| group | Mean | Standard Deviation |
| Control (-) | 0.00 | 0.00 |
| CuONPs 60 ppm | 10.18 | 3.58 |
| CuONPs 80 ppm | 12.11 | 3.08 |
| CuONPs 100 ppm | 12.12 | 2.44 |
| Control (+) | 22.57 | 4.53 |
The results show the highest average diameter of the inhibition zone in the control group, namely in the control group (+) of 22.57 mm, while in the treatment group, namely the 100 ppm group of 12.12 mm, while the lowest average diameter of the inhibition zone in the control group was 0.00 in the control (-) and in the treatment group was 10.18 mm in the 60 ppm group.
The susceptibility of bacteria to nanoparticles depends on several factors such as the strain of bacteria, the type and size of the nanoparticles, the properties of the initial growth medium, and the concentration of bacteria used. Gram-positive bacteria do not have lipopolysaccharide (LPS) so they are more sensitive to the effects of nanoparticles; LPS plays an important role in bacterial defense, providing a negative charge and stabilization to cell membranes (Nanda & Saravanan, 2009; Nikaido, 2003; Schleifer & Kandler, 1972). Gram-positive bacteria have a cell wall consisting of several layers of peptidoglycan and teichoic acid. Peptidoglycan and teichoic acids are negatively charged glycerin chains that react with a positive charge on metal nanoparticles through electrostatic interactions (Paredes et al., 2014).
3.8. Statistic Analysis
The normality test using Shapiro-Wilk, the data distribution was normal because the p value is less than 0.05. Then, the homogeneity analysis of the data using Lavene's test, the significance value was more than 0.05 (p = 0.072) so that the data was included in the homogeneous data category. One way ANOVA test obtained p value is less than 0.001 so that it is included in the statistically significant category, meaning that there is a significant difference (p is less than 0.05) in the diameter of the inhibition zone for each group. The diameter of the inhibition zone in the treatment group is 60 ppm, 80 ppm and 100 ppm respectively only resulted in significant differences between the control group (+) and the control group (-). Whereas the treatment group (60 ppm, 80 ppm, 100 ppm) to the treatment group (60 ppm, 80 ppm, 100 ppm) did not produce a significant difference in the diameter of the inhibition zone.
Statistically the diameter of the inhibition zone in this study, between treatment groups (60 ppm, 80 ppm, 100 ppm) did not produce a significant difference, but tended to have a larger diameter of the inhibition zone at higher concentrations, (Yang et al., 2015), this is different from the theory which states that The diameter of the inhibition zone increases significantly with the increase in the concentration of nanoparticles, this is because more nanoparticles are absorbed by the bacterial cell membrane, so that more bacteria are killed (Azam et al., 2012). This is consistent with the results of previous studies which showed dose dependence on the antibacterial activity of copper oxide synthesized using laser ablation (Khashan et al., 2016). The concentration of the stabilizer solution also has an effect on antibacterial activity, where the more stabilizer concentration, the smaller the size of the nanoparticles produced (Usman et al., 2013). In a study conducted by Usman et al. (2013) Cu-chitosan nanoparticles produced the largest inhibition zone diameter against gram-positive Bacillus subtilis bacteria by 10 mm with a concentration of 0.1wt% (0.1% chitosan), this is the reason for choosing the chitosan content used in terms of its antibacterial activity (Usman et al., 2013).
4. Conclusions
Synthesis of nanoparticles using 1064 nm Nd: YAG laser ablation with a laser energy of 30 mJ, which is fired at a pure copper plate has succeeded in producing copper oxide nanoparticles in chitosan solution. The firing time affects the concentration of the nanoparticles and the size of the nanoparticles. The copper oxide nanoparticles were then applied as an antibacterial agent of E. faecalis. The results show that the treatment group of CuONPs with various concentrations (60, 80, and 100 ppm) affect the diameter of inhibition zone. The highest average diameter of the inhibition zone is in the control group, namely in the control group (+) of 22.57 mm, while in the treatment group, namely the 100 ppm, 80 ppm, and 60 ppm, the inhibition zone is 12.12, 12.11, and 10.18 mm, respectively. Post Hoc Tukey HSD analysis showed a significant difference in the negative control group, and the inhibition zone diameter of the treatment group (CuONPs concentrations of 60, 80, and 100 ppm) was almost the same. Further research is needed to determine the antibacterial power of copper oxide nanoparticles synthesized using laser ablation for Gram-negative bacterium.

