1. Introduction
The valuation of goodwill is considered to be one of the most controversial issues in accounting theory. The controversy was perhaps exacerbated in recent years by the generation of, and subsequent hangover from, the major international financial crisis. At this time, the foremost accounting issuers are analysing their methodology on this topic, as this is very relevant to the firm´s fair valuation and the timely registration of their assets. Therefore, the International Accounting Standards Board (IASB), across its Post-Implementation Review (2018), collects the interest of a large number of accounting information users, in regards to the impairment of goodwill within the study of business combinations. In addition, the Financial Accounting Standards Board (FASB), by amending ASC 350, is working on some changes to simplify and encourage more transparent application.
In this sense, the Financial Stability Board (FSB) (2020) has identified goodwill impairment as one of the current challenges, linked to the economic downturn and volatility in financial markets, as a consequence of the crisis caused by the global pandemic.
We can highlight two key milestones in the regulatory application of amortization and the impairment of goodwill.. On the one hand, in the US, in 2001, its accounting regulator, the FASB, issued the “Statement of Financial Accounting Standard 141 Business Combinations (SFAS 141)” (2001) and “SFAS 142 Goodwill and Other Intangible Assets (2001)”. And later, the IASB, issued “International Financial Reporting Standard 3 Business Combinations (2004) (hereinafter IFRS 3)” for the rest of the countries that apply its accounting standards. This standard entry was implemented in 2005 with very similar content.
In both cases, the most relevant regulatory change was the change from systematic amortization to the impairment test as the standard for recording the consumption of goodwill. This test must be carried out when there is any indication of impairment and at least annually.
This regulatory change arose, on the one hand, from the intense conceptual debates collected in a good number of academic articles and, also, from the efforts made by the industry to end amortization, since the late 1990s.
Following the idea of the lobby, authors like Cheng et al. (2005) “understand the FASB’s decision to not amortize goodwill as an assignment due to pressure from US companies”. The amendment to the standard made it easier for companies to extend the impact on the income statement of their corporate operations, which could result in a greater number of purchases and a certain inflation in their valuations. In our view, “this is one of the most important reasons for the regulatory change, which befell first in the United States and then, by extension, in Europe and the rest of the world”.
More specifically in Europe, shortly after the new standard publication, Giner and Pardo (2006) conceptually asked whether it was correct for an asset to depreciate systematically, when its useful life could not be estimated with certainty and, if so, how should it be recognized. Likewise, “this modification in the calculation base of annual impairment was encouraged by the practical application of the standard, which allowed for an immense range of depreciation rates, which could be considered arbitrary and were not related to the commercial life of the assets”. These authors stated that both the IASB and the FASB concluded that "if it is not possible to foresee the horizon in which they will be able to generate cash flows, it is preferable to submit them to an impairment test, in order to determine their depreciation periodically, than to maintain an arbitrary procedure of the systematic reduction in value, although, to a large extent, how correct the decision was will depend on the rigor with which the impairment review established in the standards is performed" (emphasis included).
Taking all this into account, the lack of comparison of impairment with a systematic amortization pattern would be the main limitation of this study.
2. Objective of the research and sample under analysis
The intention of this study is twofold. On the one hand, it seeks to evaluate whether this impairment process has been applied in a uniform, rigorous and comparable manner in the banks with the highest volume of assets in the main European countries between 2005 and 2015, bearing in mind that they operate in a similar economic, regulatory and supervisory environment.
On the other hand, this paper seeks to detect the existence of significant differences in the measurement of these banks’ goodwill as a result of the arbitrary use of the impairment test, which may take greater account of the control of the income statement to the detriment of relevance and reliability. This phenomenon, which would have resulted in insufficient and late impairment losses, could have led to inflated goodwill, with an impairment that has proved to be, in the words of Hoogervorst (2018), “too little, too late”, rather than reflecting the economic reality of each entity.
The existence of significant differences in the recognition of goodwill impairment could reveal a discretionary and unprincipled approach on the part of top management, if such differences were the consequence of deferring the recognition of losses, which, could involve a deliberate alteration of earnings.
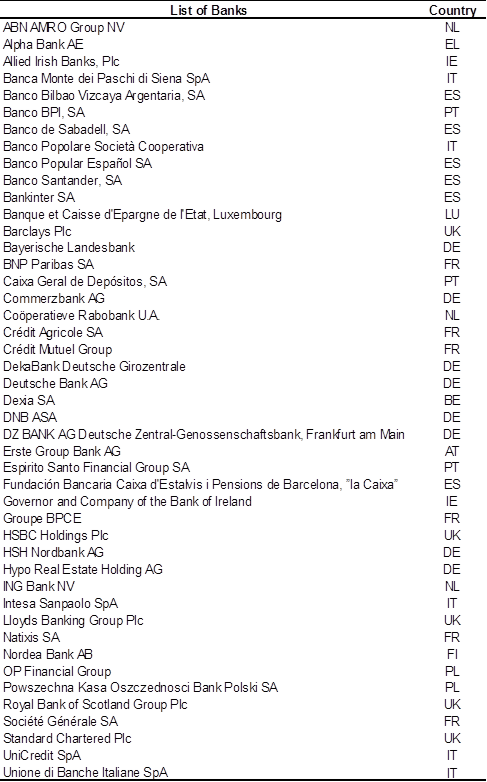
The selected sample includes a ten-year time horizon which begins with the enforcement of the regulatory change introduced by the IASB in 2005. From this year, goodwill was not amortised. The leading European banks, including the most notable UK banks, are included in the sample, which consists of a total of 45 entities1, whose assets on the 31st of December 2015 summed 25.6 billion euros, accounting for around 68% of the total assets of Europe’s banking sector. The percentage is even higher if the aggregate goodwill is taken as a reference.
On the 31st of December 2015, the goodwill of the sample banks summed 137 billion euros, which amounts to around 80% of the total goodwill of European and UK banks.
This concentration of goodwill in the largest entities coincides with the theses published by the European Financial Reporting Advisory Group (EFRAG) (2016): “goodwill (in all industries, not just the financial services industry) is concentrated in a small number of companies”.
The sample includes banks classified as significant by their supervisor-the Single Supervisory Mechanism (SSM)--together with the principal UK banks (in terms of total assets). In addition, all European entities classified by the Financial Stability Board (FSB) as systemic entities (Global Systemically Important Banks - G-SIBs) are included, except for UBS and Credit Suisse, which have a different accounting framework.
The following section reviews the academic research carried out previously, which serves as a reference and helps us to formulate the hypotheses, which are displayed in section 3. For its part, section 4 offers a description of the statistical methods applied and their modelling that will permit us to analyse and read the outcomes in section 5 to present lastly the core ideas gotten.
3. Analysis of scientific output
The accounting treatment of goodwill, in particular its measurement, by means of the impairment process, is an issue that has been widely studied, debated and argued in recent decades.
In line with what was done in a previous article -see Pallarés, Pérez and Gonzalo Angulo (2020)- carried out by the authors as part of a broader general work that encompasses both studies, we consider it necessary to start by highlighting the specific idiosyncrasy of goodwill that has been heavily analysed for many years. We found goodwill was first mentioned back in 1929. For example, Canning (1929) highlighted “the difficulties in actually defining goodwill: accountants, writers on accounting, economists, engineers, and the courts, have all tried their hands at defining goodwill, at discussing its nature, and at proposing means of valuing it". Later, in 1969, Gynther (1969) intelligently pointed out that “goodwill is not the excess paid over the net assets of the acquired company; that is its method of calculation”. “Goodwill refers to special skill and knowledge, high managerial ability, monopolistic situation, established clientele and good name and reputation”. “These assets have a future projection for the company and this future has an economic value that must be reflected”.
In order to analyse the information provided in the impairment test, a wide range of studies on the impairment of goodwill have been published more recently.
Wines et al. (2007) discussed “the core difficulties and potential areas of mistake in the calculation of goodwill impairment. Most of them related with the identification of Cash-Generating Units (CGUs), the estimation of fair value, the verification of replacement costs, the discount rate and the estimation of future cash flows, generating uncertainty and volatility in the calculations”.
Another study that focuses on the impairment estimation process is that of Carlin and Finch (2010). They demonstrated, in the Australian context, that “there is clear opportunism in the selection of discount rates, within the impairment process, in an attempt to achieve results showing lower impairment losses”. Also Comiskey and Mulford (2010) concluded that “the arbitrary use of estimates offers possibilities to avoid or reduce charges for goodwill impairment”.
Later, Ramanna and Watts (2012) turned to the idea of agency problems in estimating impairment. Difficulties in estimating the recoverable amount of goodwill and comparing it with its book value, as established in the SFAS 142, have to do with the interests that managers may have, since these estimates depend in part on their own future decisions, and they may be encouraged to believe that their forthcoming actions will have greater impact than expected, since they prioritize their predictions over their own decisions. This would fit with one of the conclusions of the work of Li, Z.Q. (2020) who said that “high audit quality can effectively play an external monitoring role and curb the opportunistic behaviour of senior management” and more recently with Ghos and Xing (2021) who found that incremental audit effort is positively associated with goodwill impairment.
Li and Sloan (2017) stated more directly, that “the regulatory change causes goodwill to inflate and its impairment to be delayed, as a consequence of the elimination of its amortization and its replacement for impairment. The managers have exploited the discretion granted by SFAS 142 to delay impairment, causing earnings and, therefore, stock prices to be temporarily inflated. Therefore, it can be stated that impairment does not reflect the fair view of the economic situation of the company”.
There are more studies that agree with these conclusions. For instance, Abughazaleb et al. (2011), Hamberg et al. (2011) and Johansson et al (2016) argue that “IFRS 3 allowed for a more arbitrary treatment and, in conclusion, impairment is closely related to the company´s financial reporting policy”.
Gros and Koch (2019) are more direct with their conclusions saying that “discretionary goodwill impairment losses are used opportunistically rather than informatively”, in an essay about European companies.
In the financial sector, in the case of Italian banks, Quaranta et al (2019) found a direct relationship between the profitability of the Italian banks analysed and the impairment policies for intangible assets. The finding is that managers tend to postpone the recognition of losses on these items.
Finally, we want to mention the annual study by the firm Duff and Phelps (2018) on goodwill impairment in Europe. For this purpose, they analysed the impairment generated in the firms making up the STOXX Europe 600 Index, revealing a reduction in impairment charges of 28% compared to the previous year, 2017, which showed the lowest impairment figure recorded since 2010. One of the sectors in which this figure fell the most was the financial sector. This study, which has been carried out since 2010, discloses that “impairment has not reflected the trend of the real economy, presenting a lag between the recognition of losses and the beginning of the international financial crisis”.
4. Description of the hypotheses
Throughout the paper, an attempt will be made to determine whether the accounting policies applied by the entities in the various European countries relating to the verification of goodwill impairment have followed a uniform criterion or whether there are significant deviations, depending on the country of application, which could lead to the alteration of the result and, ultimately, to a failure to apply a level playing field.
In addition, we will seek to ascertain whether these applied criteria have resulted in insufficient and late recognition of impairment losses that caused artificially inflated goodwill or, indirectly, the emergence of internally generated goodwill.
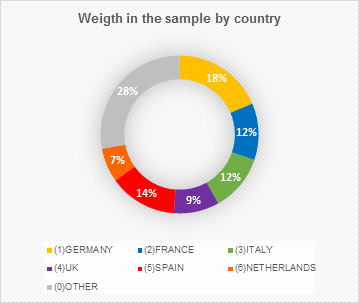
Before setting up the hypotheses, we will describe the weight of each country in the sample, in relation to the number of observations produced by the entities in each country.
Once the number of observations for each country has been determined, the following initial hypotheses are put forward:
H1: The goodwill impairment test has not been applied uniformly in the credit institutions of the main European countries under analysis.
H2: The application of the impairment test has led to insufficient and late recognition of losses in European banks.
4. Description of the statistical model
In this case, to analyse the behaviour of different data clusters, in an attempt to ascertain whether this behaviour has been analogous or, on the contrary, diverse, we will use the goodwill impairment attribute as a measure. One of the most commonly used methods for this type of test would be the Fisher F-distribution, through an analysis of variance (ANOVA). Through this analysis, the means of various data populations, in our case the different countries, are compared to determine if they all come from the same population or, on the contrary, they belong to different populations, in which case it could be concluded that the behaviour was different among the groups analysed. In order for this analysis to be carried out, the sample must meet several requirements: the population follows a normal distribution, they show the same standard deviation and the populations are independent.
In the event that the sample does not meet these requirements, alternative analyses can be conducted. In our case, if it is confirmed that the sample does not meet these specifications, we will use the Kruskal-Wallis test, which does not make any assumption about the normality of the population, as it analyses the behaviour of the medians, instead of the means, as we saw for ANOVA. This statistical test tries to determine if several samples can be considered part of the same population based on a given characteristic. The null hypothesis is that all the samples come from the same population.
In addition, depending on the results, there will be an attempt to carry out an additional test to validate the results obtained.
In order to be able to reach conclusions in relation to the second hypothesis (H2), a descriptive statistical study was carried out, with the intention of analysing how the various impairment policies have been applied and how they have affected financial statements, in terms of the composition of goodwill and the impact on the income statement.
5. Analysis and interpretation of the results
The objectives of the outcomes found in the analysed sample is to reach a conclusion, firstly, as to the uniform and consistent application of goodwill impairment in the various countries under analysis in the years under observation, and to continue with the analysis of whether the implementation of the impairment test has superimposed the problems of the amortization model that conditioned regulators to modify it. Secondly, the results obtained from the statistical analysis of the IMPAIRMENT variable will enable us to give an opinion on the sufficiency and appropriateness of the impairment losses recognized in the sample used.
5.1 Descriptive statistics
Next, we are going to statistically detail the main variables of the sample, with special focus on the impairment variable that is the main topic of our analysis.
First of all, we will verify the data shown in Table 1 2. The first thing that stands out is that the goodwill is higher than the rest of the total intangible assets, representing around one seventh of equity, and average annual impairment is pretty low in relation to goodwill; with these annual impairment figures, it would take more than 15 years to amortize it. This data suggests that there was a certain delay in the recording of impairment losses, especially considering that the time horizon of the sample includes two major crisis events. This delay could be explained by lax implementation of the standards, which means that acquired goodwill can be replaced by internally generated goodwill, as suggested by Hoogervorst (2018): “[… ] acquired goodwill tends to be shielded by the internally generated goodwill within the acquiring company [… ]”, and the net effect would entail very modest impairment figures.
Table 1 Sample main statistics
| Observations | Mean | Standard Deviation (annualized) | Minimum | Maximum | |
|---|---|---|---|---|---|
| Goodwill | 495 | 3,906,554 | 575,000 | 0 | 58,480,368 |
| Intangible Assets | 495 | 1,161,483 | 142,590 | 356 | 8,739,000 |
| Impairment | 495 | 258,141 | 149,379 | 0 | 30,062,000 |
| Total Assets | 495 | 543,492,827 | 50,915,644 | 20,628,785 | 2,495,218,700 |
| Equity | 495 | 27,110,309 | 2,593,276 | 747,500 | 181,854,823 |
Source: Pallarés, Pérez & Gonzalo-Angulo (2020).
Table 2 shows the recognition of impairment between 2005 and 2015.
Table 2 Impairment recognized between 2005 and 2015
| Impairment | Frequency | % | Accumulated |
|---|---|---|---|
| No | 306 | 61.82 | 61.82 |
| Yes | 189 | 38.18 | 100 |
| Total | 495 | 100 |
Source: Pallarés, Pérez & Gonzalo-Angulo (2020).
It is immediately clear from the general data of the main variables under analysis that the impairments recognized were few in number and of a low amount, bearing in mind that, as mentioned above, in the period under analysis there were two crises with a profound impact on financial institutions.
5.2 Description of goodwill
Before carrying out the statistical analysis of the application of impairment policies across the main European countries, we will analyse the composition of goodwill, as a balance sheet item.
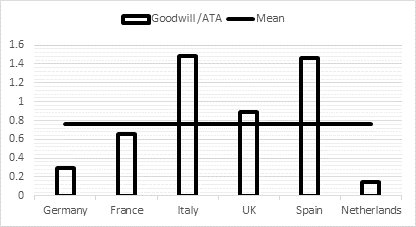
The following diagram shows a representation of the relative size of goodwill in each of the countries in the sample, which was obtained on a weighted basis, taking into account the size of each entity. As shown, there are significant differences between countries in the amount of goodwill as a percentage of average total assets.
Noteworthy is the size of this item in countries such as Spain and Italy. In Spain, it could be justified by the weight of the goodwill of the two largest entities, whose goodwill is a consequence of the international expansion program they have carried out in recent decades. The Central European entities, on the other hand, have smaller relative goodwill. The European mean, of the entities included in the sample, is around 0.8% of the entities’ total assets, which is very much in line with what was discussed in previous studies [EFRAG (2016)] for the financial sector. This first glance would indicate that there is great disparity in the size of goodwill, which could be caused by divergent accounting valuation principles or different business models.
5.3 Results of the model for Hypothesis 1
Once we have already performed the descriptive analysis of the composition of goodwill, we turn to an analysis of variance, i.e. the difference in the means of the variable studied and of the sample size (ANOVA), to analyse whether impairment, as the population attribute, behaved uniformly in the different countries (groups or clusters).
There is a qualitative variable, i.e. impairment, on the basis of each of the countries in the sample, that acts as the population or factor levels.
Table 3 Analysis of variance by country.
| Countries | Mean | Std. Dev. | Freq. | ||
|---|---|---|---|---|---|
| 0 | 13,283.11 | 74,213.50 | 132 | ||
| 1 | 123,371.47 | 598,081.96 | 88 | ||
| 2 | 251,454.78 | 538,358.50 | 55 | ||
| 3 | 849,491.85 | 2,152,936.90 | 55 | ||
| 4 | 1,122,630.70 | 5,765,894.30 | 44 | ||
| 5 | 70,733.86 | 242,663.32 | 66 | ||
| 6 | 32,030.97 | 112,187.00 | 33 | ||
| Total | 271,212.12 | 112,187.00 | 473 | ||
| Analysis of Variance | |||||
| Source | SS | df | MS | F | Prob > F |
| Between groups | 6.56E+13 | 6 | 1.09E+13 | 2.94 | 0.008 |
| Witdin groups | 1.73E+15 | 466 | 3.72E+12 | ||
| Total | 1.80E+15 | 472 | 3.81E+12 | ||
Source: Authors’ own elaboration.
The analysis of variance gives certain results3, which reject the hypothesis of equality of means, since the data Prob > F is below 0.05. Given that the results indicate that there could be significant differences in the standard deviations and, above all, given the existence of outliers, these results may not be valid, since they would not meet the requirements necessary to carry out an analysis of variance, i.e.: that the population follows a normal distribution, that it has the same standard deviation and that the populations are independent.
As the qualitative variable would present unequal variances, and does not meet the above-mentioned requirements, the Kruskal-Wallis test was carried out. This measures the differences in the medians for populations with different variances, as we tried to mitigate these differences and sought a measure that could help us reach conclusions as to the behaviour of the various countries under analysis. The results applying the test to our population are as follows:
Table 4 Kruskal-Wallis Test for Impairment by Country.
| Country | Sample Size | Average Range |
|---|---|---|
| 0 | 132 | 175,612 |
| 1 | 88 | 242,847 |
| 2 | 62 | 338,71 |
| 3 | 55 | 276,273 |
| 4 | 55 | 247,845 |
| 5 | 66 | 233,871 |
| 6 | 33 | 229,045 |
Statistic = 78.1284 p-value = 0.00000799262
Source: Authors’ own elaboration.
The Kruskal-Wallis test assesses the hypothesis that the medians of the "impairment" variable, within each of the 7 "country" levels are equal, group 0 being formed by the rest of the entities of the sample that belong to several countries. Firstly, the data from all the levels are combined and ordered from lowest to highest. Then, the average rank is calculated for the data at each level. Since the p-value is less than 0.05 (in our case it is practically 0), the hypothesis of equality of medians (in this case) is again rejected, concluding that there is a statistically significant difference between the medians with a 95% confidence level.
Therefore, taking into account the result of the very low p-value, we can conclude, with a high level of confidence, that the null hypothesis can be rejected, which would indicate that impairment had been applied differently in the various European countries under analysis.
In order to perform a more in-depth study, we will carry out a non-parametric test of equality of medians for various groups. This tool will provide us with a better analysis of the behaviour of the impairment in the different comparison groups (countries). It will also identify, for each of the groups, the impairment data that were higher than the sample median and those that were lower. In order to reach a correct conclusion, once again, it must be borne in mind that in many years and in many entities no impairment was recognized (the impairments recognized were 0). The following graph shows the results obtained:
Table 5 Non-parametric test of equality of medians.
| Greater than the median | Countries | |||||||
|---|---|---|---|---|---|---|---|---|
| 0 | 1 | 2 | 3 | 4 | 5 | 6 | Total | |
| no | 113 | 55 | 13 | 28 | 26 | 39 | 22 | 296 |
| yes | 19 | 33 | 42 | 27 | 18 | 27 | 11 | 177 |
| Total | 132 | 88 | 55 | 55 | 44 | 66 | 33 | 473 |
Pearson chi2(6) = 69.5127 Pr = 0.000
Source: Authors’ own elaboration.
As can be seen in Table 5, the group displaying the behaviour with the greatest significant differences is country 2 (France). The behaviour of goodwill impairment in the French entities was different than that of the other entities in the other countries studied in the sample. They recognized a higher number of impairments than the median in a higher number of observations, which would give us some idea how the impairment policies were applied in these entities; many impairments of a lesser amount were recognized. The behaviour of the Italian entities (country 3) was also different than the other entities; in this case, the recognition of impairments was around the median. In the group containing the other countries in the sample (country 0), very few impairments were recognized. We deem this fact to be significant, given that, as mentioned above, the entities in the different countries operate in similar economic environments, with the same accounting regulatory framework and, therefore, a unique application of the impairment policy could represent an arbitrary element, to differentiate them from competition.
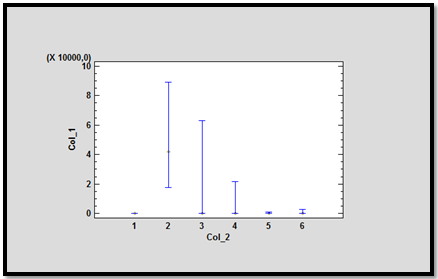
This behaviour can be better understood, graphically, if we look at the data in the following graph:
To conclude and further strengthen our conclusion, we present this fact in the attached chart of averages, which also gives us a sample of the different policies carried out in the main countries analysed. (In this case, group 0 has not been included as it is not relevant.)
5.4 Model validation for Hypothesis 1 (H1)
In this case, the model validation could be justified with the Kruskal-Wallis test, as a post hoc test, on the analysis of variance (ANOVA), in addition to the Bonferroni test which, together with the Sidak and Scheffe tests, is one of the most frequently used tools to validate the results obtained in the analysis of variance. In our case, since the results of the Kruskal-Wallis test also reject the null hypothesis, the non-parametric test of equality of medians, in which we saw that there were differences between several pairs of groups, especially with group 2, and the graph of medians introduced, would confirm for us that the null hypothesis of equality of behaviours can be rejected. Therefore, it could be concluded that the impairment behaviour of the entities of the countries (groups) under analysis was not uniform, which would ratify our initial hypothesis.
5.5 Results of statistical analysis for Hypothesis 2 (H2)
In order to examine if the implementation of the impairment test at banks in the main European countries has led to overvalued goodwill, we will carry out a comprehensive descriptive statistical analysis that will allow us to ratify or not the initial hypothesis. Before describing the behaviour of the impairment variable in each of the comparison groups (the entities of the main European countries), the following table provides the years in which these entities recognized impairment.
Table 6 Impairment distribution by year
| IMPAIRMENT | ||||
|---|---|---|---|---|
| 1 | 2 | 2/(1+2) | 2/Total2 | |
| Date | No | Yes | % of Total Entities | % / Impairment |
| 2005 | 36 | 9 | 20% | 5% |
| 2006 | 33 | 12 | 27% | 6% |
| 2007 | 33 | 12 | 27% | 6% |
| 2008 | 20 | 25 | 56% | 13% |
| 2009 | 22 | 23 | 51% | 12% |
| 2010 | 25 | 20 | 44% | 11% |
| 2011 | 21 | 24 | 53% | 13% |
| 2012 | 29 | 16 | 36% | 8% |
| 2013 | 26 | 19 | 42% | 10% |
| 2014 | 26 | 19 | 42% | 10% |
| 2015 | 35 | 10 | 22% | 5% |
| Total | 306 | 189 | 100% | |
Source: Pallarés, Pérez & Gonzalo-Angulo (2020).
As shown in Table 6, both the distribution of impairment, as well as the number of impairment events with respect to total observations, throughout the years of the sample, reveal a similar behaviour. The years 2008, 2009 and 2011 are the critical years when the entities recognized a high amount of losses and recorded more events of impairment. These are the undertow years of the international financial crisis opened by the Lehman Brothers crisis and the beginning of the sovereign debt crisis in Europe.
On the basis of this data, we can anticipate that “goodwill impairment was recognized in a pro-cyclical manner, appearing in the crisis years, as Laghi, Mattei and Marcantonio (2013) discussed in their work”. For that reason, it could be considered reasonable to recognize a greater number of impairments and of a greater amount in years of crisis. But if impairment is only recognized abruptly in a few years, that means that ordinary consumption of goodwill from previous years was not recognized. As indicated above, this fact favours the indirect recognition of internally generated goodwill, which would be offsetting the consumed portion not recognized in the income statement of the acquired goodwill, in line with the comments made by Hoogervorst (2018). Therefore, a tighter application of the standard, could imply more frequent recognition of losses, offering more relevant financial statements. In this regard, goodwill represents the super profits (economic resources) that the acquirer expects to obtain from the purchase of the acquired business and that are recognized as a result of the business combination. Therefore, it can be expected that a portion of those economic resources acquired will be consumed in each of the years following that combination.
It can be deduced that impairment recognition starts late (no significant impairment is recorded in 2007) and ceases to be relevant (in 2011 or, at most, in 2012) when the sovereign debt crisis has not yet been overcome. The 2015 figure stands out, very similar to that noted in 2005. The results seem to indicate that the managers did not take into account what happened in the past, reverting to pre-crisis practices, where goodwill impairment was hardly recorded, such as shown in Table 3.
Having described the general map of the years in which impairments were recognized, we will try to study their behaviour in each of the main European countries. To this end, we will analyse the behaviour of the binary variable IMPAIRMENT (which takes a value of 1 when there is impairment in the year and 0 when there is no goodwill impairment) in each of the countries analysed, for the years under observation.
Table 7 Recognition of goodwill impairment
| Country | Without Impairment | Impairment | Total |
|---|---|---|---|
| (1)GERMANY | 55 | 33 | 88 |
| (2)FRANCE | 13 | 42 | 55 |
| (3)ITALY | 28 | 27 | 55 |
| (4)UK | 26 | 18 | 44 |
| (5)SPAIN | 39 | 27 | 66 |
| (6)NEtdERLANDS | 22 | 11 | 33 |
| (0)REST | 113 | 19 | 132 |
| Total | 296 | 177 | 473 |
Source: Authors’ own elaboration.
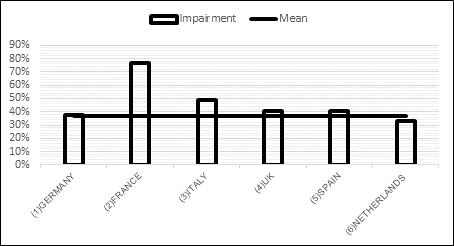
Therefore, the frequency of impairment in the sample analysed in each country is as follows:
Table 8 Impairment frequencies.
| Country | Impairment |
|---|---|
| (1)GERMANY | 38% |
| (2)FRANCE | 76% |
| (3)ITALY | 49% |
| (4)UK | 41% |
| (5)SPAIN | 41% |
| (6)NETHERLANDS | 33% |
| (0)REST | 14% |
| Mean | 37% |
Source: Authors’ own elaboration.
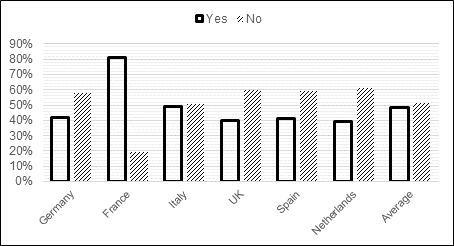
There is also a slight disparity in the frequency of impairment recognition, with the situation of French entities being particularly noteworthy. These entities recognized more impairments than other countries in the sample, as we saw earlier. Dutch entities recognized impairment on fewer occasions than banks in the other countries, while UK and Spanish entities performed similarly. In Italy, impairments were recognized in a slightly higher number of years, but also far from the case of France. This disparity in frequency would confirm the results of the Hypothesis 1 study regarding the lack of uniformity in the application of the impairment test.
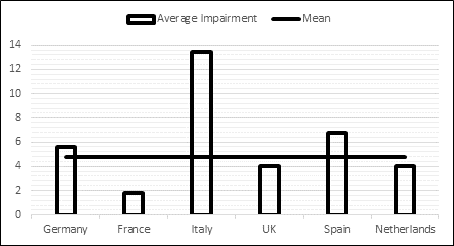
It is also important to analyse, as shown in the following graph, the ratio of goodwill impairment intensity, understood as the ratio between annual impairment and the opening balance of goodwill. In other words, how much outstanding goodwill is impaired at the beginning of the year, when impairment occurs. This would provide an approximation, without taking into account additions and disposals, of the useful life (in terms of duration on the balance sheet) of goodwill, generated by the impairment accounting framework. If we consider that we are dealing with entities that compete in similar markets and economic environments, the non-systematic nature of impairment results in goodwill being held on the entities' balance sheets for a very long period of time and in a very unequal manner, reinforcing the initial idea of impairment being "too little, too late".
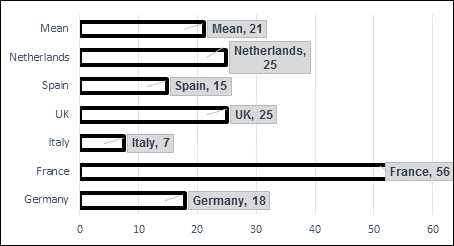
Again, the figure for France is noteworthy, as it is well below the mean, resulting in a lengthening of the useful life of goodwill and, therefore, a delay or lag in the recognition of losses. The figure for Italy can be explained by the abrupt recognition of impairments by one of the entities in two years central to the crisis. In this case, the results shown in Table 6 indicate localized recognition, especially in the central years of the crisis. In view of the data obtained, with the proviso that the goodwill additions and disposals are stable, we would have the following mean balance sheet durations (mean useful lives) by country:
The mean is set at 21 years. This is a longer period of time than that indicated, for example, by the amendment to the Spanish Commercial Code, i.e. 10 years (unless proven otherwise), which results in a longer distribution of losses and, therefore, less impact on the income statements. This fact would show us that the application of impairment was clearly insufficient and late, which would give rise to goodwill being consumed in an exaggerated number of years, or that this lack of consumption would be indirectly compensated by the emergence of internally generated goodwill, if at the time of estimating the recoverable amount of goodwill, sufficient impairment losses are not recognized.
The case of France, for example, as we mentioned, is more like an asset with an indefinite, almost unlimited, useful life, in which the application of the income and expense correlation principle is blurred. This mean of 21 years would also show us a very uneven application of impairment policies in the various European countries, confirming the theses of H1. It could be a further indication that these policies have not been applied uniformly in entities operating in a similar economic environment and under the same accounting framework at consolidated level. As can be seen from the above graph, the mean duration of goodwill on the entities’ balance sheets would clearly indicate that the entities in the main European countries have applied their impairment policies disparately, contrary to what might a priori be expected bearing in mind, as we have mentioned, that these entities operate in similar economic and regulatory markets and, furthermore, they are subject to similar enforcement measures by their supervisors and auditors.
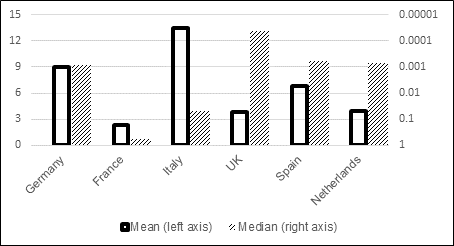
In the following graph, we will corroborate the above through the analysis of the mean and median of the impairment intensity ratio that we have just discussed. It should be noted that on the right axis, which shows the median, the results are shown in reverse, since in most countries the median is very close to 0 because no impairment was recognized in the bulk of the observations.
Graph 8 shows that in almost all the countries the median is practically zero, since no impairment was recognized in most of the years in the sample, while their means are higher as a result of the abrupt impairment recognized particularly in the years in the middle of the crises. Once again, this fact would indicate, on the one hand, that impairments are being recognized insufficiently, since the median is close to 0, and with a certain delay, since they would be concentrated abruptly in the years central to the crisis, offsetting the overvaluation of goodwill in the years prior to the crisis. The case of the French entities, as we have seen, is particular, since it has the highest median, which translates into a greater number of impairment events recognized, but combined with the lowest mean of all the countries. In other words, the French entities have recognized more impairments than the other banks, but of a considerably lower amount. In the case of Italian entities, they recognized significant goodwill impairment losses, especially in 2008 and 2009, with a slightly greater frequency than the other entities (except for France). Also noteworthy is the case of UK entities, with low mean impairments and a median close to 0, which means that they have recognized little goodwill impairment and very infrequently, similarly to the Dutch entities. German entities would be somewhere in between, in terms of both the frequency of their impairments (median) and the amount, which would show us the mean. Lastly, Spanish entities recognized significant impairments, without reaching the Italian figure, in a small number of years, given that their median is one of the smallest in the sample countries.
In summary, following the descriptive analysis of the behaviour of the impairment variable from all possible angles, the results obtained appear to suggest that the accounting measurement policies for goodwill have not been applied uniformly by the credit institutions in the main European countries and that, above all, impairment losses have been recognized in the income statement in an insufficient manner over the years observed and with a delay in respect to the actual consumption of the economic resources acquired which constitute what is known as goodwill. These results would reinforce the confirmation of the first initial hypothesis and ratify the conclusions of the second hypothesis.
6. Conclusions
From the descriptive and statistical analysis of goodwill and goodwill impairment in the group of countries that make up the sample, we reach the following conclusions:
In terms of the relative size of goodwill, the goodwill recognized in the Italian and Spanish banks stands out. The presence of goodwill on the banks' balance sheets is greater in Spain and Italy than in the other countries. In the case of Spain, this can be explained by the fact that the business model of Spanish banks in recent years has been oriented towards corporate growth through international expansion, predominantly in South America, through the purchase of the biggest banks in the region, which has led to the recognition of large amounts of goodwill. In the case of Italy, the rapid banking concentration process, which began in the 1990s and reduced the total number of banks by more than 300, resulted in a large volume of goodwill. The size of German and Dutch banks, on the other hand, is well below the mean of 0.8% of average total assets.
In regards to impairment intensity, which includes the impairment of the initial goodwill in each of the years, the entities in Italy, Spain and Germany were above the mean, recognizing more goodwill impairment than the mean. The UK, Dutch and especially the French banks showed below-mean levels of intensity.
Impairment intensity can be translated into the years of mean balance sheet duration, as a useful life, which is being indirectly allocated to goodwill. As regards the rate of goodwill impairment, in the years included in the sample, the figure for French entities stands out, where goodwill would stay on the balance sheet for 56 years. Bearing in mind that the additions and disposals were not analysed, this is a static analysis, as a result of the limited construction of the model on the basis of the data obtained, regarding the balance of goodwill. Under this premise, the mean duration of goodwill is 21 years, which, for a sample in which the years of economic crisis are very much present, clearly seems a very high figure. This could, to some extent, lead to late recognition of impairment losses, the deferral of those losses and, in general, a discretionary and not very uniform application of impairment policies among entities in the same economic environment, which are subject to the same accounting regulatory framework at the consolidated level. Additionally, this data would seem to reinforce the idea that the application of impairment has been very dispersed (durations of between 7 and 56 years are obtained).
As regards the years in which impairments were recognized, all the countries are in very similar situations, except for France, where the frequency of impairments was higher.
A summary for each of the comparison groups (countries) provides us with the following conclusions:
Germany: the volume of goodwill of German entities is smaller than that of almost all the countries. In these entities, the number of impairment events recognized is similar to the mean of the total sample and the amount is slightly higher, so it could be concluded that their treatment is very similar to the mean.
France: the volume of its goodwill is below the mean. The behaviour of its entities is the most singular of all the countries. There are a greater number of impairments, but of a lower amount, which could indicate an accounting policy in which impairment would be very similar to a systematic amortization with a long useful life. The total consumption of acquired goodwill would not be recognized and, therefore, it could be indirectly offset by the emergence of internally generated goodwill, as we have been mentioning throughout this paper.
Italy: its entities present the largest goodwill of the entire sample grouped by country. They recognized inflated impairments, especially in the crisis years, although they recognize impairments with a frequency above the mean for all entities. It could be concluded that their behaviour also differs from that of the other countries.
UK: it has slightly above-mean goodwill, its frequency in recognizing impairment is similar to that of the German and Spanish entities and slightly above mean, and in terms of intensity, together with Dutch entities, the UK entities recognized losses for an amount below the mean. Therefore, their behaviour is in line with the mean, albeit with a somewhat lower impact on the income statement.
Spain: its entities have large amounts of goodwill, almost at the same level of the Italian entities. They recognized impairment losses of an above-mean amount (intensity) and with a slightly above-mean frequency, although they were especially concentrated on the central crisis years. Their behaviour would be similar to that of the UK and German entities, although with greater impact on the income statement.
The Netherlands: the goodwill of these entities would be the smallest of all the countries. They would have recognized a number of impairments below the mean, similar to the German entities, and for a below-mean amount, in line with the data for the UK entities.
As final conclusions that corroborate the initial hypotheses analysed, we can conclude that: the results obtained in the statistical analysis carried out have confirmed what we have been discussing; the null hypothesis in the Kruskal-Wallis test is rejected and, therefore, it can be stated that the impairment policies have not been applied uniformly in the entities of the countries included in the sample, even though they operate in very similar economic and regulatory environments. Also, we can conclude that impairment would appear to be based on opportunity-seeking business decisions, which has led to insufficient and late recognition of losses, favouring the recognition of internally generated goodwill.
In view of the above, we advocate a return to the valuation of goodwill in which both systematic amortization and impairment are taken into account. This could help to reveal a more accurate image of the economic situation inherent to the ordinary operations of the credit institutions making the financial information more relevant.
Upcoming studies could focus on the impairment implementation. It might be really interesting to observe how impairment has been recognized during the pandemic years. As IASB and FASB are debating about a modification of the valuation framework, new works would contribute to clarify how goodwill is being accounted for in the financial sector.


 nueva página del texto (beta)

