


Servicios Personalizados
Revista
Articulo
 texto en
  Inglés (pdf)
 Artículo en XML
 Referencias del artículo
 Enviar artículo por email
Indicadores
-
 Citado por SciELO
 -
 Accesos
Links relacionados
-
 Similares en
SciELO
Similares en
SciELO
Compartir

 Permalink
Política y gobierno
versión impresa ISSN 1665-2037
Polít. gob vol.27 no.2 Ciudad de México jul./dic. 2020 Epub 17-Feb-2021
Research Notes
Participation, Representation and Political Inclusion. Is There an Indigenous Vote in Mexico?*
1Profesor-investigador del Centro de Estudios Sociológicos en El Colegio de México. Camino al Ajusco 20, Pedregal de Santa Teresa, 10740, Ciudad de México. Tel: (52) 55 5449 3000, ext. 3064. Correo-e: wsonnleitner@colmex.mx.
Deficient political representation of indigenous peoples stands out as a pending issue of Mexico’s democratization, since they are among the most marginalized and discriminated sectors of one of the most diverse, multi-ethnic nations of Latin America. This contribution analyses the recent evolution and the persistent gap in indigenous legislative representation in Mexico. Then, the results of federal elections between 1991 and 2018 are scrutinized in order to identify patterns of voting behavior and trends in electoral turnout in indigenous polling stations, controlling by other socio-demographic variables. The conclusions highlight the inexistence of a specific indigenous vote, the political diversity of indigenous territories and their implications for public policies aimed at expanding indigenous representation and political inclusion.
Keywords: affirmative action; indigenous voting; representation of ethnic groups; political inclusion of minorities
Entre las asignaturas pendientes de la democracia mexicana, destaca el déficit en la inclusión política de las poblaciones indígenas, uno de los sectores más marginados y discriminados de una de las naciones pluriétnicas más diversas de Latinoamérica. Esta contribución analiza la evolución reciente y el rezago persistente de la representación legislativa indígena en México. Luego se estudian los resultados de los comicios federales entre 1991 y 2018, para identificar las tendencias de la participación y las orientaciones del voto en las secciones electorales indígenas del país, controlando por otras variables sociodemográficas. Las conclusiones destacan la ausencia de un voto específico y la diversidad política de las regiones indígenas, e invitan a repensar las políticas públicas orientadas a ampliar la representación e inclusión política indígena.
Palabras clave: acción afirmativa; voto indígena; representación de grupos étnicos; inclusión política de minorías
Does the indigenous vote matter?
Among the pending issues of Mexican democracy, the deficit in the political inclusion of indigenous peoples, one of the most marginalized and excluded sectors of the country, stands out. There is now a clear normative consensus regarding this issue, since it is widely recognized that the participation and representation of indigenous peoples is essential for their inclusion in the concert of voices and votes that define the politics of such a diverse and multiethnic nation like Mexico. However, despite the broad electoral participation of many indigenous communities, a noticeable lag persists in their legislative representation, a lag that is associated with multifaceted practices of discrimination and exclusion —economic, social and cultural.
For this reason, in November 2017, the National Electoral Institute (Instituto Nacional Electoral, INE) approved a general agreement to urge political parties to respect gender parity and to present indigenous candidates for federal legislative seats in twelve of the 28 singe-member districts with more than 40 per cent of indigenous population (INE, 2017). In December of that same year, the Electoral Court of the Federal Judiciary (Tribunal Electoral del Poder Judicial de la Federación, TEPJF) ratified this agreement and expanded the compulsory candidacies to the thirteen districts with more than 60 per cent of indigenous population (TEPJF, 2017). On July 1, 2018, a historic advance was registered in the area of female representation, with the election of 49.2 per cent of female legislators in the Chamber of Deputies and 50.8 per cent of female legislators in the Senate of the Republic. In the case of indigenous political inclusion, however, the results found to be wanting.
Even with the new affirmative action measures, only seven indigenous candidates were elected in 2018. Instead of increasing, the number of elected legislators of indigenous origin went down —it had reached 18 seats in the Chamber of Deputies in 2006, after the creation of the 28 indigenous districts by the 2004 reforms. How can these apparently contradictory results be explained? Why was it not possible to increase the number of elected indigenous legislators? How are ethnic identities linked to the electoral behaviors of Mexicans? Who competes, and who wins in indigenous districts? How much do voters participate and how do they vote in indigenous territories? How can indigenous political representation be improved and expanded?
These questions —which I have been investigating within the framework of two projects1— are more complex than they seem at first sight. Public policies of affirmative action promoted by the electoral authorities presuppose the existence of specific political demands that would be reflected, in turn, in a specific form of policy supply for indigenous peoples. The intersection of these supply and demand curves would thus translate into an indigenous vote. However, this hypothesis must be tested in order to be confirmed. In fact, the evidence collected in my research does not draw the conclusion that there is one electoral constituency in Mexico that is specifically indigenous, nor does it make it possible to prove that in 2018 there was a predominantly indigenous policy supply in the legislative districts with concentrated indigenous populations.
To explore this hypothesis, I analyze biographical data of the 105 candidates registered in the 28 indigenous districts for the 2018 election and compare the result with those of previous elections since 1988. Then, the results of the federal elections between 1991 and 2018 are analyzed to identify the trends of electoral participation and partisan voting in the indigenous electoral sections and to contrast them with those of the mestizo zones, controlling for other variables of territorial inequality and socio-demographics. The findings bring into question the hypothetical existence of an indigenous vote and call to reconsider public policies aimed at expanding indigenous political inclusion. In contrast to the premises of current affirmative action measures, the difficulty in capturing ethno-linguistic identities and their strong socio-territorial heterogeneity, the ambivalence of registration requirements and the low proportion of indigenous candidates in the federal districts with more than 40 per cent of native populations, as well as the plurality of electoral behaviors in the indigenous electoral sections, help explain the reduced number of indigenous legislators.
An ambivalent balance: the gaps in indigenous political representation
Today, there is wide consensus on the need to recognize the cultural diversity and multi-ethnic nature of the Mexican Nation, and to guarantee the rights of indigenous peoples and communities.2 Also, a widespread awareness has taken place regarding the urgency of improving the political inclusion of indigenous populations, through mechanisms that promote political participation and representation of a greater scope, efficiency and quality.
However, these new rights have not been implemented by all entities of the Republic and their results are counterintuitive as to the number of elected indigenous legislators. To date, the reforms have had ambivalent effects in terms of political inclusion and the lag in the area of legislative representation persists, despite sustained electoral participation by citizens, and indigenous peoples and communities. This is due, in part, to the internal heterogeneity and territorial dispersion of indigenous populations in many districts in which they are not a majority, as well as the ambiguity of the registration criteria and the characteristics of the policy supply in these districts.
The labyrinth of ethnicity
Before analyzing whether there is a specific policy supply for indigenous legislative candidates, it is necessary to clarify how this type of identities is conceived in the specific context of the country so that we can determine how to capture and measure them. This invites us to review the approaches that have been developed in this regard in history, anthropology, sociology and demography, with tools and concepts that are still under discussion.
What does it mean to be“indigenous”in Mexico?
There is a complex debate in social sciences on how to define ethnic identities. Ethnic elites always refer to supposedly objective criteria to highlight the characteristics that distinguish and separate them from other human groups. However, these attributes are frequently backed up with subjective differentiations that change according to the contexts in which they are stated. From this perspective, ethnic identities are contingent and situational, relational and inter-subjective socio-political constructions. Therefore, the representation of the socio-cultural features that are used to re-produce ethnic boundaries is much more important than the attributes themselves (Barth, 1969).
In Mexico, autochthonous peoples occupy a peculiar place in the symbolic construction of the Nation, since they are part of the constitutive myth that separated the Mexican from the Creole identity of the Spanish Conquerors. It is an identity highly valued in museums and collective memory, which serves as a central referent of otherness in the construction of miscegenation and of the “raza cósmica” (cosmic race), within a post-revolutionary project of assimilationist integration that also tactically associated it with barbarism and cultural backwardness. The word “indio” (indian) is used pejoratively to stigmatize inappropriate behavior, with a strong component of classicism that is not always or necessarily racial. The “indígena” (indigenous) concept, on the other hand, is used in a neutral way to designate the native populations, although it is still loaded with ambiguous and discriminatory connotations too. Hence the need to question some erroneous ideas strongly rooted in collective imaginations.
When seeking empirical approaches to these populations, the multi-dimensionality of the concept comes to the fore, in contrast to the Manichean character of the predominant social representations. From a historical perspective, the relevant criterion for classification is membership in some pre-Hispanic community. However, it is not easy to establish which groups in fact meet this requirement, since the processes of conquest, colonization and independence were accompanied by sociodemographic transformations that profoundly reshaped the country. Historians thus acknowledge the existence of several thousand “peoples” (formerly called “República de indios” or “Republics of Indians”) whose origin dates back to the Conquest or, in many cases, colonial times (Warman, 2003).
From a cultural perspective, usually the distinctive feature is speaking an indigenous language. Learning a language —and passing it on to your children from early childhood— is a strategic decision that involves years of structured interaction and only makes sense when that skill represents a need or an effective advantage. As Figure 1 illustrates, the number of Mexicans over the age of five who declare that they speak an indigenous language has increased considerably in the last 120 years, going from 2 030 714 in the 1895 Census to 7 386 791 people in the Inter-Census Survey of 2015. During the same period, its proportion decreased in relative terms, going from 16 per cent to less than 8 per cent from 1990, stabilizing around 6.5 per cent between 2010 and 2015. Even more noteworthy is the continuous reduction of the population that does not speak Spanish: it went from 1 794 306 to 910 053 people between 1895 and 2015 (that is, from 15.4 to 0.8 per cent of the total).

Source: Own elaboration based on general population censuses (INEGI, 1895, 1910, 1921, 1930, 1940, 1950, 1960,v1971, 1981, 2001 y 2011) and the Intercensal Survey 2015 (INEGI, 2015).
FIGURE 1 Quantitative evolution of the speakers of indigenous languages (1895-2015)
Upon the risk of underestimating the indigenous population, alternative estimates have been developed. Among these, the “Indigenous population in indigenous households” (“Población indígena en hogares indígenas”) stands out. An indigenous home is defined as “one where the head of the household, his or her spouse or one of the ancestors (mother or father, stepmother or stepfather, grandmother or grandfather, great-grandmother or great-grandfather, great-great-grandmother or great-great-grandfather, mother-in-law or father-in-law) declared to speak an indigenous language”. In 2015, a total of 11 938 749 people, namely 10 per cent of the Mexican population, were indigenous according to this definition (CDI, 2017).
More recently, new survey questions have been experimented with to estimate the so-called “self-affiliation”. A first exercise was carried out with a sub-sample of the INEGI Census in 2000, which captured 5.3 million people who “considered themselves indigenous”. This was replicated in the 2010 Census and in the 2015 Inter-Census Survey, with a substantive modification of the phrasing that expanded its meaning by asking if “According to your culture, (name), do you consider yourself indigenous?” (INEGI, 2016). The underlying problems with these methodologies are reflected in the evolution of the resulting estimates that stand in acute contrast to the evolution of the percentage of speakers of indigenous languages. As can be seen in Figure 2, the proportion of people who self-describe as indigenous increased exponentially, going from 6.1 to 14.9 per cent and to 21.5 per cent between 2000, 2010 and 2015.
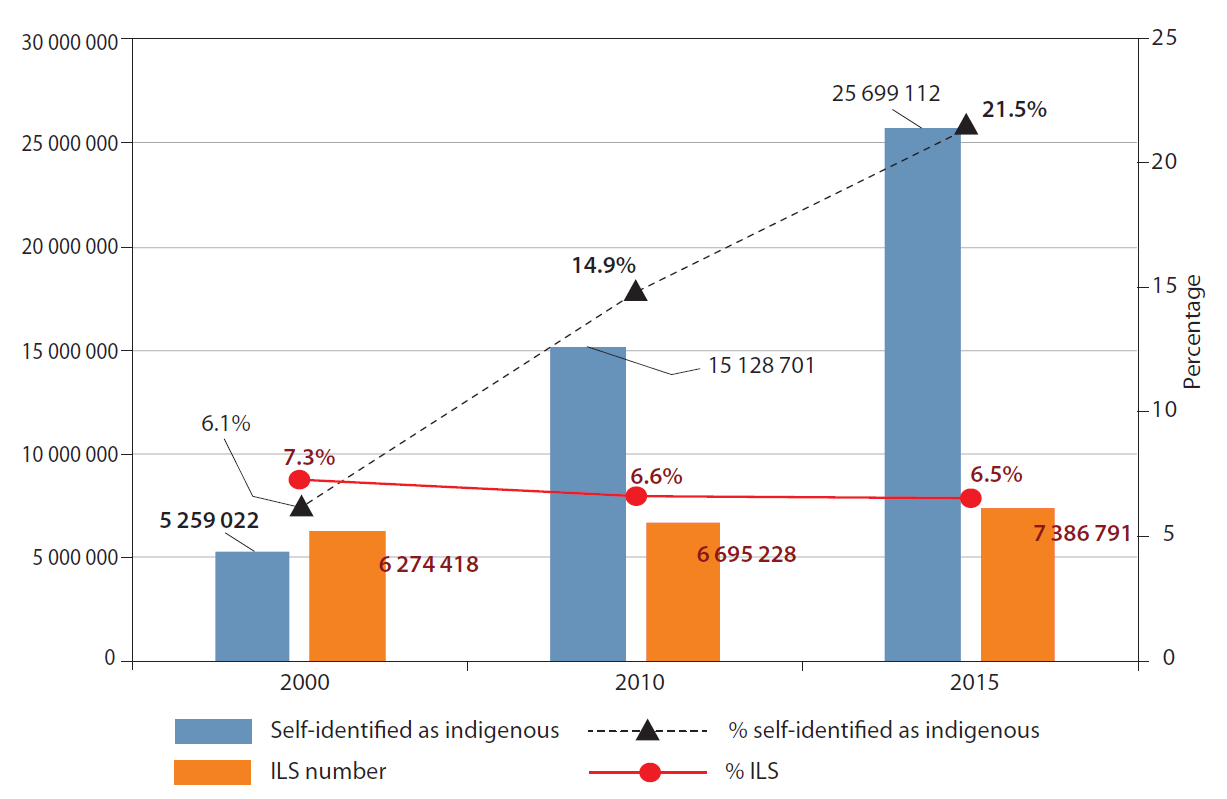
Source: Own elaboration based on general population censuses (INEGI, 1895, 1910, 1921, 1930, 1940, 1950, 1960, 1971, 1981, 2001 y 2011) and the Intercensal Survey 2015 (INEGI, 2015).
FIGURE 2 The growing gap between linguistic and self-description criteria (2000-2015)
To these official estimates we must add the Barómetro de las Américas or Americas Barometer surveys. When asked “Do you consider yourself a white, mestizo, indigenous, black, mulatto, or some other?”, between 6.9 per cent (in 2012), 11 per cent (in 2014) and 9.5 per cent (in 2017) of the respondents answered that they considered themselves “indigenous people”. However, when asked “According to your culture, do you consider yourself indigenous?”, between 43.3 per cent (in 2014) and 47.2 per cent (in 2017) of the same respondents answered affirmatively (LAPOP, 2012-2017).
Rather than being a byproduct of demographic revolution, this growing gap is the result of different understandings and it reveals a gradual transformation regarding the social meaning of the concept “indigenous culture”, which is not reflected in a concomitant expansion of people who decide to transmit an indigenous language to their family members. In this paper, we favor the linguistic criterion, which underestimates the effective number of indigenous people but is more stable and less subjective, in addition to being quantifiable at the finest levels of electoral geography (which is not yet possible for self-affiliation).
Geography and a minimal sociology of indigenous “peoples” and “communities”
The 2010 Census registered 64 ethno-linguistic groups that were concentrated in 803 municipalities, 4 394 electoral sections and 28 338 localities with more than 30 per cent of indigenous language speakers (INEGI, 2011). Five years later, the 2015 Intercensal Survey added six more regional variants, which makes the great linguistic heterogeneity of Mexico worth noting. As Table 1 shows, only 16 groups have more than 100000 inhabitants and only six have a population equivalent to or greater than the average size of a single-member district. In contrast, 36 groups have less than 10 000 inhabitants, 22 have less than 1 000, and five do not even reach 100 inhabitants. Thus, while the Nahuatl people are enough to constitute a small State, other indigenous populations barely reach the necessary magnitude to preserve community autonomy.
TABLE 1 Demographic heterogeneity of ethno-linguistic groups in Mexico
| Indigenous language in Mexico (speakers 3 years and over to 2015) | |||||
|---|---|---|---|---|---|
| Indigenous language | Total | Indigenous language | Total | Indigenous language | Total |
| Náhuatl | 1 725 620 | Tepehuano del sur | 36 543 | Other American languages | 1 126 |
| Maya | 859 607 | Cora | 28 718 | Lacandón | 998 |
| Tseltal | 556 720 | Chontal de Tabasco | 27 666 | Seri | 754 |
| Mixteco | 517 665 | Triqui | 25 674 | Pima | 743 |
| Tsotsil | 487 898 | Yaqui | 20 340 | K’iche’ | 730 |
| Zapoteco | 479 474 | Huave | 18 539 | Chocholteco | 729 |
| Otomí | 307 928 | Popoloca | 18 206 | Jakalteko | 527 |
| Totonaco | 267 635 | Cuicateco | 13 318 | Kumiai | 486 |
| Chol (Ch´ol) | 251 809 | Pame | 12 232 | Texistepequeño | 455 |
| Mazateco | 239 078 | Mam | 11 387 | Cucapá | 278 |
| Huasteco | 173 765 | Tepehua | 10 427 | Paipai | 216 |
| Mazahua | 147 088 | Tepehuano del norte | 9 568 | Kiliwa | 194 |
| Tarasco | 141 177 | Q’anjob’al | 8 421 | Unspecified Tepehuano | 170 |
| Chinanteco | 138 741 | Unspecified Popoluca | 6 122 | Ixcateco | 148 |
| Tlapaneco | 134 148 | Chontal de Oaxaca | 5 064 | Qato’k | 134 |
| Mixe | 133 632 | Sayulteco | 4 117 | Kickapoo | 124 |
| Unspecified indigenous language | 101 187 | Chuj | 2 890 | Pápago | 112 |
| Tarahumara | 73 856 | Akateko | 2 837 | Ixil | 103 |
| Zoque | 68 157 | Chichimeco jonaz | 2 134 | Oluteco | 90 |
| Amuzgo | 57 589 | Guarijío | 2 088 | Teko | 81 |
| Tojolabal | 55 442 | Matlatzinca | 1 568 | Kaqchikel | 61 |
| Huichol | 52 483 | Tlahuica | 1 568 | Ayapaneco | 24 |
| Chatino | 51 612 | Q’eqchi’ | 1 324 | Aguacateco (Awakateko) | 17 |
| Mayo | 42 601 | Unspecified Chontal | 1 135 | ||
| Popoluca de la sierra | 37 707 | ||||
Source: Own elaboration based on the Intercensal Survey 2015 (INEGI, 2015).
This prompts the question about the most suitable territorial level to study the political behavior of indigenous populations. The 28 000 localities include thousands of scattered hamlets where only a few isolated families reside, making them too small to be considered as culturally autonomous indigenous “peoples”. At the same time, the classic anthropological approach of studying entire municipalities to capture traditional fiefdom systems and community networks of mutual support, which made a lot of sense from the 1940s to the 1960s, has become insubstantial as a result of the population explosion. For example, the municipality of San Juan Chamula had 16 000 inhabitants in 1940 but now has 87 000 inhabitants distributed in more than one hundred localities which are organized in agencies that have conflicting relations with the municipal authority.
From an economic perspective, the importance of the forms of social property in the countryside is worth highlighting. In his reference work, Arturo Warman considers that, in the year 2000, around 854 000 indigenous “comuneros” (or coproprietors) and “ejidatarios” resided and worked in 5 632 ejidos and agrarian communities (Warman, 2003).3 These productive units do not operate in a vacuum. As Aguirre Beltrán demonstrated, the economy of the communities is closely tied to the commercial centers wherein they sell their production and stock up on foreign goods. Therefore, these are part of broader socio-economic systems, in the image of the famous “refuge regions” (Aguirre Beltrán, 1967).
Accordingly, to consider different complementary levels of analysis is useful to identify communitarian policy instruments among the region, the municipality and the locality. Even though they do not perfectly correspond to the “community” level, the sections delimited by the Federal Electoral Institute (IFE) offer advantages for the study of indigenous electoral behavior. These were designed to distribute the population in a balanced manner, so they are relatively homogeneous in their demographic size. The 3 339 predominantly indigenous sections located in the rural area have between 532 (in 1991) and 1200 registered voters (in 2018) on average. These sections, then, make it possible to capture the internal political diversity of the municipalities, the differences and the tensions between the peripheral agencies and the municipal authorities that usually manage public resources. INEGI added the data from the 2010 Census at this constitutive level of Mexican political geography, so we have many socio-demographic data that can be contrasted with electoral behavior on this scale (INEGI-IFE, 2012).
To begin with, I created a dichotomous variable that captures the 3339 predominantly indigenous sections and provides a first approximation to the specificity of the electoral behaviors these microregions comprise, in contrast to the predominantly mestizo sections. As can be seen in Table 2, 65 per cent of all Mexican indigenous populations reside in them, representing on average 85 per cent of indigenous-district population.
TABLE 2 Sectional distribution of the population by percentage speakers of indigenous languages (2010)
| ILS (intervals) (%) | Number of sections | Population older than three years old (2010) | ILS older than three years old (2010) | ILS (%) | ILS Total (%) | Total ILS (accumulated) (%) |
|---|---|---|---|---|---|---|
| 90-100 | 1 692 | 2 759 497 | 2 674 958 | 96.9 | 39.0 | 39.0 |
| 65-90 | 1 046 | 1 593 012 | 1 260 701 | 79.1 | 18.4 | 57.3 |
| 50-65 | 601 | 906 503 | 521 357 | 57.5 | 7.6 | 64.9 |
| 50-100 | 3 339 | 5 259 012 | 4 457 016 | 84.8 | 64.9 | 64 .9 |
| 40-50 | 475 | 748 147 | 337 028 | 45.0 | 4.9 | 69.8 |
| 30-40 | 574 | 935 288 | 326 278 | 34.9 | 4.8 | 74.6 |
| 0-30 | 62 294 | 94 536 794 | 1 744 629 | 1.8 | 25.4 | 100.0 |
| Total | 66 682 | 101 479 241 | 6 864 951 | 6.8 | 100.0 |
Source: Own elaboration based on the Intercensal Survey 2015 (INEGI, 2015).
When one works at this level, the temptation to commit ecological fallacies must be resisted. Generally, each section contains between two and five rural localities, so sectional averages do not allow inferences to be made for the level of individual voters. To locate these sections in their economic and sociocultural environment, we also distinguished seven large indigenous regions, which comprise 2 409 of the 3 339 predominantly indigenous sections and can be found on Figure 3.
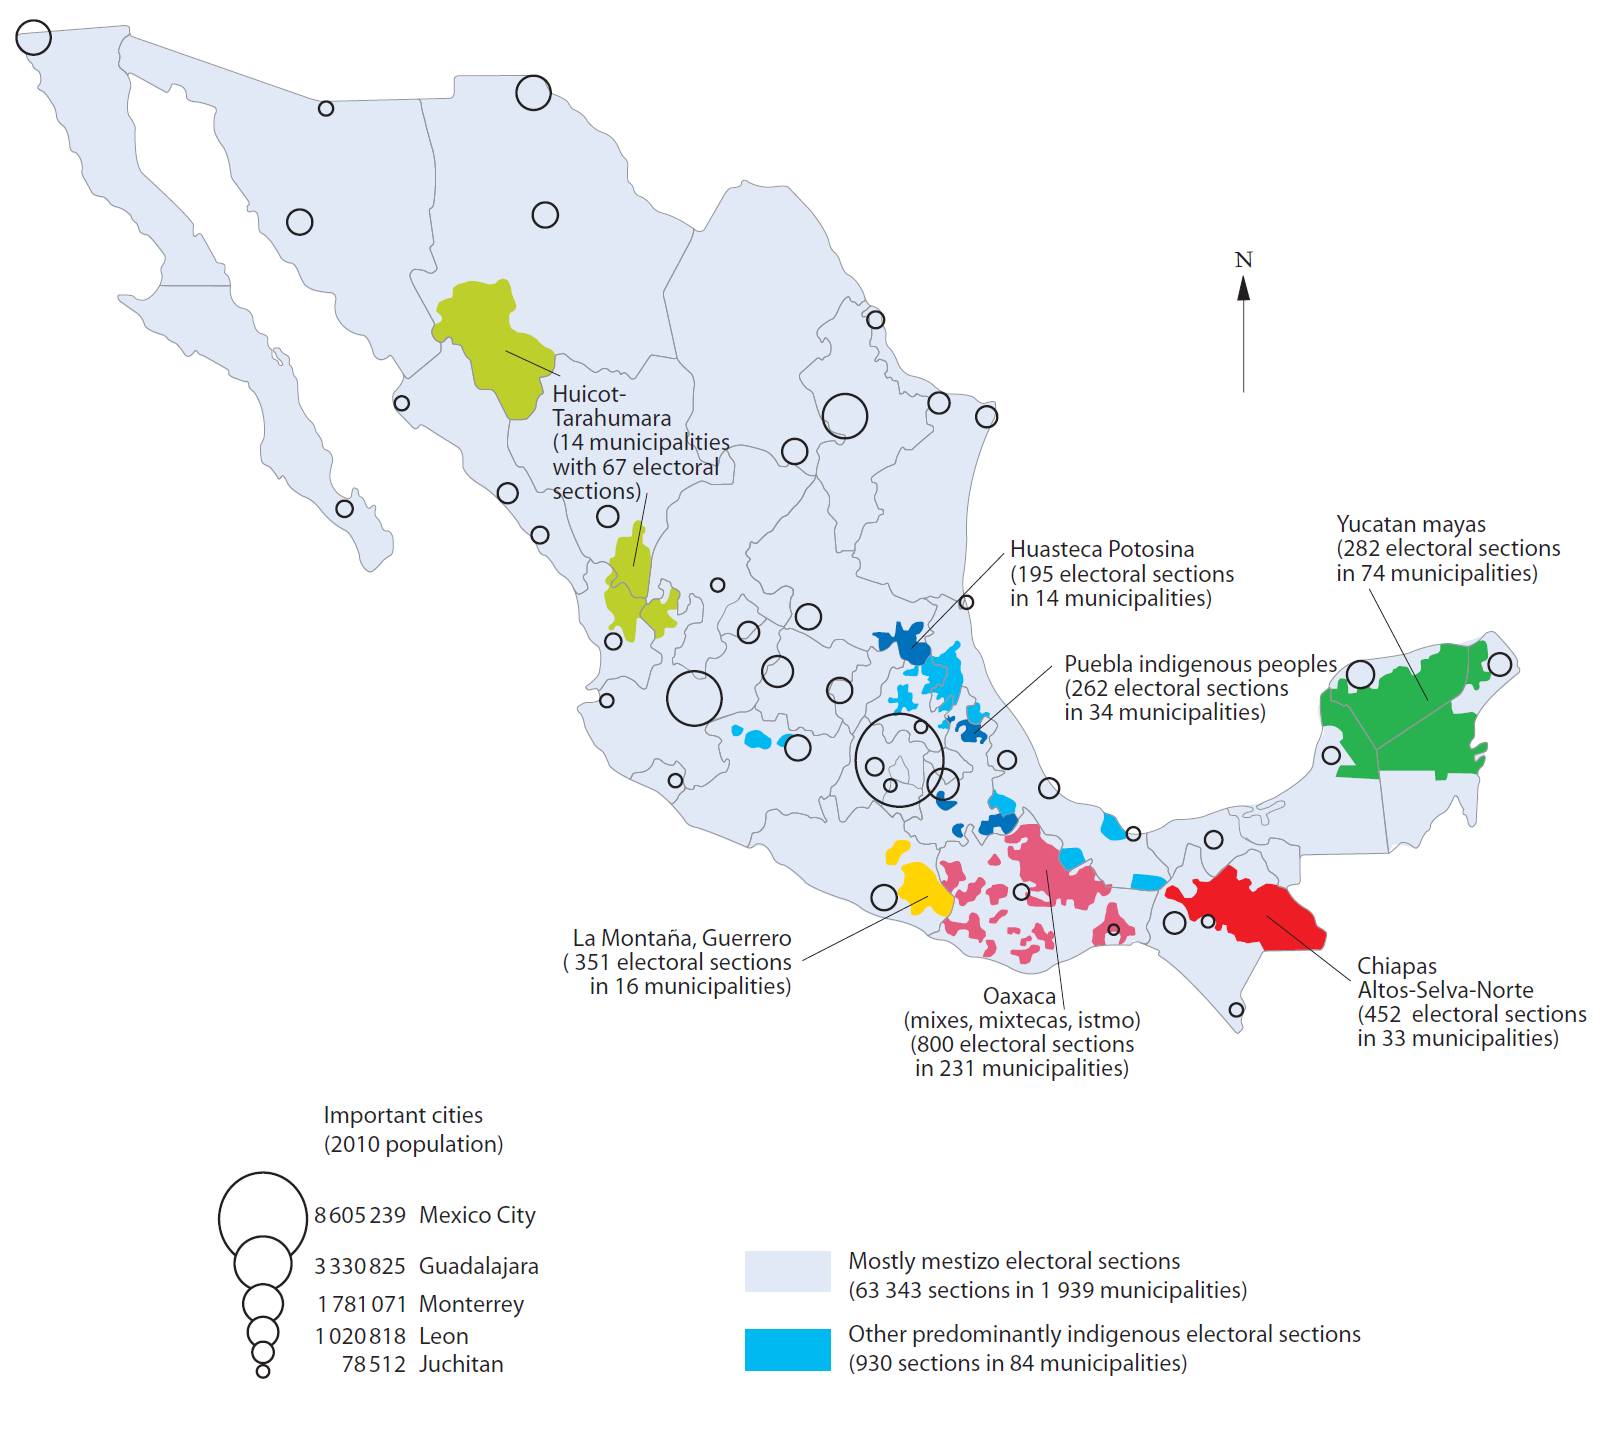
Source: Own elaboration based on INEGI-IFE (2012).
FIGURE 3 Geographical distribution of seven predominantly indigenous regions (2010)
How, then, are ethnic-linguistic affiliations linked to recent dynamics of political representation in the Chamber of Deputies?
A persistent lag in the field of legislative representation
Contrary to a recurring idea, the presence of indigenous deputies in the Congress of the Union is not new. As indicated by an investigation carried out during 2011 and 2012, they occupied at least four seats in the LIV Legislature of the Congress of the Union (1988-1991). However, historical trends do reveal a persistent lag in the area of indigenous legislative representation, despite an ephemeral increase in the LX and LXI Legislatures, elected in 2006 and 2009 (Sonnleitner, 2013).
In 2004, the IFE promoted a reform to create 28 federal single-member districts with more than 40 per cent of the indigenous population. This measure of positive discrimination sought to increase the number of indigenous legislators. In 2006, 18 indigenous deputies were elected (one by proportional representation and 17 by relative majority), maintaining a similar proportion in 2009 with the election of 17 deputies (eleven by relative majority and six by proportional representation). However, the effects of this initiative did not last. In 2012 and 2015, their number was significantly reduced to ten, with a continuous decrease in the number of indigenous deputies elected in single-member districts: this number went from seven to six between both Legislatures, and again to seven in 2018 (Figure 4).
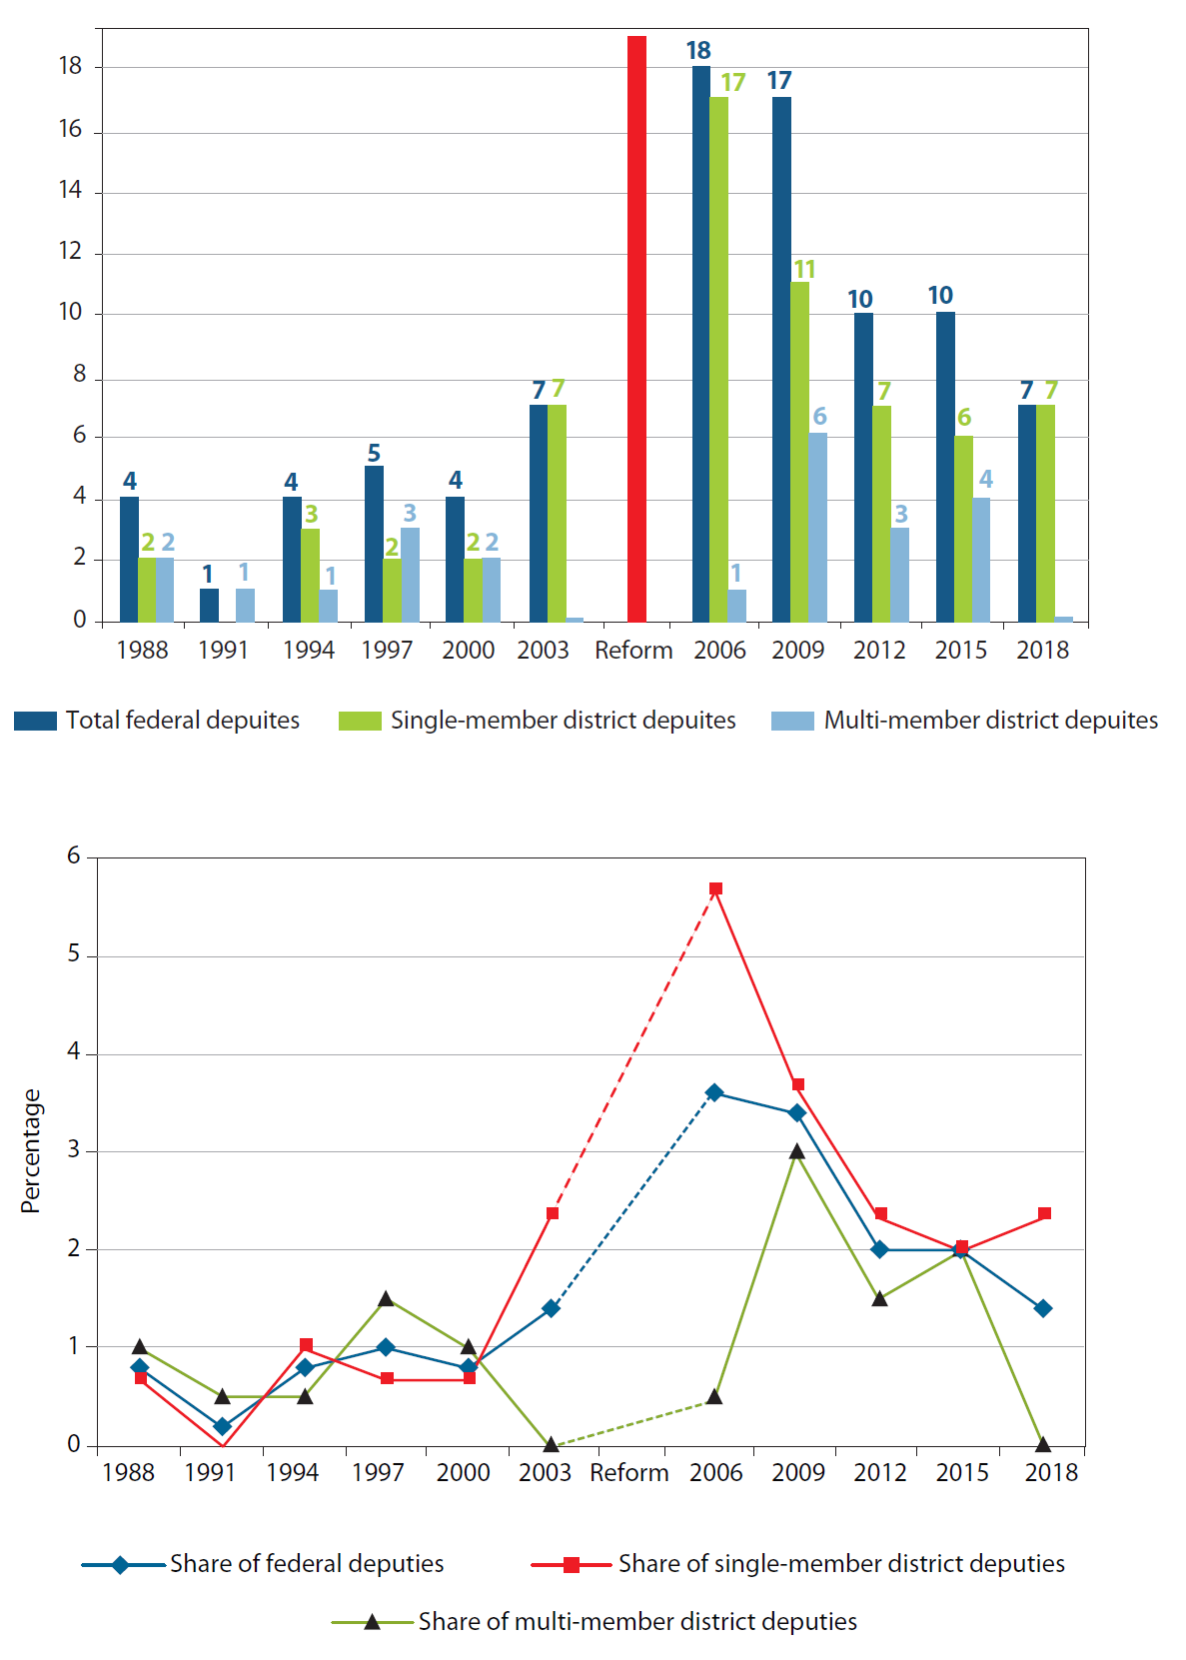
Source: Own elaboration based on Sonnleitner (2013) and INE (2018).
FIGURE 4 Number and percentage of deputies of indigenous origin (1988-2018)
Counter-intuitively, since 2009 the number of elected legislators of indigenous origin has gone down. To clarify this seemingly paradoxical trend, let us analyze two complementary problems related to the design of the 28 “indigenous” singe-member districts; and the operational definition of who can register as candidates in them.
The dispersion of indigenous populations in 28 single-member districts
Firstly, it is necessary to recognize the existence of a possible technical error in the design of the districts, which could be corrected by means of a more efficient affirmative gerrymandering. During the first reform of 2004/2005, a threshold that was too low (40%) was adopted and the highest estimates of the indigenous population of the National Commission for the Development of Indigenous Peoples (Comisión Nacional para el Desarrollo de los Pueblos Indígenas, CDI) were taken as a benchmark. For this reason, between 2006 and 2015 only fourteen “indigenous” districts had, as a matter of fact, effective majorities and, only in ten of them, two out of every three voters spoke any indigenous language (Table 3). Thus, by seeking to increase the number of districts, indigenous voters were dispersed, weakening the expected effects of affirmative gerrymandering rather than creating comparative advantages for indigenous candidates.
TABLE 3 Ethno-linguistic composition of the 28 indigenous districts (2006-2015 and 2018)
| State | Federal district (2006-2015) | Population (2005) | Indigenous households (2005) (%) | ils older than five years old (2005) | State | Federal district (2018) | Population (2015) | Indigenous households (CDi 2015) (%) | ils older than five years old (2005) |
|---|---|---|---|---|---|---|---|---|---|
| Yucatan | 01 | 313 935 | 89.5 | 69.7 | Chiapas | 3 | 360 651 | 91.6 | 85.1 |
| Oaxaca | 02 | 294 604 | 89.1 | 81.0 | Yucatan | 5 | 408 144 | 82.2 | 53.6 |
| Yucatan | 05 | 335 666 | 84.2 | 58.4 | Yucatan | 1 | 397 539 | 78.5 | 55.6 |
| Guerrero | 05 | 334 834 | 83.2 | 76.4 | Chiapas | 2 | 341 122 | 77.7 | 70.7 |
| Puebla | 04 | 348 885 | 80.2 | 66.2 | Guerrero | 5 | 375 497 | 74.8 | 64.8 |
| Hidalgo | 01 | 344 209 | 78.0 | 65.4 | Chiapas | 1 | 309 727 | 73.3 | 65.8 |
| Oaxaca | 04 | 321 044 | 76.6 | 66.1 | San Luis Potosi | 7 | 394 708 | 73.2 | 57.2 |
| Chiapas | 02 | 287 687 | 74.8 | 74.0 | |||||
| San Luis Potosi | 07 | 372 306 | 74.3 | 61.0 | Hidalgo | 1 | 411 307 | 72.6 | 58.6 |
| Veracruz | 2 | 376 917 | 69.5 | 55.1 | |||||
| Veracruz | 02 | 365 776 | 72.9 | 59.1 | Oaxaca | 2 | 390 979 | 62.8 | 53.6 |
| Chiapas | 05 | 314 128 | 72.2 | 66.6 | Chiapas | 5 | 380 630 | 60.8 | 51.4 |
| Chiapas | 01 | 365 666 | 71.8 | 71.1 | Oaxaca | 4 | 420 649 | 59.0 | 47.5 |
| Chiapas | 03 | 301 133 | 66.8 | 73.5 | Oaxaca | 6 | 386 817 | 58.6 | 47.3 |
| Oaxaca | 07 | 329 088 | 63.8 | 47.2 | Chiapas | 11 | 294 819 | 58.4 | 52.1 |
| Oaxaca | 06 | 324 848 | 62.5 | 52.0 | Veracruz | 18 | 426 531 | 53.2 | 44.2 |
| Yucatan | 02 | 303 554 | 61.4 | 35.0 | Guerrero | 6 | 411 791 | 52.0 | 45.6 |
| Puebla | 16 | 284 521 | 57.6 | 48.5 | Oaxaca | 7 | 390 874 | 51.5 | 36.2 |
| Veracruz | 06 | 325 892 | 52.2 | 35.6 | Puebla | 2 | 403 513 | 49.3 | 40.3 |
| Veracruz | 18 | 338 583 | 52.1 | 44.0 | Puebla | 4 | 405 506 | 46.4 | 36.4 |
| Mexico | 09 | 419 341 | 49.6 | 24.7 | Yucatan | 2 | 399 129 | 45.6 | 23.1 |
| Quintana Roo | 02 | 299 581 | 47.2 | 31.5 | Oaxaca | 9 | 393 164 | 44.7 | 34.7 |
| Veracruz | 6 | 401 040 | 44.1 | 30.4 | |||||
| Hidalgo | 02 | 325 737 | 45.8 | 26.7 | Quintana Roo | 2 | 343 324 | 44.0 | 27.6 |
| Oaxaca | 11 | 335 878 | 43.2 | 34.2 | |||||
| Oaxaca | 10 | 303 801 | 42.4 | 33.3 | Oaxaca | 5 | 379 870 | 42.5 | 30.5 |
| Puebla | 01 | 354 471 | 41.5 | 28.9 | Puebla | 3 | 410 363 | 42.4 | 27.0 |
| Oaxaca | 05 | 282 929 | 41.5 | 27.1 | Oaxaca | 1 | 392 417 | 41.8 | 28.6 |
| Campeche | 01 | 328 299 | 40.5 | 24.0 | Hidalgo | 2 | 397 706 | 40.1 | 24.0 |
| Oaxaca | 01 | 307 864 | 40.4 | 27.8 | Puebla | 1 | 402 163 | 40.0 | 26.0 |
Source: Author’s elaboration with data from CDI (2006 and 2017) and INEGI (2006 and 2015).
This problem was not solved during the last electoral re-distribution process that took place between 2016-2017. Instead of grouping indigenous communities into predominantly indigenous legislative districts (with thresholds of 50 or 65 per cent of indigenous language speakers, to generate more effective affirmative gerrymandering), the same number of districts (28) was maintained with the same threshold (40%) and the same criteria (population in indigenous households). Therefore, only twelve constituencies were created with more than 50 per cent of indigenous language speakers, of which only four have 65 per cent or more of indigenous language speakers, once again diluting the effective proportion of indigenous populations and the potential comparative advantages for their candidates in sixteen multiethnic districts (Table 3).
The disputed indigenous identity: to be, or not to be an“indigenous candidate”
Secondly, a more complex variable must be considered, related to the ambivalence of the criteria for registering as an indigenous candidate. Who competed, and who was elected in the indigenous districts?
The tensions surrounding the nomination of candidates in the thirteen districts with the highest percentage of indigenous population, revealed the difficulties in defining which of them could be considered “indigenous”. From a legalistic standpoint, the INE adopted flexible criteria, privileged self-affiliation and allowed multiple forms of accrediting community ties, for example with proof of having worked for the benefit of some community. This raised questions about a significant number of candidacies. For instance, the challenges that arose in the Chiapas districts 02 of Bochil and 11 of Las Margaritas, where two high-ranking officials of the government of Manuel Velasco Coello (locally known as “el güero Velasco”) ran for office, are illustrative. Despite the fact that public opinion unanimously perceived them as mestizos, they were elected and confirmed by controversial sentences, based on their “qualified self-affiliation” (TEPJF, 2018).
Beyond the controversial criteria adopted by the electoral authorities, the situational complexity and the inter-subjective, contextual and relational nature of indigenous identities in Mexico became clear. For our research, we managed to collect data on the trajectories of 85 of the 105 candidates that were registered in the 28 districts with more than 40 per cent of indigenous population. In addition to self-affiliation and community collaboration, we considered other complementary criteria (including the use of traditional clothing, speaking an indigenous language, having held office in the community and/or indigenous representative positions) to assess whether these candidacies were presented (and were publicly recognized) as indigenous. In contrast to their gender composition (45% of women and 55% of men), only twenty of these (23.5%) were publicly recognized as indigenous (10 women and 10 men) while 65 were considered as being of mestizo origin. In the thirteen districts where political parties had a formal obligation to present indigenous candidates, 44 candidacies were registered (48% women and 52% men), of which ten had indigenous identity (22.7%) and 26 had mestizo identity (no information was obtained for the remaining eight).
In July 2018, four male, and three female indigenous federal deputies were elected. Five of them competed successfully in one of the twelve predominantly indigenous districts (42%), while the remaining two did so in one of the other sixteen districts with more than 40 per cent indigenous population (13%). Thus, a clear lag persists in terms of indigenous representation, which extends here to gender parity as well, particularly in the thirteen districts with more than 60 per cent of the population in indigenous households, where only four women were elected deputies (31%) against nine elected male legislators (69.2%). Box 1 summarizes the biographical information of these legislators and allows locating the districts where they were elected.
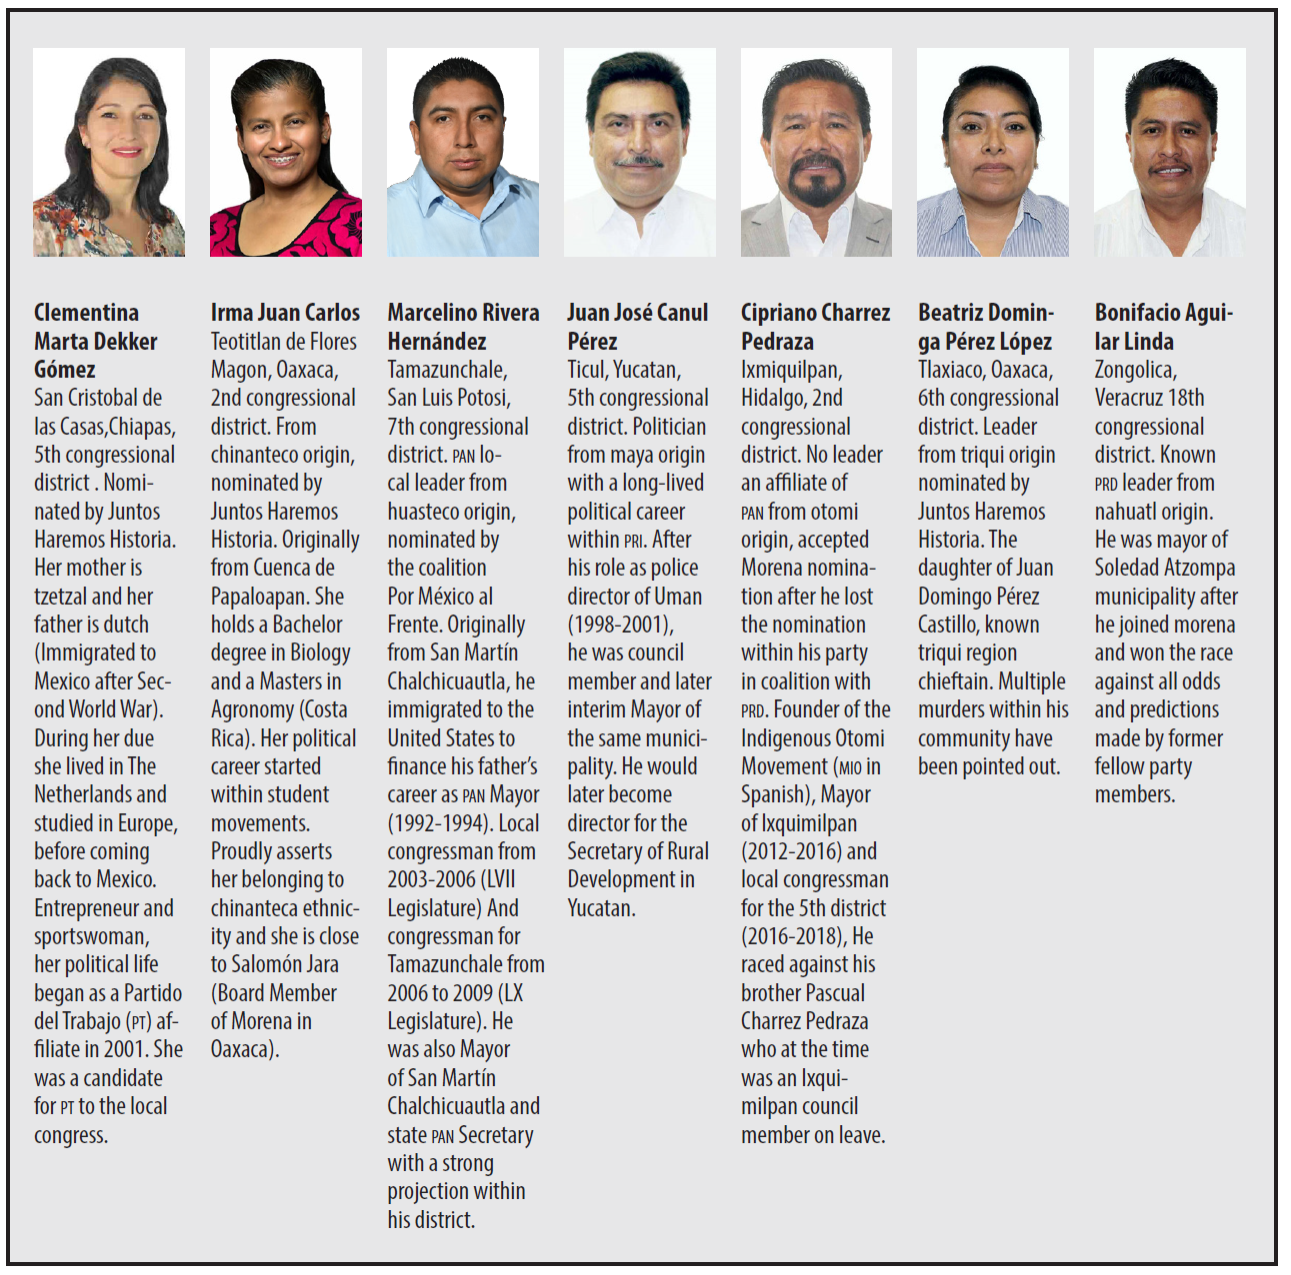
Source: Own elaboration with data from the project “Observando los desafíos de la inclusión democrática en México” (Democracia, Derechos Humanos y Seguridad, El Colegio de México, Electoral Observation Fund 2017-2018, United Nations Development Programme).
BOX 1 Elected federal deputies of indigenous origin (2018)
These results contrast with the progress made in gender equality. Instead of increasing with the new affirmative action measures, the number of legislators of indigenous origin was reduced, returning to the levels of 2003, before the 28 indigenous districts were created. To understand the persistence of these gaps, the question about the existence of an electoral behavior that is specifically indigenous is in order.
Was there an “indigenous” vote from 1991 to 2018?
Let us now investigate the results of the presidential and federal deputy elections held from 1991 to 2018. Before controlling for the possible effects of other socio-demographic variables and becoming interested in the vote of seven major ethno-linguistic regions, I compare the mestizo electoral sections with the indigenous sections. How does one vote in indigenous territories? Does ethno-linguistic belonging turn into a specific and common electoral pattern?
How does the indigenous mexican vote?
To begin with, let’s avoid committing culturalist fallacies. The first of these is to assume that elections are external and of no interest to indigenous peoples. As can be seen in Table 4, this premise has no empirical support. Indeed, until 2006, the 3 339 sections with more than 50 per cent of indigenous language speakers were characterized by lower rates of electoral participation. However, since then the trends have been reversed and, today, they register higher averages than those observed in the mestizo sections.
TABLE 4 Electoral participation in the predominantly indigenous sections
| Presidential elections | 1994 | 2000 | 2006 | 2012 | 2018 |
|---|---|---|---|---|---|
| Mixed-race sections | 77.2 | 63.0 | 57.7 | 63.4 | 63.5 |
| Largely indigenous sections | 64.8 | 57.3 | 55.3 | 68.6 | 69.9 |
| Difference | -12.4 | -5.6 | -2.5 | 5.2 | 6.4 |
Source: Own elaboration based on INEGI-IFE (2012), IFE (2012) and INE (2018).
Another common fallacy assumes that indigenous policy is unanimous and consensual, which is why communities oppose multi-party elections. Without a doubt, in many indigenous communities there is a rejection of traditional parties and a commitment to so-called “uses and customs”. However, this movement focuses on the renewal of municipal elites. In the elections for president and federal deputies, the Effective Number of Electoral Parties (Nepel) does not present substantive differences with the mestizo and the predominantly indigenous sections: after having reached 1.6 in 1991 (single-party context), this index reached the threshold of bipartisanship since 1994 (2.6) and tri-partisanship since 2009. Thus, now it stands at an average of 3.4 (that is, in a format of more than three relevant parties, just like what is observed on average in the mestizo sections).
Let us now look at the composition of the vote in the different multi-ethnic contexts (mixed, majority and almost exclusively indigenous). For this, we analyze the results in the 4 352 electoral sections with more than 30 per cent of indigenous language speakers. To contrast them with the rest of mestizo sections, we distinguish five sub-categories with increasing percentages of indigenous populations: the 568 sections with 30-40 per cent and the 473 sections with 40-50 per cent (where mestizos have strong territorial presence), the 596 sections with 50-65 per cent and the 1 039 sections with between 65-90 percent (where mestizos are visible minorities) and the 1 676 sections with more than 90 per cent of indigenous language speakers (where mestizos are a small minority).
In 2018, Andrés Manuel López Obrador (AMLO) and Ricardo Anaya in the presidential race as well as their respective party platforms, Movimiento Regeneración Nacional (Morena) and the Partido Acción Nacional (PAN) in the legislative race all underperformed in the different types of indigenous sections, while the Partido de la Revolución Democrática (PRD) and the Partido Revolucionario Institucional (PRI) held up better there than in the mestizo sections. This different result is also reflected in the percentages of sections that the different candidates/parties managed to win: AMLO wins first place in 79.6 per cent of the mestizo sections but only achieves this in 61.8 per cent of the eminently indigenous sections; Meade (the PRI candidate), on the other hand, only wins in 5.2 per cent of the mestizo sections but reaches first place in 21 per cent of the indigenous sections. As for Jaime Rodríguez Calderón, also known as “El Bronco”, his votes are clearly concentrated in the mestizo sections. The other parties (particularly PT and PVEM) capture a slightly higher number of votes in multi-ethnic contexts, receiving 23.9 per cent in the sections with more than 90 per cent of indigenous language speakers. These figures confirm what we already mentioned above: despite being characterized by a greater presence of the PRI and the PRD, today the indigenous sections have a partisan diversity that is very similar to that of the mestizo regions (Table 5).
TABLE 5 The (de-)composition of the vote in the indigenous sections (2018)
| Num. Sections by intervals of ILS (%) | Num. Sections | ILS (%) | Turnout | AMLO (Pres.) | Won by AMLO (%) | Morena (Dip.) | Anaya (Pres.) | Won by Anaya (%) | PAN (Dip.) | PRD (Dip.) | Meade (Pres.) | Won by Meade (%) | PRI (Dip.) | Bronco (Pres.) | Others (Dip.) | NEPEL (Dip.) |
|---|---|---|---|---|---|---|---|---|---|---|---|---|---|---|---|---|
| 90-100 | 1 676 | 96.9 | 69.8 | 48.2 | 61.8 | 31.4 | 21.1 | 15.9 | 11.1 | 10.1 | 30.0 | 21.0 | 23.5 | 0.6 | 23.9 | 3.3 |
| 65-90 | 1 039 | 78.9 | 69.4 | 50.7 | 67.7 | 33.4 | 21.9 | 15.0 | 14.9 | 8.5 | 26.5 | 16.7 | 23.3 | 0.9 | 20.0 | 3.4 |
| 50-65 | 596 | 57.5 | 70.9 | 52.0 | 71.1 | 33.0 | 21.5 | 14.1 | 15.6 | 7.5 | 25.3 | 14.0 | 23.7 | 1.2 | 20.3 | 3.6 |
| 40-50 | 473 | 45.0 | 71.1 | 53.7 | 73.1 | 34.9 | 19.3 | 10.5 | 14.7 | 7.2 | 25.6 | 16.2 | 24.4 | 1.4 | 18.8 | 3.4 |
| 30-40 | 568 | 34.9 | 70.5 | 53.1 | 75.8 | 35.0 | 19.5 | 9.4 | 15.1 | 6.2 | 25.7 | 13.8 | 24.2 | 1.7 | 19.5 | 3.5 |
| 0-30 | 62 327 | 1.7 | 63.4 | 52.8 | 79.6 | 36.7 | 23.7 | 13.9 | 19.4 | 5.7 | 18.2 | 5.2 | 18.6 | 5.2 | 19.6 | 3.6 |
| Total | 66 679 | 6.4 | 63.8 | 52.7 | 78.8 | 36.5 | 23.5 | 13.9 | 19.0 | 5.9 | 18.8 | 6.0 | 18.9 | 4.9 | 19.7 | 3.6 |
Source: Own elaboration based on INEGI-IFE (2012), IFE (2012) and INE (2018). Note: These percentages slightly differ from the official returns because they do not include votes cast in special voting booths and abroad.
However, it would be premature to conclude that the indigenous electorate is more participatory, and more inclined toward the PRI and/or the PRD than its mestizo counterpart. As we will see below, these differences may well be driven by socio-demographic characteristics.
Neither does the “indigenous” category capture the heterogeneity of situations in which the different indigenous communities of the country live in. For example, let’s analyze the vote in seven regions built upon the predominantly indigenous sections. Rather than a consistent behavior, it is more convenient to speak of a marked diversity of votes that are related to the socio-territorial dynamics of these eminently indigenous regions. Voter turnout fluctuates greatly among them, reaching as little as 56.6 per cent in the Huicot-Tarahumara region, or as much as 84 per cent among the Maya of the Yucatan peninsula. Meade’s success is impressive in both regions (where he wins 53.7% and 42.9% of the sections) and contrasts with his mediocre results in Guerrero, Oaxaca and the rest of mestizo and indigenous sections (Table 6).
TABLE 6 Voting in seven indigenous regions (elections for deputies, 2018)
| Regions with more than 50 percent of ILS | Num . Sections | Turnout | AMLO (Pres.) | Won by AMLO (%) | Morena (Dip.) | Anaya (Pres.) | Won by Anaya (%) | PAN (Dip.) | PRD (Dip.) | Meade (Pres.) | Won by Meade (%) | PRI (Dip.) | Others (Pres.) | Others (Dip.) | NEPEL (Dip.) |
|---|---|---|---|---|---|---|---|---|---|---|---|---|---|---|---|
| Huicot- Tarahumara | 63 | 56.6 | 31.7 | 25.4 | 17.8 | 19.8 | 14.9 | 14.7 | 2.6 | 48.1 | 53.7 | 41.4 | 0.4 | 23.5 | 3.3 |
| Peninsula de Yucatan | 272 | 84.0 | 29.5 | 29.4 | 15.9 | 31.3 | 25.9 | 27.2 | 5.6 | 38.5 | 42.9 | 38.4 | 0.7 | 12.9 | 3.3 |
| Chiapas | 443 | 71.5 | 50.1 | 61.3 | 34.6 | 9.9 | 4.4 | 2.7 | 5.8 | 38.8 | 32.3 | 19.6 | 1.1 | 37.3 | 3.3 |
| Puebla | 262 | 77.5 | 42.0 | 56.9 | 25.5 | 28.8 | 21.8 | 22.4 | 6.8 | 28.4 | 21.8 | 28.1 | 0.9 | 17.1 | 3.7 |
| San Luis Potosi | 195 | 71.5 | 40.8 | 64.1 | 17.7 | 28.2 | 21.0 | 22.8 | 9.6 | 29.5 | 14.9 | 27.5 | 1.5 | 22.4 | 4.5 |
| Guerrero | 346 | 69.5 | 53.0 | 68.7 | 29.6 | 23.3 | 17.9 | 4.4 | 19.2 | 23.3 | 12.5 | 19.6 | 0.5 | 27.2 | 3.4 |
| Oaxaca | 794 | 63.7 | 64.2 | 87.0 | 45.7 | 13.0 | 2.9 | 5.3 | 9.9 | 22.0 | 9.6 | 19.6 | 0.8 | 19.5 | 3.1 |
| Mixed-race sections | 64 544 | 63.3 | 52.9 | 79.6 | 36.8 | 23.6 | 13.8 | 19.4 | 5.6 | 18.1 | 5.3 | 18.6 | 5.3 | 19.7 | 3.6 |
| Other indigenous regions | 615 | 69.4 | 48.5 | 65.5 | 33.4 | 28.4 | 29.0 | 20.6 | 8.0 | 22.0 | 5.2 | 19.0 | 1.0 | 19.0 | 3.6 |
Source: Own elaboration based on INEGI-IFE (2012) and INE (2018).
In turn, Anaya’s results vary strongly among the indigenous regions of Chiapas and Oaxaca (where the PAN is mostly absent), and those that are located in San Luis, Puebla and Yucatan (where he obtains between 28.2 and 31.3 per cent of the valid vote). The PRD barely receives 2.6 per cent of the vote in the Huicot-Tarahumara region but captures 9.9 per cent in Oaxaca, 9.5 per cent in San Luis and 19.2 per cent in the indigenous Montaña de Guerrero. In the end, Morena is not the exception: López Obrador’s results fluctuate between 29.5 per cent in Yucatan and 64.2 per cent in Oaxaca, differences that are due to the success/failure of his state campaigns and not to ethno-linguistic variables.
It is striking to observe that in some indigenous regions the vote is more fragmented than in the mestizo zone, a result captured by the high number of votes going to other parties. This electoral diversity of the indigenous universe is represented in Figure 5, which synthesizes the political plurality of these seven indigenous regions.

Source: Own elaboration based on INEGI-IFE (2012) and INE (2018).
FIGURE 5 The composition of the vote in seven indigenous regions (legislative elections, 2018)
Schooling, language and electoral behavior (1991-2018)
Secondly, let’s analyze the electoral results of the elections for federal deputies from 1991 to 2018, distinguishing between the trends of the mestizo and indigenous electoral sections and controlling for the average level of schooling, in order to establish if there were specific electoral patterns in the indigenous territories.
As is well known, in many countries electoral participation increases at a higher level of schooling. In Mexico, this relationship is confirmed although it is weaker than in consolidated democracies (at the section level, the Pearson correlation between the school average and the average of electoral participation from 1991 to 2018 is +0.354). However, there is also a clear negative correlation between schooling and the sectional percentages of speakers of indigenous languages (-0.341). Therefore, to establish whether there is an indigenous vote it is essential to analyze the levels of electoral participation in light of the strong territorial inequalities of schooling.
To do this, we grouped the electoral sections into four categories that synthesize the averages of: the 2 697 predominantly indigenous sections with an average schooling of less than six years (where 87 per cent of the population speaks an indigenous language); the 11 511 mestizo sections with an equivalent level of schooling (in which only 3.8 per cent of the population speaks an indigenous language); the 36 727 sections with six to ten years of schooling (in which 3.6 per cent speak an indigenous language);4 as well as the 15 730 mestizo sections with more than ten years of schooling (in which only 1 per cent speaks an indigenous language).
As Figure 6 illustrates, electoral participation in Mexico is highly volatile: it reached 78.3 per cent in the sections with the highest schooling in 1994 and bottomed out with 40.3 per cent in the sections with intermediate schooling in the 2003 elections. It always increases when the legislative elections overlap with the presidential elections (in 1994, 2000, 2006, 2012 and 2018) and is notably weaker in the mid-term elections. Until 2006, participation was higher in the sections with more schooling, especially in the presidential elections. However, from 2006 onward it increased significantly in the sections with low education, regardless of whether they were mestizo or indigenous. Finally, since 2009, electoral participation has been equal, or even higher, in the eminently indigenous sections than in the sections with the highest schooling averages.
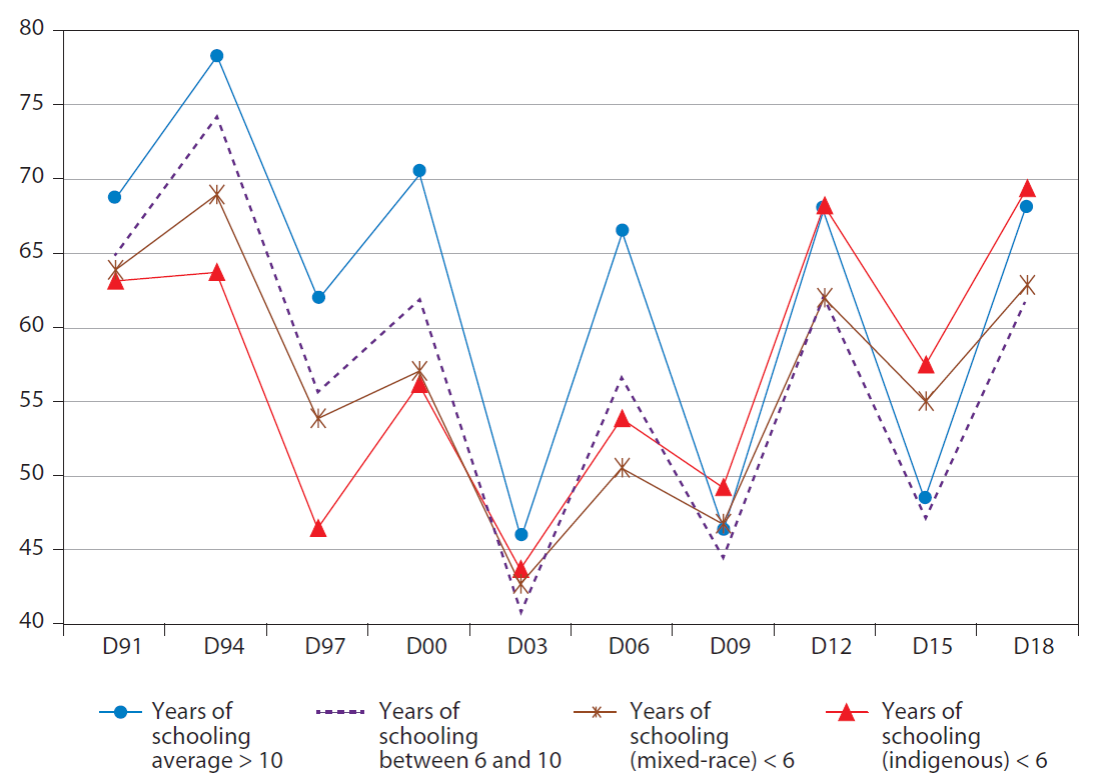
To complete this analysis, I look at the evolution of party preferences in these same four categories. Since 1991 and throughout the entire period, the mainly indigenous sections (marked with triangles) have been characterized by a much stronger presence of the PRI (Figure 7 a) and a much weaker presence of the PAN (Figure 7 b). The differences are particularly noticeable during the period 1997-2006 and reach impressive levels for the legislative elections of the year 2000, in which the PRI obtained up to 29 percentage points more (and the PAN up to 35 percentage points less) in these predominantly indigenous sections compared to the mestizo sections with more than ten years of schooling.
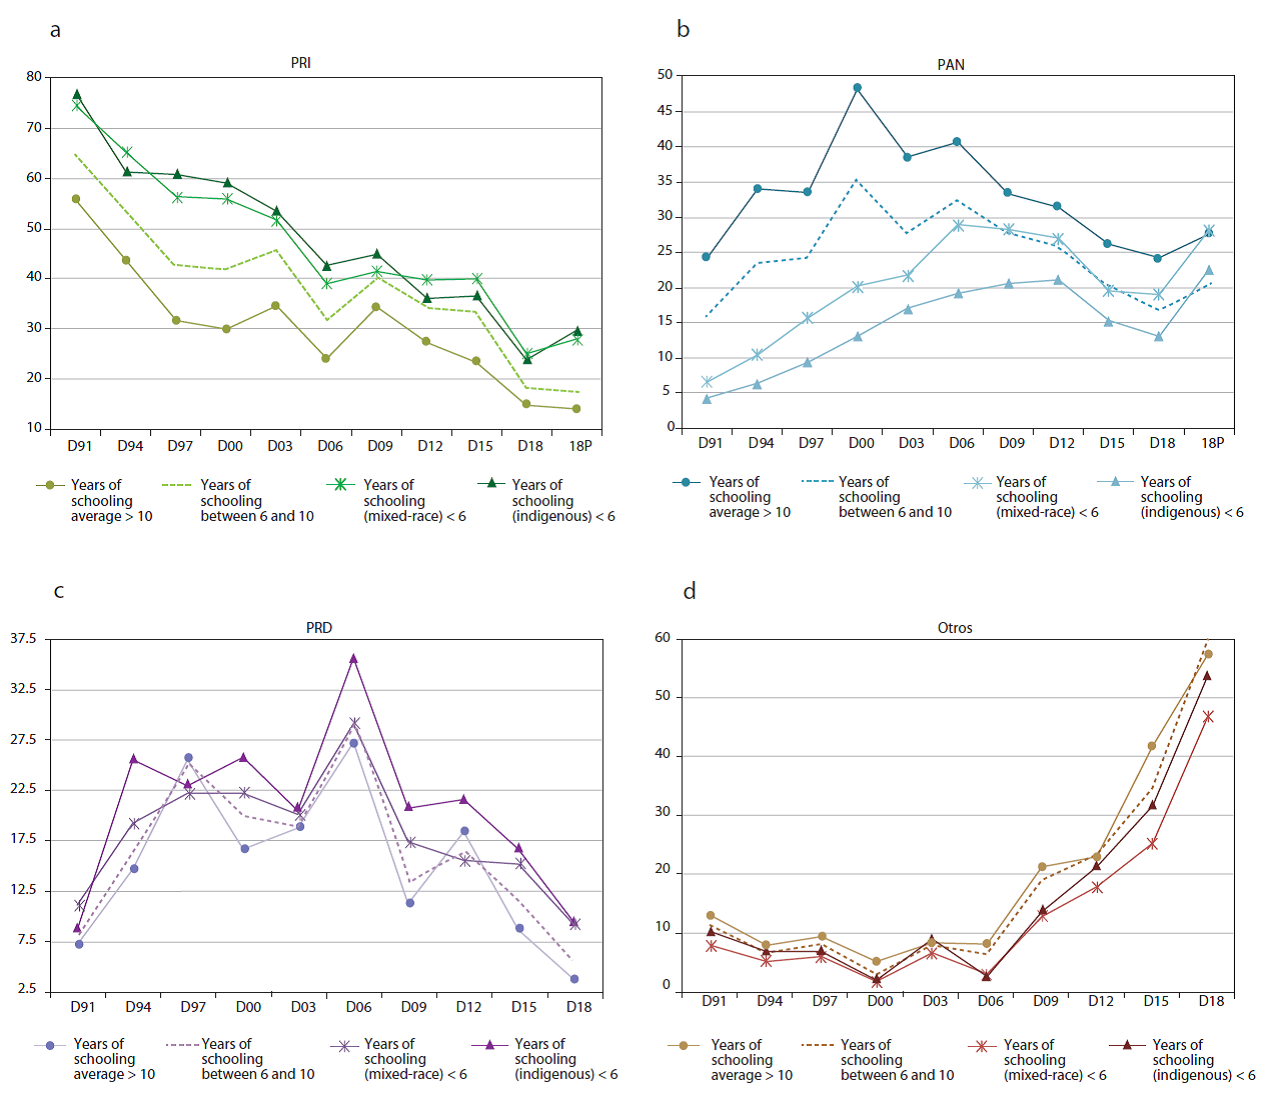
The differences will later remain but considerably reduced. In the case of the PRI, this is due to its across-the-board weakening which is observed in all categories but is more noticeable in the sections with lower levels of schooling. In the case of PAN, on the other hand, the convergence is due to its profound drop in the sections with more education and its relative growth in the sections with less education, as a consequence of the diversification of its electorate. A low degree of vote differentiation is observed as well in the case of the PRD, which, with the exception of 1997 (the election of Cárdenas in the Federal District), is more successful in the indigenous sections (Figure 7 c).
Likewise, the similarity of the trends observed in the mestizo and indigenous sections with low levels of schooling (indicated by asterisks and triangles) is worth noting. This provides a first approximation to the effects of schooling on electoral behavior. These effects are particularly apparent in the case of PRI, which has very similar roots in all the sections with less than six years of schooling, regardless of whether they are mestizo or indigenous. Rather than corresponding to an ethnic or cultural behavior, this difference seems to be related to other factors of economic and socio-demographic nature. Finally, the little vote differentiation of the other parties is striking, whose presence is usually slightly higher in the sections with the highest level of education (with the exception of 2003), but whose growth since 2009 is overwhelming and impressive in the four analytical categories.
This first exploratory exercise indicates that the ethno-linguistic variable does seem to have effects on electoral behavior, although it also calls for further analysis, integrating and controlling for other socio-demographic variables.
Ethnicity or exclusion? The weight of socio-demographic and regional variables
To capture the specific weight of ethnicity without confounding it with the effects of other socio-demographic and territorial factors that may also influence electoral behavior, I ran a series of multi-variable regression models, with the data from the latest 2010 Census added at the level of the 66 682 electoral sections (INEGI-IFE, 2012).
The independent variable of interest is the sectional percentage of speakers of indigenous languages (“pHLI”). Likewise, we used seven binary variables (“Indigenous_”, coded with 1/0) to identify the predominantly indigenous sections of each of the seven regions that we previously distinguished, in order to explore the specificity of indigenous electoral patterns among the Yucatecan Mayans, in the Potosina and Puebla Huasteca, in Chiapas, Oaxaca and Guerrero, as well as in the Huicot-Tarahumara region.
Regarding the socio-demographic control variables, I consider, together with the average years of schooling (“MediaEsc”), the sectional percentages of young people between 15 and 24 years of age (“Joven15a24”), the population residing in another entity in the last five years (“Immigrants”), those who worship the Catholic religion (“Catholic”), those who have access to the ISSSTE (Instituto de Seguridad y Servicios Sociales de los Trabajadores del Estado) or the IMSS (Instituto Mexicano del Seguro Social), as well as the proportion of marginalized homes that have neither electricity, piped water nor drained water (“Sin_ServBas”).
To facilitate the interpretation and the direct comparison of all coefficients with the seven regional dichotomous variables, I standardized each continuous independent variable by subtracting its average and dividing it by two standard deviations (“rs”). This procedure, suggested by Andrew Gelman and Jennifer Hill (2007: 56), not only enables centering these variables (which allows the intersection to correspond with the predicted average result when the set of variables are located at their respective mean); by dividing each variable by two standard deviations (instead of one), an increase of an integer unit in that variable then corresponds to a change from one standard deviation below to one standard deviation above its respective average (which is approximately equivalent to the change of a binary variable between the values 0 and 1).5
Before standardization, I applied some simple transformations to the variables with biased distributions, so that they could have reasonably normal distributions (this is why we used the square roots “Sq_” of the rates of immigrants, Catholics and beneficiaries of the ISSSTE, as well as the natural logarithm “Ln_” of homes with deficiencies in basic services). Since all the variables are similarly standardized, the differences between the various coefficient scales (which can be directly contrasted with the binary variables) are eliminated.
In this way, the constant represents the predicted average of the independent variable of each model (percentage of electoral participation, vote for PRI, PAN, PRD or other parties), and the coefficients of the standardized regressors (in this case, the control variables) can be interpreted on a scale equivalent to that of the coefficients of the binary variables of interest (in our case, the predominantly indigenous sections in the seven analyzed indigenous regions). As can be seen in Table 7, there are relevant correlations between the different variabls. However, these are not strong enough to pose collinearity problems (the statistics of the reported models never go over 3.8 for FIV values, with a tolerance of less than 0.262 for the schooling average).
TABLE 7 Correlations between independent socio-demographic variables
| rsILS | rsSchooling | rsSq_Immigrants | rsYouth15-24 | rsCatholics | rsSqISTE | rsIMSS | rsLn_ NoBasicServices | |
| rsILS | 1 | -341** | .008* | .111** | -.082** | -.220** | -.260** | .417** |
| rsSchooling | -.341** | 1 | .035** | .233** | - .201** | .700** | .631** | -.709** |
| rsSq_Immigrants | .008* | .035** | 1 | -.016** | - .219** | -.118** | -.015** | .166** |
| rsYouth15-24 | .111** | .233** | -.016** | 1 | -. 065** | .222** | .024** | -.063** |
| rsCatholics | -.082** | -.201** | -.219** | -.065** | 1 | -.095** | -.170** | .037** |
| rsSqISTE | -.220** | .700** | -.118** | .222** | -. 095** | 1 | .317** | -.528** |
| rsIMSS | -.260** | .631** | -.015** | .024** | - .170** | .317** | 1 | -.689** |
| rsLn_NoBasic Services | .417** | -.709** | .166** | -.063** | .037** | -.528** | -.689** | 1 |
Source: Own elaboration based on INEGI-IFE (2012). *Correlation is significant at the 0.05 level (2-tailed).
** Correlation is significant at the 0.01 level (2-tailed) N=6682.
Let us now turn to data analysis. Considering that the dependent variables vary in a range between 0-100 and that, in practical terms, their distribution is normal, we use linear regression models. These allow the constants to be interpreted as the predicted averages of the dependent variables when all the continuous independent variables are at their mean level and the binary variable has the value of 0. In turn, the standardized coefficients correspond to the total effect that either an increase of two standard variations of a continuous variable or an increase of a unit of a dichotomous categorical variable, in percentage points of the dependent variable, would have.
As observed in the three models in Table 8, the general average of electoral participation between 1991 and 2018 was 58 per cent in the mestizo sections (as indicated by the constant at the intersection), while PRI obtained 40 per cent of the valid vote during the same period, against 26 per cent for PAN and 16 per cent for PRD. As the first model shows, the predominantly indigenous sections are not characterized by a statistically significant difference in terms of electoral participation, but in these sections PRI does seem to achieve +4.7 percentage points more, in contrast to PAN which captures an average of -5.8 points less than in the mestizo sections (model 1 of Table 8). However, these coefficients change substantially when controlling by other socio-demographic variables, with the indigenous sections acquiring a positive value of +2.1 percentage points for electoral participation and decreasing to less than one percentage point for the distribution of partisan votes. In fact, these other socio-demographic factors are much more relevant to explain the sectional variations in the electoral behavior of Mexicans (model 2 of Table 8).
TABLE 8 Regression models to explain the averages of the 1991-2018 period
| Dependent variables (% averages 1991-2018) | ||||||
|---|---|---|---|---|---|---|
| Models | Turnout | PRI | PAN | PRD | Others | |
| 1 | (Constant) | 58.5 | 40.3 | 25.8 | 16.5 | 17.4 |
| (0.000) | (0.000) | (0.000) | (0.000) | (0.000) | ||
| rsILS | .1 NS | 4.7 | -5.8 | 1.9 | -.8 | |
| (0.364) | (0.000) | (0.000) | (0.000) | (0.000) | ||
| Adjusted R2 | -0.000 | .038 | .051 | .007 | .005 | |
| 2 | (Constant) | 58.3 | 40.4 | 26.1 | 16.2 | 17.3 |
| (0.000) | (0.000) | (0.000) | (0.000) | (0.000) | ||
| rsILS | 2.1 | -.2 NS | .4 | -.3 | 0.1 NS | |
| (0.000) | (0.039) | (0.000) | (0.008) | (0.053) | ||
| rsSchooling | 10.0 | -12.1 | 12.2 | -2.3 | 2.1 | |
| (0.000) | (0.000) | (0.000) | (0.000) | (0.000) | ||
| rsSq_Immigrants | -3.7 | -.6 | 1.8 | -1.0 | -.3 | |
| (0.000) | (0.000) | (0.000) | (0.000) | (0.000) | ||
| rsYouth15-24 | -1.4 | .2 NS | -1.6 | .7 | .7 | |
| (0.000) | (0.027) | (0.000) | (0.000) | (0.000) | ||
| rsCatholics | 3.1 | -.9 | 4.5 | -2.0 | -1.6 | |
| (0.000) | (0.000) | (0.000) | (0.000) | (0.000) | ||
| rsSqISTE | -1.9 | -.9 | -8.8 | 7.5 | 2.3 | |
| (0.000) | (0.000) | (0.000) | (0.000) | (0.000) | ||
| rsIMSS | -1.6 | 1.1 | 4.4 | -5.6 | .1 NS | |
| (0.000) | (0.000) | (0.000) | (0.000) | (0.048) | ||
| rsLn_NoBasicServices | 2.3 | 2.0 | -5.9 | 3.5 | .4 | |
| (0.000) | (0.000) | (0.000) | (0.000) | (0.000) | ||
| Adjusted R2 | .203 | .302 | .362 | .141 | .155 | |
| 3 | (Constant) | 58.4 | 40.5 | 26.2 | 16.1 | 17.2 |
| (0.000) | (0.000) | (0.000) | (0.000) | (0.000) | ||
| rsILS | 2.7 | .6 | 1.4 | -1.5 | -.5 | |
| (0.000) | (0.000) | (0.000) | (0.000) | (0.000) | ||
| rsSchooling | 9.9 | -12.2 | 12.0 | -2.1 | 2.3 | |
| (0.000) | (0.000) | (0.000) | (0.000) | (0.000) | ||
| rsSq_Immigrants | -3.6 | -.4 | 2.1 | -1.2 | -.4 | |
| (0.000) | (0.000) | (0.000) | (0.000) | (0.000) | ||
| rsYouth15-24 | -1.3 | 0.3 NS | -1.5 | .6 | .6 | |
| (0.000) | (0.004) | (0.000) | (0.000) | (0.000) | ||
| rsCatholics | 3.3 | -.8 | 4.6 | -2.3 | -1.5 | |
| (0.000) | (0.000) | (0.000) | (0.000) | (0.000) | ||
| rsSqISTE | -1.8 | -.9 | -8.7 | 7.4 | 2.3 | |
| (0.000) | (0.000) | (0.000) | (0.000) | (0.000) | ||
| rsIMSS | -1.5 | 1.1 | 4.4 | -5.6 | 0.2 NS | |
| (0.000) | (0.000) | (0.000) | (0.000) | (0.027) | ||
| rsLn_NoBasicServices | 2.3 | 1.8 | -6.1 | 3.7 | .6 | |
| (0.000) | (0.000) | (0.000) | (0.000) | (0.000) | ||
| Indigenous_Yucatan | 11.3 | 7.5 | 12.6 | -11.1 | -9.0 | |
| (0.000) | (0.000) | (0.000) | (0.000) | (0.000) | ||
| Indigenous_Puebla | -2.8 | 1.8 NS | 0.4 NS | -3.0 | 0.8 NS | |
| (0.000) | (0.010) | (0.588) | (0.000) | (0.029) | ||
| Indigenous_SanLuis | 4.6 | -2.3 NS | 8.3 | -3.5 | -2.5 | |
| (0.000) | (0.002) | (0.000) | (0.000) | (0.000) | ||
| Indigenous_Chiapas | -.2 NS | -4.6 | -7.9 | 4.8 | 7.7 | |
| (0.657) | (0.000) | (0.000) | (0.000) | (0.000) | ||
| Indigenous_Oaxaca | -7.1 | -3.8 | -7.5 | 7.5 | 3.8 | |
| (0.000) | (0.000) | (0.000) | (0.000) | (0.000) | ||
| Indigenous_Guerrero | -6.4 | -11.0 | -12.5 | 19.5 | 3.9 | |
| (0.000) | (0.000) | (0.000) | (0.000) | (0.000) | ||
| Indigenous_Huicot | -7.1 | 14.5 | -.9 NS | -8.9 | -4.7 | |
| (0.000) | (0.000) | (0.560) | (0.000) | (0.000) | ||
| Adjusted R2 | .226 | .310 | .377 | .163 | .180 | |
| N = 57 930 | ||||||
Source: Own elaboration based on INEGI-IFE (2012), IFE (2012) and INE (2018). Except indcated otherwise with NS. All values p < 0.001. Note: all coefficients significant at 0.01 level, unless otherwise stated; p-values in parentheses.
Electoral participation, for example, is positively associated with higher sectional levels of schooling (+10 points), Catholic population (+3.1 points) and homes without basic services (+2.3 points), while it decreases in the sections with the highest presence of immigrants, young people and beneficiaries of ISSSTE and IMSS. As shown by the corrected r² of models 1 and 2, together these variables explain 20 per cent of the total variance, while the ethno-linguistic variable by itself bears little explanatory power. Likewise, the coefficients of the percentage of indigenous language speakers lose their relevance to explain partisan voting. In the case of PRI, the most relevant variable is clearly the schooling average (-12.1 points), which has an exactly inverse effect on the PAN vote (+12.2 points). The latter party also benefits from the greater presence of Catholics (+4.5 points) and IMSS beneficiaries (+4.4 points), in contrast to the PRD that is more successful in the sections with more ISSSTE beneficiaries (+7.5 points) and with deficiencies in basic services (+3.5 points).
The poor explanatory capacity of the ethno-linguistic variable is largely due to its internal heterogeneity. When the dummy variables of the seven indigenous regions that we previously distinguished are introduced, relevant and statistically significant variations appear. As model 3 of Table 8 illustrates, the Mayan sections of the Yucatan Peninsula are characterized by impressive rates of electoral participation (+11.3 percentage points more than the national average) and by a much stronger presence of PAN (+12.6 points ) and PRI (+7.5 points) compared to PRD (-11.1 percentage points) and the rest of political parties (-9.0 points). Also, the overrepresentation of Partido Acción Nacional in the indigenous sections of the Huasteca Potosina (+8.3) contrasts with the overrepresentation of the PRI in the Huicot-Tarahumara sections (+14.5 points) and of the PRD in Montaña de Guerrero (+19.5 percentage points). This illustrates the great diversity of partisan configurations that coexist within the indigenous universe, where many political worlds fit (Table 8).
I also built other models to check whether the global averages are masking substantive changes over time. Although the coefficients vary slightly in intensity, the core results are robust and consistent with the trends seen in figures 7-10. Let us look, for example, at the coefficients of the same dependent variables for the 1997-2006 period. Unlike model 1, which only captures the bilateral effects of the ethno-linguistic variable (and barely captures between 0.4 and 6.2 per cent of the total variance), the other socio-demographic factors explain between 13.8 per cent and 40.1 per cent of the total variance —making the linguistic variable less relevant. Only turnout is slightly higher in sections with greater percentages of indigenous language speakers.
Indeed, the most important variable is clearly the sectional average of years of schooling, with strong positive effects on electoral participation (+12.2 points) and the PAN vote (+14.9 points), as well as negative effects on the PRI vote (-14.6 points). In turn, a higher proportion of Catholics is associated with higher levels of electoral participation (+3.8 points) and PAN voting (+5.2 points), as well as lower rates of votes for PRI (-2.6 points) and PRD (-2.8 points). Likewise, the sectional rates of access to health services help explain the greater success of PRD in the sections with the most beneficiaries of the ISSSTE (+10.6 points), and PAN in the sections with the most beneficiaries of the IMSS (+5.5 percentage points). Finally, the households with more shortages in basic services are positively associated with the PRI vote and the PRD vote and have a negative effect on the PAN vote (-8 percentage points).
But above all, the usefulness of the regional ethno-linguistic variables is confirmed, not so much to increase the explanatory power of the models (in which the corrected r² does not increase substantially) but in order to capture the heterogeneity of their effects (model 3 of Table 9). Once again, the predominantly Mayan sections of the Yucatan Peninsula are characterized by very high rates of electoral participation (+10.6 points), by a very strong presence of PAN (+11.9 points) and PRI (+6.7 points) and by the weakness of PRD (which captures -14.7 points less). Also, the overrepresentation of PAN is confirmed in the indigenous sections of the Huasteca Potosina (+11.7 points), in contrast to the hegemony of PRI in the Huicot-Tarahumara sections (+12.7 points) and PRD in Montaña de Guerrero (+23.4 points). Hence the need to place the different ethno-linguistic communities in their specific territorial contexts.
TABLE 9 Regression models to explain the averages of the 1991-2018 period
| Dependent variables (% average 1997-2006) | ||||||
|---|---|---|---|---|---|---|
| Models | Turnout | PRI | PAN | PRD | Others | |
| 1 | (Constant) | 55.1 | 40.6 | 30.3 | 23.0 | 6.1 |
| rsILS | -1.5 | 6.5 | -7.8 | 1.9 | -.6 | |
| Adjusted R2 | .006 | .048 | .062 | .004 | .006 | |
| 2 | (Constant) | 55.0 | 40.4 | 30.8 | 22.6 | 6.2 |
| rsILS | 1.9 | 0.2 NS (0.099) | .0 NS (0.951) | -0.4 NS (0.002) | 0.2 | |
| rsSchooling | 12.2 | -14.6 | 14.9 | -2.2 | 1.9 | |
| rsSq_Immigrants | -3.7 | -1.2 | 2.3 | -1.2 | 0.1 | |
| rsYouth15-24 | -2.0 | 0.9 | -1.5 | 0.7 | -.1 | |
| rsCatholics | 3.8 | -2.6 | 5.2 | -2.8 | 0.3 | |
| rsSqISTE | -1.9 | -1.4 | -10.4 | 10.6 | 1.2 | |
| rsIMSS | -0.5 | 0.9 | 5.5 | -6.9 | 0.5 | |
| rsCatholics | 1.5 | 2.8 | -8.0 | 4.6 | 0.6 | |
| Adjusted R2 | .252 | .314 | .390 | .133 | .130 | |
| 3 | (Constant) | 55.1 | 40.4 | 30.9 | 22.5 | 6.2 |
| rsILS | 2.9 | .4 NS (0.034) | 1.3 | -1.9 | 0.2 | |
| rsSchooling | 12.0 | -14.6 | 14.6 | -2.0 | 2.0 | |
| rsSq_Immigrants | -3.5 | -1.1 | 2.6 | -1.5 | 0.1 NS (0.002) | |
| rsYouth15-24 | -1.9 | 0.9 | -1.4 | 0.6 | -0.1 | |
| rsCatholics | 3.9 | -2.5 | 5.4 | -3.2 | 0.3 | |
| rsSqISTE | -1.8 | -1.4 | -10.4 | 10.5 | 1.2 | |
| rsIMSS | -0.4 | 0.9 | 5.5 | -6.9 | 0.5 | |
| rsLn_NoBasicServices | 1.4 | 2.8 | -8.2 | 4.8 | .07 | |
| Indigenous_Yucatan | 10.6 | 6.7 | 11.9 | -14.7 | -4.0 | |
| Indigenous_Puebla | -2.9 | 5.0 | -2.0 NS (0.019) | -2.9 NS (0.003) | -.1 NS (0.577) | |
| Indigenous_SanLuis | 5.1 | -4.4 | 11.7 | -5.6 | -1.7 | |
| Indigenous_Chiapas | -7.0 | 1.0 NS (0.190) | -7.9 | 5.6 | 1.3 | |
| Indigenous_Oaxaca | -5.3 | -1.4 NS (0.017) | -7.9 | 8.1 | 1.2 | |
| Indigenous_Guerrero | -8.7 | -9.2 | -14.0 | 23.4 | -.1 NS (0.594) | |
| Indigenous_Huicot | -5.2 | 12.7 | 0.3 NS (0.869) | -10.8 | -2.1 | |
| Adjusted R2 | .268 | .318 | .401 | .152 | .138 | |
| N = 61 492 | ||||||
Source: Own elaboration based on INEGI-IFE (2012), IFE (2012) and INE (2018). Except indcated otherwise with NS. All values p < 0.001. Note: all coefficients significant at 0.01 level, unless otherwise stated; p-values in parentheses.
I close this section with a brief discussion of the most recent federal elections, in order to locate the socio-demographic profile of the winning party, the Movimiento Regeneración Nacional, before and after the electoral tsunami unleashed by AMLO’s third presidential candidacy. While in 2015 Morena was more successful in sections with higher levels of schooling (where it practically doubled its electoral results), its exponential growth canceled the effects of this variable in the 2018 legislative elections, and actually turned the coefficient into the opposite direction for the presidential elections (in which AMLO obtained -8.7 percentage points less in high-schooling sections than in those with low schooling).
Indeed, it is noteworthy that the effects of the same variable remained relatively constant in the case of PAN (which obtained +11.6 points more in the better educated sections), but they weakened considerably in the case of PRI (which only lost -5.1 points in them). Likewise, both Morena and AMLO managed to grow in the sections with higher proportions of young people and of beneficiaries of the ISSSTE and the IMSS, whose preferences used to benefit PRD and PAN, respectively. The only type of sections in which Morena’s penetration was more limited corresponds to the proportion of Catholics (-9.8 points), which was more favorable to the PAN vote (+4.5 percentage points) and, to a lesser extent, to PRI (+2.7 points). Therefore, the 2018 electoral tsunami really blurred the main socio-demographic cleavages that had been structuring Mexican electoral policy since the 1990s.
Regarding the patterns in the different indigenous regions, AMLO only obtained a substantive advantage in the predominantly indigenous sections of Oaxaca (+15.1 points) and Guerrero (+8 points), while registering much lower results in the Huasteca Potosina (-9.1 points) and Poblana (-4.6 points), in the Selva Lacandona and Los Altos de Chiapas (-9 points) but, above all, in the Huicot-Tarahumara (-20.7 points) and Mayan sections of Yucatan (-21.5 points). In effect, the latter remained loyal to PRI and PAN, in the same way that the indigenous sections of Guerrero continued to vote in a greater proportion for PRD (+11.7 percentage points). In any case, it is striking that the vote as a whole in these regions did not favor López Obrador to a greater extent, who obtained a negative electoral balance in the indigenous sections. Finally, indigenous turnout further confirmed the great internal heterogeneity of the linguistic factor, with impressive differences between the Yucatecan Mayans (+14.7 points) and the Tarahumaras-Huicot (-11.1 points).
TABLE 10 Seven regression models to capture the 2018 electoral tsunami
| Dependent variables (%, legislative and presidential elections of) | ||||||||
|---|---|---|---|---|---|---|---|---|
| Model | Morena 15-L | Morena 18-L | AMLO 18-P | PRI 18-L | PAN 18-L | PRD 18-L | Turnout 18-L | |
| 1 | (Constant) | 8.9 | 35.9 | 52.6 | 18.8 | 18.8 | 5.6 | 63.9 |
| (0.000) | (0.000) | (0.000) | (0.000) | (0.000) | (0.000) | (0.000) | ||
| rsILS | -.8 | -1.4 | -.7 | 2.3 | -3.3 | 1.5 | 3.4 | |
| (0.000) | (0.000) | (0.000) | (0.000) | (0.000) | (0.000) | (0.000) | ||
| Adjusted R2 | .002 | .002 | .000 | .010 | .013 | .008 | .027 | |
| 2 | (Constant) | 8.8 | 35.8 | 52.5 | 18.9 | 18.8 | 5.7 | 63.8 |
| (0.000) | (0.000) | (0.000) | (0.000) | (0.000) | (0.000) | (0.000) | ||
| rsILS | 1.0 | -1.0 | -2.0 | .1 | .2 | -.2 | 4.0 | |
| (0.000) | (0.000) | (0.000) | (0.238) | (0.084) | (0.001) | (0.000) | ||
| rsSchooling | 7.0 | -.4 NS | -8.7 | -5.1 | 11.6 | -2.9 | 12.5 | |
| (0.000) | (0.049) | (0.000) | (0.000) | (0.000) | (0.000) | (0.000) | ||
| rsSq_Immigrants | -1.3 | .3 NS | 1.0 | -1.1 | .0 NS | -.6 | -5.7 | |
| (0.000) | (0.006) | (0.000) | (0.000) | (0.931) | (0.000) | (0.000) | ||
| rsYouth15-24 | -1.1 | 2.9 | 4.6 | -1.3 | -3.0 | .3 | -.5 | |
| (0.000) | (0.000) | (0.000) | (0.000) | (0.000) | (0.000) | (0.000) | ||
| rsCatholics | -3.0 | -9.2 | -9.8 | 2.7 | 4.5 | .5 | 1.0 | |
| (0.000) | (0.000) | (0.000) | (0.000) | (0.000) | (0.000) | (0.000) | ||
| rsSqISTE | 3.5 | 8.2 | 12.6 | -.2 NS | -6.9 | 2.5 | .9 | |
| (0.000) | (0.000) | (0.000) | (0.051) | (0.000) | (0.000) | (0.000) | ||
| rsIMSS | -1.8 | .8 | 2.0 | .0 NS | .0 NS | -2.3 | -4.6 | |
| (0.000) | (0.000) | (0.000) | (0.996) | (0.955) | (0.000) | (0.000) | ||
| rsLn_ NoBasicServices | 1.8 | 1.0 | .8 | 1.7 | -.8 | 1.8 | 6.9 | |
| (0.000) | (0.000) | (0.000) | (0.000) | (0.000) | (0.000) | (0.000) | ||
| Adjusted R2 | .218 | .180 | .163 | .121 | .105 | .089 | .243 | |
| 3 | (Constant) | 8.7 | 35.9 | 52.5 | 18.8 | 19.0 | 5.6 | 63.8 |
| (0.000) | (0.000) | (0.000) | (0.000) | (0.000) | (0.000) | (0.000) | ||
| rsILS | .5 | -.4 NS | -2.0 | .1 NS | 2.0 | -1.2 | 3.9 | |
| (0.000) | (0.038) | (0.000) | (0.705) | (0.000) | (0.000) | (0.000) | ||
| rsSchooling | 7.0 | -.3 NS | -8.7 | -5.2 | 11.3 | -2.9 | 12.5 | |
| (0.000) | (0.175) | (0.000) | (0.000) | (0.000) | (0.000) | (0.000) | ||
| rsSq_Immigrants | -1.3 | .3 | .9 | -1.0 | .2 | -.7 | -5.6 | |
| (0.000) | (0.035) | (0.000) | (0.000) | (0.069) | (0.000) | (0.000) | ||
| rsYouth15-24 | -1.1 | 3.0 | 4.6 | -1.2 | -2.9 | .3 | -.5 | |
| (0.000) | (0.000) | (0.000) | (0.000) | (0.000) | (0.000) | (0.000) | ||
| rsCatholics | -3.2 | -9.5 | -10.3 | 2.9 | 4.5 | .3 | 1.2 | |
| (0.000) | (0.000) | (0.000) | (0.000) | (0.000) | (0.000) | (0.000) | ||
| rsSqISTE | 3.5 | 8.0 | 12.4 | -.2 NS | -6.9 | 2.5 | 1.1 | |
| (0.000) | (0.000) | (0.000) | (0.121) | (0.000) | (0.000) | (0.000) | ||
| rsIMSS | -1.8 | .7 | 1.9 | .0 NS | .0 NS | -2.2 | -4.5 | |
| (0.000) | (0.000) | (0.000) | (0.884) | (0.963) | (0.000) | (0.000) | ||
| rsLn_ NoBasicServices | 1.8 | 1.0 | .8 | 1.7 | -1.1 | 1.8 | 7.0 | |
| (0.000) | (0.000) | (0.000) | (0.000) | (0.000) | (0.000) | (0.000) | ||
| Indigenous_ Yucatan | -6.2 | -19.3 | -21.5 | 16.1 | 9.6 | -.5 NS | 14.7 | |
| (0.000) | (0.000) | (0.000) | (0.000) | (0.363) | (0.000) | |||
| Indigenous_ Puebla | .3 NS | -5.2 | -4.6 | 4.0 | 4.1 | -.3 NS | 7.0 | |
| (0.000) | (0.000) | (0.000) | (0.000) | (0.586) | (0.000) | |||
| Indigenous_ SanLuis | -3.8 | -17.3 | -9.1 | 4.8 | 4.2 | 2.9 | -2.2 NS | |
| (0.000) | (0.000) | (0.000) | (0.000) | (0.000) | (0.001) | |||
| Indigenous_ Chiapas | -3.4 | -7.3 | -9.0 | -1.2 NS | -9.8 | -.1 NS | 5.0 | |
| (0.000) | (0.000) | (0.047) | (0.000) | (0.832) | (0.000) | |||
| Indigenous_ Oaxaca | 11.2 | 12.5 | 15.1 | -5.0 | -11.6 | 3.5 | -7.6 | |
| (0.000) | (0.000) | (0.000) | (0.000) | (0.000) | (0.000) | |||
| Indigenous_ Guerrero | -.1 NS | 1.6 NS | 8.0 | -6.7 | -13.1 | 11.7 | -.9 NS | |
| (0.073) | (0.000) | (0.000) | (0.000) | (0.000) | (0.099) | |||
| Indigenous_ Huicot | -2.7 NS | -16.3 | -20.7 | 17.4 | -.4 NS | -5.0 | -11.1 | |
| (0.000) | (0.000) | (0.000) | (0.826) | (0.000) | (0.000) | |||
| Adjusted R2 | .237 | .198 | .182 | .136 | .118 | .098 | .261 | |
| N = 65 201 | ||||||||
Source: Own elaboration based on INEGI-IFE (2012), IFE (2012) and INE (2018). Except indcated otherwise with NS. All values p < 0.001. Note: all coefficients significant at 0.01 level, unless otherwise stated; p-values in parentheses.
In short, the explanatory capacity of the socio-demographic factors we use here as control variables is much more relevant and robust to capture the electoral patterns of Mexicans than the percentage of indigenous language speakers. Contrary to a recurring but erroneous myth, turnout rates are significantly higher on average in indigenous sections. However, there is no common pattern of electoral behavior among them. Rather, highly participatory indigenous regions (the Mayans of Yucatan) and highly abstentionists (the Tarahumaras-Huicot or the indigenous people of Guerrero) co-exist, which challenges the idea of a homogeneous or unified indigenous electoral body.
This is even truer when the partisan orientation of the vote is analyzed. As the multivariate regression models show, speaking an indigenous language does not have much explanatory power. On the other hand, strongly differentiated behaviors are observed among the different ethnic-linguistic regions (with markedly PAN orientations among the Yucatecan Mayas; PRD among the Mixtecos, Nahuas, Tlapanecos and Guerrero Amuzgos; or PRI orientations among the northern Tarahumara-Huicot). This illustrates the great diversity of electoral patterns within the different indigenous territories. This heterogeneity refers to geographical and historical specificities that must be recognized, located and explored. Therefore, it is of little use to speak of “an indigenous vote”, and far more appropriate to think of different regions with differentiated electoral patterns.
A plural universe of indigenous worlds: four challenges to improve political inclusion
The pluralism of the indigenous world is worth highlighting. In 2018, electoral participation was higher in almost all of its regions, where party systems are just as fragmented as in the rest of the country. Rather than one vote, it is more convenient to speak of various indigenous votes. As a whole, the predominantly indigenous sections are not characterized by any specific political behavior. And, when the electoral effects of the percentage of indigenous language speakers in the section are compared with the electoral effects of other socio-demographic factors, the latter are usually much more relevant (particularly, the level of education in the section). Certainly, the average level of electoral participation does end up being slightly higher in indigenous sections than in mestizo sections. However, this is not the case for the sectional distribution of the PRI vote, the PAN vote, or the PRD vote, the variation of which is mostly explained by educational levels, access to health services, or lack of basic services, as well as by the sectional proportion of young people, immigrants or Catholics.
This is related to the internal heterogeneity of the ethno-linguistic category. This contains an array of populations with strongly differentiated and sometimes diametrically opposed behaviors, which must be studied in their specific socio-territorial contexts. For the 1991-2018 period, the electoral participation averages varied up to 18 percentage points between the highly participatory Mayan sections of the Yucatan peninsula and the abstentionist sections of Montaña of Guerrero, while the differences between the over-/under-representation of the main parties reach up to 24.6 percentage points for PAN, 25.3 points for PRI and 30 points in the case of PRD, with coefficients twice as high as the level of education in the section (the socio-demographic variable of greatest weight).
These findings have important implications for the political inclusion of indigenous populations. Contrary to the dualistic image that homogenizes them and conceals their internal diversity, the careful study of electoral results reveals a wide rainbow of political preferences that coexist within indigenous territories. This means that indigenous identities must be placed in different geographic, demographic, economic and sociocultural contexts. We have before us a highly diverse group of populations that may inhabit as indisputable majorities in exclusively indigenous communities, or migrate and live in multicultural, mixed or mestizo environments where they become more or less (in)visible minorities.
The design of public policies that promote greater political inclusion of indigenous populations must start from the recognition of their internal diversity. A first challenge concerns the relevant level in which political representation is organized: is it necessary to have specific legal instruments for the 28,000 localities, for the 565 municipalities, for the 23 regions or for the ten entities where most of the indigenous communities live?
As aforementioned, the demographic heterogeneity and the territorial distribution of the ethno-linguistic groups in Mexico invite us to rethink indigenous political representation in multicultural territorial contexts. Despite its geographic concentration, only 57 per cent of indigenous language speakers reside in sections with more than 65 per cent of indigenous language speakers, while 35 per cent of them live in sections with less than 50 per cent, and 25 per cent in sections with less than 30 per cent of indigenous language speakers. Thus, a substantial part of these populations lives in culturally mixed contexts or in eminently mestizo contexts. At what level and through what tools, then, should we design public policy? And what type of political representation for what type of indigenous sectors should be considered?
For the time being, Mexican reforms have resorted to, above all, majority mechanisms of affirmative gerrymandering. The redistricting of 2004-2005 and 2016-2017 designed 28 districts with a deliberate ethno-linguistic bias, while the affirmative action measures launched in 2017 sought to force the nomination of indigenous candidates in at least thirteen of those districts. A first step would be to recognize that the issue cannot be solved solely by these means and that complementary strategies must be used, with a logic of proportional quotas or reserved candidacies.
For example, a sixth plurinominal federal constituency could be created, reserved for indigenous candidates, as was done in Colombia to promote the legislative representation of indigenous and Afro-mestizo populations. Another alternative is to create incentives for the parties themselves to include indigenous candidates in their proportional representation lists, eventually including quota systems in entities or regions with strong indigenous presence. Likewise, the successful experience of “affirmative malapportionment” in Panama is worth mentioning, where the creation of constituencies with two or three seats in the indigenous regions allows them to be over-represented in relation to the mestizo single-member districts (Sonnleitner, 2010). In any case, the fact that Mexico has a mixed representation system could be positively exploited. Electoral engineering opens up many possibilities to combine majority mechanisms (for communities residing in indigenous territories) and proportional mechanisms (for those residing in mixed or mestizo contexts).
Thirdly, the challenge of socio-economic marginalization is worth stressing. Social exclusion does not only afflict indigenous populations but affect broad sectors of the mestizo population as well. However, most indigenous communities live in contexts of high marginalization or extreme poverty, which hinders their political inclusion. Their representation cannot ignore the conditions of material inequality in which those who aspire to public office compete.
Finally, one last challenge must not be dismissed, that is, the counterproductive effects that positive discrimination can cause: formally recognizing indigenous identities as subjects of exclusive public policy entails the risk of creating unexpected dynamics of exclusion and resentment among non-indigenous sectors. This could feed or reproduce old and new practices of paternalism and racism under the guise of benevolent discourses that could break the existing consensus on the legitimacy of indigenous political inclusion.
REFERENCES
Aguirre Beltrán, Gonzalo (1967), Regiones de Refugio: El desarrollo de la comunidad y el proceso dominical en Mestizo América, México: Instituto Nacional Indigenista. [ Links ]
Barth, Fredrik (1969), Ethnic Groups and Boundaries: The Social Organization of Culture Difference, Bergen, Oslo y Londres: Universitetsforlaget/George Allen and Unwin, [ Links ]
CDI (Comisión Nacional para el Desarrollo de los Pueblos Indígenas) (2006), Indicadores sociodemográficos de la población indígena, 2000-2005, México: CDI. [ Links ]
CDI (Comisión Nacional para el Desarrollo de los Pueblos Indígenas) (2017), Indicadores socioeconómicos de los pueblos indígenas de México, 2015, México: CDI . [ Links ]
Dehouve, Danièle (2001), Ensayo de geopolítica indígena: Los municipios tlapanecos, México: Miguel Ángel Porrúa/CIESAS/CEMCA, 312 p. [ Links ]
Galván Rivera, Flavio (2014), Democracia y justicia electoral en los pueblos indígenas de México, Ciudad de México: Tribunal Electoral del Poder Judicial de la Federación, disponible en: http://portal.te.gob.mx/sites/default/files/democracia_justicia.pdf [fecha de consulta: 30 de enero de 2018]. [ Links ]
Gelman, Andrew y Jennifer Hill (2007), Data Analysis Using Regression and Multilevel/Hierarchical Models, Nueva York: Cambridge University Press, 625 p. [ Links ]
Hernández Díaz, Jorge (2011), Derechos indígenas en las sentencias del TEPJF (Cuadernos de Divulgación de la Justicia Electoral 6), Ciudad de México: Tribunal Electoral del Poder Judicial de la Federación, disponible en: http://www.te.gob.mx/ccje/material_academico/material/cuaderno_6_je.pdf [fecha de consulta: 15 de diciembre de 2017]. [ Links ]
Hernández Narváez, José Ramón (2010), Derechos indígenas y candidaturas plurinominales: Acción afirmativa indígena en la selección de candidatos por el principio de RP, Serie de Comentarios a las Sentencias del Tribunal Electoral del Poder Judicial de la Federación, Ciudad de México: Tribunal Electoral del Poder Judicial de la Federación . [ Links ]
INE (Instituto Nacional Electoral) (2017), Resolución INE/CG508/2017, México: INE, disponible en: https://centralelectoral.ine.mx/2017/11/08/aprueba-ine-criterios-y-acciones-afirmativas-en-materia-de-paridad-y-representacion-de-los-pueblos-indigenas/[fecha de consulta: 28 de enero de 2018]. [ Links ]
INE (Instituto Nacional Electoral) (2018), Sistema de Consulta de la Estadística de las Elecciones Federales (SICEEF), disponible en: http://www.ine.mx/voto-y-elecciones/resultados-electorales/ Instituto Nacional Electoral [fecha de consulta: 30 de noviembre de 2018]. [ Links ]
INEGI (Instituto Nacional de Estadística y Geografía) (2006), Regiones indígenas de México, México: CDI /pnud. [ Links ]
INEGI (Instituto Nacional de Estadística y Geografía) (2011), Censo general de población y vivienda, 2000, México: INE GI. [ Links ]
INEGI (Instituto Nacional de Estadística y Geografía) e IFE (Instituto Federal Electoral) (2012), Sistema Estadísticas Censales a Escalas Geoelectorales, datos del Censo de Población y Vivienda 2010 a nivel de Distrito y Sección electoral, disponible en: http://gaia.inegi.org.mx/geoelectoral/viewer.html [fecha de consulta: 20 de julio de 2018] [ Links ]
INEGI (Instituto Nacional de Estadística y Geografía) (2015), Encuesta intercensal 2015, México: INEGI. [ Links ]
LAPOP (Barómetro de las Américas del Proyecto de Opinión Pública de América Latina) (2012-2017), “Mexico LAPOP AmericasBarometer 2017 V1.0”, “Mexico LAPOP Americas- Barometer 2014 Espanol v3.0”, “Mexico LAPOP AmericasBarometer 2012 Rev1”, disponible en: http://www.lapopSurveys.org [fecha de consulta: 28 de diciembre de 2017]. [ Links ]
Sonnleitner, Willibald (2010), “Desproporcionalidad y malaporcionamiento legislativos en Panamá: Reformas para mejorar el desempeño del sistema electoral”, en Harry Brown (ed.), Las reformas electorales en Panamá: Claves de desarrollo humano para la toma de decisiones, Cuaderno de Desarrollo Humano 1, Ancón, PNUD/Tribunal Electoral de Panamá, pp. 139-214. [ Links ]
Sonnleitner, Willibald (2013), La representación legislativa de los indígenas en México: De la representatividad descriptiva, a una representación de mejor calidad, Temas Selectos de Derecho Electoral 32, México, Tribunal Electoral del Poder Judicial de la Federación (TEPJF). [ Links ]
Sonnleitner, Willibald (2014), “Los límites del consenso comunitario: El caso de Santiago Choápam”, ponencia presentada en el VII Seminario del Observatorio Judicial Electoral, organizado por el TEPJF, Oaxaca, 4 de noviembre. [ Links ]
TEPJF (Tribunal Electoral del Poder Judicial de la Federación) (2014), Sistemas normativos indígenas en las sentencias del TEPJF, Ciudad de México: Tribunal Electoral del Poder Judicial de la Federación , disponible en: http://portales.te.gob.mx/publicaciones/sites/default/files/archivos_libros/Sistemas%20normativos%20indi%CC%81genas.pdf [fecha de consulta: 5 de enero de 2018]. [ Links ]
TEPJF (Tribunal Electoral del Poder Judicial de la Federación) (2017), Recursos de apelación y juicios para la protección de los derechos político electorales del ciudadano. Sentencia de la Sala Superior del TEPJF, exp. SUP.RAP-726/2017, disponible en: https://www.te.gob.mx/genero/media/pdf/06c8a68b6e6ea9b.pdf [fecha de consulta: 16 de diciembre de 2017]. [ Links ]
TEPJF (Tribunal Electoral del Poder Judicial de la Federación) (2018), “SUP-REC-876/2018” y “SUP-JDC-443/2018”, Ciudad de México: Tribunal Electoral del Poder Judicial de la Federación , disponible en: https://www.te.gob.mx/front/publicSessions/detail/1374/0 [fecha de consulta: 3 de noviembre de 2018]. [ Links ]
Warman, Arturo (2003), Los indios mexicanos en el umbral del nuevo milenio, México, Fondo de Cultura Económica. [ Links ]
1The title of the first project is “The participation and political representation of indigenous Mexicans: From discrimination to the inclusion of native populations” and was supported by the Colmex Research Support Fund (FACI). The second project was promoted by Democracy, Human Rights And Security, A.C. and El Colegio de México, under the auspices of the 2017-2018 Electoral Observation Support Fund of the United Nations Development Program (UNDP). It was entitled “Observing the challenges of democratic inclusion in Mexico” and it included the participation of Sophie Hvostoff, Ulises Urusquieta, Arturo Sánchez, Arturo Alvarado, Manuel Jonathan Soria, Mariana Arzate and Norma García. I thank these institutions for the funding, and the colleagues for the rich intellectual exchanges.
2The new normative consensus is reflected in the reforms carried out over the last decades. These were embodied in the Political Constitution of the United Mexican States, as well as in other instruments of international law (ILO Convention 169, the declarations of indigenous rights adopted by the United Nations and by the Organization of American States). This jurisprudence lays the ground for the recognition of the pluricultural composition of the mexican nation and of indigenous rights (TEPJF, 2014; Galván Rivera, 2014; Hernández Díaz, 2011; Hernández Narváez, 2010)
3In 2017, the system of the Registry and Record of Agrarian units (PHINA) still registers 31 699 agrarian units (29 728 ejidos and 1 971 communities), without specifying the ethno-linguistic relevance of the community members and ejidatarios. Available at: https://datos.gob.mx/busca/dataset/estadistica-agraria--indicadores-basicos-de-la-propiedad-social/ [accessed on: April 9, 2019].
436 085 of these sections have fewer, and 642 have more, than 50 per cent of indigenous language speakers.
5Indeed, if it is assumed that a binary variable can take on the values 0 or 1 with a probability of 0.5, this means that the standard deviation of this variable corresponds to the square root of 0.5 x 0.5, which is equal to 0.5. Therefore, the binary variable standardized in this way corresponds to +/- 0.5, and its coefficient is equivalent to a change between 0 and 1. On the other hand, if it is only divided by one standard deviation, the rescaled variable can take values of +/- 1, so the coefficient only corresponds to half the change between 0 and 1 (Gelman & Hill, 2007: 57).
ANNEX
| Descriptive variables | ||||||
|---|---|---|---|---|---|---|
| Estadistics | N valid | Min. | Max. | Mean | Median | Standard deviation |
| pILS | 66 682 | 0.0 | 100.0 | 6.4 | 0.6 | 19.1 |
| Schooling | 66 740 | 0.0 | 18.0 | 8.3 | 8.2 | 2.5 |
| Immigrants | 66 685 | 0.0 | 100.0 | 14.3 | 13.5 | 5.2 |
| Youth15-24 | 66 682 | 0.0 | 98.3 | 13.1 | 13.0 | 2.9 |
| pCatholics | 66 685 | 0.0 | 100.0 | 83.7 | 85.9 | 12.8 |
| ISTE | 66 685 | 0.0 | 100.0 | 5.7 | 3.6 | 6.2 |
| IMSS | 66 685 | 0.0 | 100.0 | 29.5 | 30.7 | 20.4 |
| No_Basic_Services | 66 684 | 0.0 | 100.0 | 16.9 | 10.9 | 15.4 |
| PART_9118 | 59 730 | 14.1 | 96.7 | 58.3 | 58.6 | 7.7 |
| PRI_9118 | 58 793 | 2.9 | 92.5 | 40.2 | 39.3 | 12.0 |
| PAN_9118 | 58 793 | 0.0 | 74.5 | 25.6 | 25.1 | 12.7 |
| PRD_9118 | 58 793 | 0.1 | 83.9 | 16.7 | 13.7 | 11.6 |
| OTHERS_9118 | 58 793 | 0.6 | 49.6 | 17.4 | 17.4 | 5.8 |
| PART_9706 | 62 578 | 0.0 | 100.0 | 54.8 | 55.3 | 9.6 |
| PRI_9706 | 62 391 | 0.3 | 99.1 | 40.5 | 39.1 | 14.9 |
| PAN_9706 | 62 390 | 0.0 | 85.5 | 30.2 | 29.6 | 15.8 |
| PRD_9706 | 62 390 | 0.0 | 99.2 | 23.2 | 19.7 | 15.5 |
| OTHERS_9706 | 62 390 | 0.0 | 35.4 | 6.2 | 5.8 | 3.7 |
| pMORENA_15 | 67 287 | 0.0 | 98.4 | 8.8 | 5.7 | 8.9 |
| pMORENA_18D | 65 690 | 0.0 | 100.0 | 35.9 | 36.4 | 15.7 |
| pAMLO_18P | 65 702 | 0.0 | 100.0 | 52.7 | 54.4 | 17.4 |
| pPRI_18D | 65 690 | 0.0 | 100.0 | 18.8 | 16.2 | 11.4 |
| pPAN_18D | 65 690 | 0.0 | 90.7 | 18.8 | 15.4 | 14.1 |
| pPRD_18D | 65 690 | 0.0 | 95.4 | 5.6 | 2.2 | 8.5 |
Source: Own elaboration based on INEGI-IFE (2012), IFE (2012) and INE (2018).
Received: June 15, 2019; Accepted: April 03, 2020
 Este es un artículo publicado en acceso abierto bajo una licencia
Creative Commons
Este es un artículo publicado en acceso abierto bajo una licencia
Creative Commons
