


 nueva página del texto (beta)
 Inglés (pdf)
 Artículo en XML
 Referencias del artículo
 Enviar artículo por email
 Citado por SciELO
  Similares en
SciELO
Similares en
SciELO 
 Permalink
Introduction
Free radicals are molecules that can exist on their own, and that have unpaired electrons in a molecular orbital (Martemucci et al., 2022); these molecules can be destructive to cells, cause degenerative illnesses, and other oxidative processes (Akbari et al., 2022). Some compounds, such as phenolic compounds are effective on free radicals (Sun and Shahrajabian, 2023), and are also known as antioxidants, and they work by neutralizing free radicals in biological cells (Munteanu and Apetrei, 2021).
Intestinal parasites are common infectious diseases that cause many health problems (Fauziah et al., 2022). Giardia lamblia is an intestinal parasite responsible for the disease called Giardiasis. It is the third biological agent that generates diarrheal diseases in children and adults (Juarez-Saldivar et al., 2021; Morales-Luna et al., 2022). Phenolic compounds in addition to functioning as antioxidants, could be anti-parasitic (Sun and Shahrajabian, 2023), and they have been pursued in science and industry (Silva et al., 2023).
Ellagitannins are phenolic compounds considered hydrolyzable tannins with a hexahydrodiphenyl group (HHDP) and a central glucose (Era et al., 2020); they have demonstrated effectiveness as an antioxidant, and antimicrobial activities (Tolmie et al., 2023). Ellagitannins are found in berries, pomegranate, rambutan, and dried fruits such as nuts (Banc et al., 2023; Estrada-Gil et al., 2022). Eucalyptus camaldulensis is a plant characterized by terpenes and terpenoids (Aleksic Sabo and Knezevic, 2019) esters, flavonoids, ellagitannins, and phenolic acids (Nwabor et al., 2021; Singa et al., 2011) and due to its properties, it is important to recover their compounds.
Conventional extraction methods, such as maceration, and percolation, require large volumes of solvents and a large amount of manpower (Alara et al., 2021; Naviglio et al., 2019). Extraction by maceration is based on placing the plant material in a solvent of interest under specific conditions for a specific time which can be hours or days (Bitwell et al., 2023). In percolation, the sample is sprayed in a system, dropping the solvent on the sample from top to bottom, the system contains a filter that allows obtaining only the solvent with the extract, however, it requires more time, and there are problems in the solubility of the sample (Alara et al., 2021).
In contrast to conventional methods, non-conventional methods enable the retrieval of greater quantities of products and the development of green extractions (Belwal et al., 2020). One of these, the ultrasound-assisted extraction process uses microbubbles to break down the cell walls of the plant material, allowing the release of these compounds in solvent (Machado-Carvalho et al., 2023). Likewise, microwave-assisted extraction, allows the extraction of compounds by using high temperatures to heat the solvents (González-González et al., 2022) and the plant material used using electromagnetic radiation (Castillo-Reyes et al., 2022) so that the solvent permeates in the plant matrix (Ordoñez-Torres et al., 2021).
However, in a hybrid approach, ultrasound and microwaves together allow an improvement in obtaining secondary metabolites from plants, interacting between the cavitation performed and the temperature (Estrada-Gil et al., 2022; Hernández-Hernández et al., 2020). The use of ultrasound-microwave assisted extraction to different polyphenols sources has been reported (Cheng et al., 2023; Ramić et al., 2015; Yadav et al., 2023). This study aimed to compare maceration, percolation extraction and ultrasound-microwave assisted extraction for the recovery of ellagitannins from Eucalyptus camaldulensis and the evaluation of their antioxidant and antiparasitic activity.
Material and methods
Vegetal material
Branches and leaves from Eucalyptus camaldulensis Dehnh (22.23340° N, -100.86150° W, Record number 104039, Herbarium ANSM) were provided by the School of Veterinary and Agronomy of the Autonomous University of San Luis Potosí, San Luis Potosi, Mexico in December 2022. For this study only leaves were used. Leaves from E. camaldulensis were dehydrated at 40-45°C for 48 h in an oven Binder Model BD 400 (Germany). Once dried, the plant material was stored in plastic bags in the absence of light. Subsequently, it was ground a particle size of 0.8 mm in a grinder model Tecnal, TE-631/4 (Brazil).
Chemicals
The reagents gallic acid (No. G7384), catechin (No. C1251), 2,2-diphenyl-1-picrylhydrazyl radical (No. D9132), linoleic acid (No. L1376), 2,2-0-Azino-bis (3-ethylbenzothiazoline-6-sulfonic acid) (No. A1888) were of Sigma-Aldrich (St. Louis, MO, USA), acquired from Sigma Chemical Mexico ®, and all solvents for high-performance liquid chromatography analyses were HPLC grade.
Experimental design
To obtain polyphenol extracts, three extraction methods were evaluated using a fractional factorial design for each extraction method to evaluate mass/volume ratio and ethanol/water ratio, with five levels and each performed in triplicate (Table 1). Each extraction method was systematically tested under varying conditions to assess its efficacy in extracting phenolic compounds from Eucalyptus camaldulensis. The polyphenol content was analyzed using the STATISTICA 7 software an ANOVA and Tukey test was used to compare mean treatments.
Tabla 1. Diseño factorial fraccionado utilizado para la recuperación de compuestos fenólicos.
| Run | Mass/volume ratio | Ethanol/water ratio |
| (g/mL) | (%) | |
| 1 | 1:16 | 0 |
| 2 | 1:16 | 70 |
| 3 | 1:8 | 0 |
| 4 | 1:8 | 70 |
| 5 | 1:12 | 30 |
% Inhibition=(Abs control-Abs sample)/(Abs control)Eq. (1) Where: Abs control is the difference of the absorbances at 0 and 24 h with respect to the control sample, and Abs sample is the difference of absorbances at 0 and 24 h with respect to each sample. Donde: Abs control es la diferencia de las absorbancias a las 0 y 24 h con respecto a la muestra control, y Abs muestra es la diferencia de las absorbancias a las 0 y 24 h con respecto a cada muestra.
Ultrasound-microwave assisted extraction
The Ultrasound-Microwave Assisted Extraction (EAU/M) was executed as reported by Hernández-Hernández et al. (2020), using a cooperative microwave/ultrasound work station (Nanjing ATPIO Instruments Manufacture Co., Ltd. company, Nanjing, China), with a microwave frequency of 2450 MHz, as well as 25 KHz to ultrasound. The sample was placed in a volume of 700 mL, according to the mass/volume ratio of Table 1, and subjected to ultrasound treatment for 20 min. After that, the extracts were recovered by filtrate (Whatman #2).
Maceration
Maceration extraction was performed based according to the method reported by Hasni et al. (2021), using a shaker with a temperature of 50 °C, for 24 h with a shaking incubator (Mini Shaker, shel lab, Sheldon manufacturing inc, USA) at 200 rpm. After the extraction was completed, the liquid was filtrated (Whatman # 2),stored under refrigeration and kept away from light until evaluation.
Percolation
Percolation was carried out following to information described by Tuane et al. (2021) and Cao-Ngoc et al. (2020) for the time of extraction with modifications in the temperature. The solvent was heated in an electric grill (Corning Model PC-220, USA) up to 50°C. The plant material was placed on a filter paper (Whatman #2) and a funnel, passing the solvent through, and completely covering the plant material and the extracts were stored away from light until evaluation.
Separation and determination of bound polyphenols
Eucalyptus leaf residues after all extractions were collected after filtration of the extracts and were stored frozen to determine the bound phenols in the plant material. The extraction of bound phenols was conducted following the method of Zhang et al. (2010) with modifications by Hernández-Hernández et al. (2020), using a digestion of 1.0 g of residue with 50 mL 2 M sodium hydroxide, at room temperature for 4 h. Subsequently, the mixture was acidified with hydrochloric acid pH 2.0. Later, sample was filtered using Whatman # 2 filter paper. Lipids were removed with 30 mL of hexane and the mixture remains were extracted 3 times with 75 mL of ethyl acetate using a liquid-liquid separation. The obtained ethyl acetate fractions were evaporated to dryness in a conventional oven and the bound phenolic compounds were diluted in 5 mL with the same extraction conditions, the obtained fractions were taken as the bound phenols and were quantified according to phenolic compound determination.
Hydrolyzable polyphenols
The hydrolyzable tannin content was determined by the Folin-Ciocalteu technique, described by Gómez-Martínez et al. (2020). For that, 400 μL of sample were added in test tubes isolated from light, 400 μL of Folin Ciocalteu’s reagent were added, followed by stirring with rest for 5 min. After that, 400 μL of sodium carbonate (0.05 M) were added and left to stand for 1 min. Then, 2500 μL of water were added followed by a final stirring, the reaction was read in a spectrophotometer (Thermo spectronic Biomate3, USA) at 790 nm, and a gallic acid standard was used in the range of 0 to 500 ppm.
Condensed polyphenols
The extracts were evaluated as described by Estrada-Gil et al. (2022). A sample of 500 μL was placed in tubes of 8 mL capacity, then 3 mL of Butanol-HCL solution (95:5 v/v) were added and mixed, after 100 μL of ferric reagent (2 %) were added. The solutions were capped and heated in a water bath to 95° C for 1 h. Finally, the reactions were read in a spectrophotometer (Thermo spectronic Biomate3, USA) at 460 nm. Results were expressed based on of catechin standard of 0 to 1000 ppm.
All obtained extracts were evaluated according to their content of hydrolyzable and condensed polyphenols. The sum of both determinations was taken as the total phenolic content.
Chromatography fractionation
The extract with the highest content of total polyphenols was subjected to column liquid chromatography, using the amberlite XAD-16 chromatographic packing as the stationary phase and water and ethanol as the mobile phase. Only the ethanolic fraction containing the ellagitannin compounds of interest was obtained. The phenolic fraction was evaporated in an incubator NAPCO 1000, model 322 (USA) at 45 °C and recovered as a fine powder after complete drying for 48 h (Hernández-Hernández et al., 2020).
Identification of phenolic compounds by HPLC-ESI/MS
A reversed-phase high-performance liquid chromatography analysis was carried out on a Varian HPLC system with an autosampler (Varian ProStar 410, USA), a Varian ProStar 230I ternary pump (USA) and a PDA detector (Varian ProStar 330, Al). Using a chromatography ion trap mass spectrometer (Varian 500-MS IT Mass Spectrometer, USA) coupled to electrospray ion source. Samples of 5 µL were injected onto a Denali C18 column (150 mm × 2.1 mm, 3 µm, Grace, USA) at a temperature of 30 °C in the oven. Formic acid (0.2 %, v/v; solvent A) and acetonitrile as solvent B were used as eluents. The gradient was used as initial 3% B; 0-5 min, 9% linear B; 5-15 min, 16% linear B; 15-45 min, 50% linear B. The column was then washed. Subsequently, the column was washed and reconditioned. The flow rate remained at 0.2 mL/min and elution at 245, 280, 320 and 550 nm. All effluent (0.2 mL/min) was injected into the mass spectrometer source, without splitting. MS experiments were performed out in the negative [M-H]-1 mode, using nitrogen as the nebulizer gas and helium as the buffer gas. The ion source parameters: sputtering voltage of 5.0 kV, capillary voltage, and temperature of 90.0 V and 350 °C, respectively. Samples were initially analyzed using full-scan mass spectrometry (m/z 50-2000 range). The data were extracted and processed in the software MS Workstation (V 6.9) (Hernández-Hernández et al., 2020).
2,2-diphenyl-1-picrylhydrazyl radical scavenging activity (DPPH)
Determination of the 2,2-diphenyl-1-picrylhydrazyl radical scavenging was carried out in a microplate for the purified fraction of ellagitannins from E. camaldulensis, where 7 µL of sample were placed in concentrations of 7. 8 to 1000 mg/L. Then, 193 µL of DPPH reagent (60 µM concentration in methanol) were added, the samples were left to stand for 30 min, at the end of the reaction, sample was taken to a microplate reader (EPOCH Biotek ELISA, USA) at 517 nm. Results were expressed as percentage inhibition and as the half-maximal inhibitory concentration (De La Rosa-Esteban et al., 2023).
Ferric Reducing Antioxidant Power (FRAP)
Ten µL of sample were deposited in a 96-well microplate to testing concentrations of 7.8-1000 ppm. Afterward, 290 µL of FRAP reagent were added and incubated at 37 °C for 15 min. After the incubation was complete, the sample was analyzed in a microplate reader (EPOCH Biotek ELISA, USA) at 593 nm. A calibration curve was performed with TROLOX and distilled water as a control (Delgado-Garcia et al., 2023).
Lipid oxidation inhibition assay
This assay was performed as reported by Estrada-Gil et al. (2022). The sample (50 µL) was mixed with 100 µL of a linoleic acid solution and 1.5 mL of acetate buffer adjusted to a pH of 4.0 were added to a screw capped tube, and ethanol 50% were used as control. Incubation was carried out for 1 min at 37 °C in an incubator NAPCO 1000, model 322 (USA). After the incubation, 750 µL of the FeCl₂-EDTA were added and incubated for 1 h. Then, 250 µL of the reaction were taken and placed in a test tube, later, 1 mL of 0.1M NaOH dissolved in 10% ethanol and 2.5 mL of 10% ethanol were added. Subsequently, sample was mixed and read in a spectrophotometer (Thermo spectronic Biomate3, USA) at 232 nm. The reaction of the sample and linoleic acid was incubated for 24 h at 37 °C, at the end of this incubation time, again 250 µL were taken to which 1 mL NaOH w 2.5 mL of 10% ethanol were added, then read at 232 nm. Results were reported as the half-maximal inhibitory concentration and the percentage of antioxidant power was determined with the following formula.
ABTS antioxidant assay
ABTS radical was prepared out by mixing a solution of potassium persulfate in distilled water (2.45 mM) and an ABTS 2,2-0-Azino-bis (3-ethylbenzothiazoline-6-sulfonic acid) solution at 7 mM diluted in distilled water. The mixture was stored in the dark for 12-16 h and at the end of the time the ABTS solution was conditioned by diluting in ethanol to an absorbance of 0.700 (measured at 734 nm in a spectrophotometer). Once the required absorbance was reached, 10 µL of the sample was mixed with 1000 µL of the adjusted ABTS solution. Subsequently, the absorbance was measured at 734 nm in a spectrophotometer and the results were reported as percentage inhibition of the ABTS radical were reported as percentage inhibition of the ABTS radical (Carlos et al., 2020).
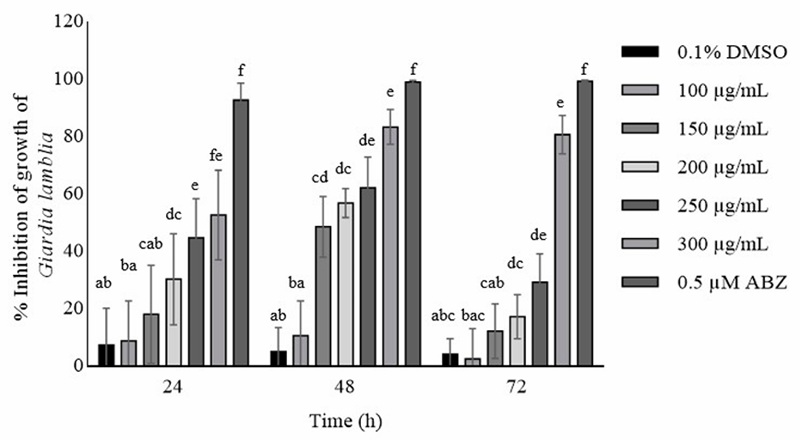
Giardia lamblia inhibition
The growth inhibitory activity in Giardia lamblia was conducted as reported by Vargas-Villanueva et al. (2023) with some modifications. Giardia lamblia (ATCC 50803) was cultured twice in TYI-S-33 medium with 10% bovine serum and 0.5 mg/mL bovine bile per week at 37 °C. To evaluate the effect of ellagitannins from Eucalyptus camaldulensis on growth, an inoculum of 10,000 G. lamblia trophozoites was incubated for 24, 48 and 72 h at 37 °C with concentrations of E. camaldulensis ellagitannins of 100, 150, 200, 250 and 300 µg/mL according to preliminary experiment (Non -reported data), with 0.1% dimethyl sulfoxide (DMSO) as diluent and albendazole 1.5 µg/mL as positive control, each concentration was evaluated in triplicate. After the incubation time the trophozoites were separated from the wall of the tubes by cooling the tubes in an ice water bath for 30 min and counted by optical microscopy using a hemocytometer. The results were expressed as the percentage inhibition of trophozoite growth compared to the control tube. The results of Giardia lamblia growth inhibition were analyzed in GraphPad Prism 6 software using a Two way ANOVA test and as well as TUKEY post hoc analysis with a significant difference of p<0.05.
Results and discussion
Phenolic compound determination
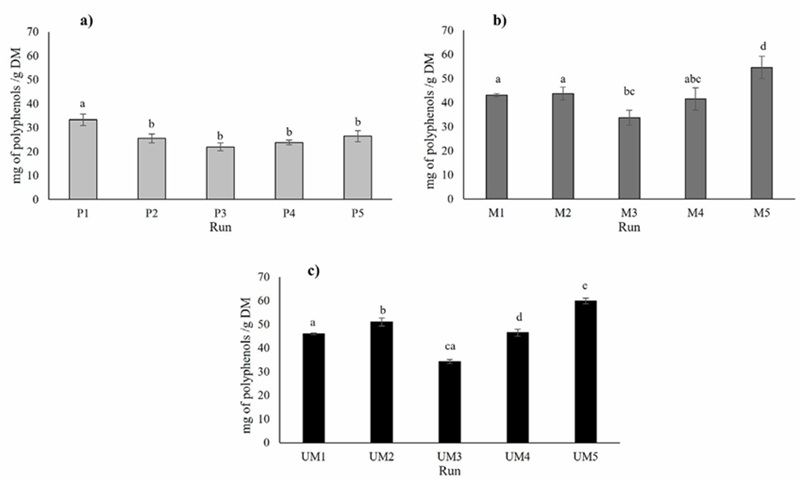
Different types of extraction (percolation, maceration, ultrasound-microwave) were tested to determine the highest extraction content of phenolic compounds (Figure 1). The data presented are the mean values of three distinct extraction methods. Figure 1a shows that, for percolation extraction, the condition yielding the highest polyphenol content was the 1:16 mass/volume ratio with 0% ethanol (P1). This condition demonstrated a significant difference (p < 0.05) compared to all other conditions according to Tukey’s test. In contrast to percolation extraction, the extraction by maceration with a relation mass/solvent 1:12, and 30% of ethanol (M5) presented a higher content of polyphenols (54.50 mg of polyphenols/g) (p < 0.05) than the other conditions used in this extraction method (Fig. 1b). Figure 1 shows that in both, maceration and percolation extractions, and ultrasound-microwave assisted extraction, the lowest phenolic compounds are obtained using a 1:8 mass-volume ratio and 0% ethanol. However, it is also observed that the highest content of phenolic compounds is obtained in the 1:12 condition with 30% ethanol, in the maceration and ultrasound-microwave extraction. For the hybrid extraction (ultrasound-microwave) UM5 allowed the recovery of a higher phenolic content (59.79 mg of polyphenols/g). Thus, water is a good solvent to extract polyphenols, combined with ethanol and the exposure time in maceration, and ultrasound-microwave extraction technology. However, these results show that a greater amount of plant material does not allow a greater extraction of phenolic compounds.
Interestingly, a statistical comparison of means revealed no significant difference between the phenolic content obtained from maceration (M5) and the hybrid extraction method (UM5) (p < 0.05) (See figure 2). However, it is noteworthy that the hybrid extraction method (UM5) outperformed other conditions and extraction methods, showcasing its efficiency in recovering a greater quantity of polyphenols in a shorter duration of 20 min, been and an advantage of ultrasound-microwave assisted extraction (Ordoñez-Torres et al., 2021), unlike maceration method that require a long time (24 h to maceration). Polyphenol content of E. camaldulensis has been previously reported to be between 9.04 ± 0.26 mg/g of polyphenols (Nwabor et al., 2021), and 68 ±30 mg/g (Rosendal et al., 2020), which may vary according to growing conditions of the vegetal material and environmental factors.
Figure 2 Comparison between best extraction conditions (percolation, P1; maceration, M5; ultrasound/microwave, UM5). Different letters in the columns indicate significant differences between runs and equal letters indicate that there was no statistically significant difference (p < 0.05).
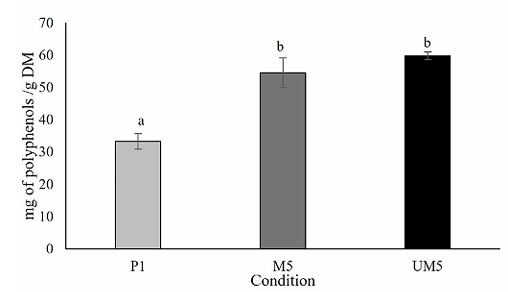
Figura 2. Comparación entre las mejores condiciones de extracción (percolación, P1; maceración, M5; ultrasonidos/microondas, UM5). Las letras distintas en las columnas indican diferencias significativas entre las series y letras iguales indican que no hubo diferencias estadísticamente significativas (p < 0.05).
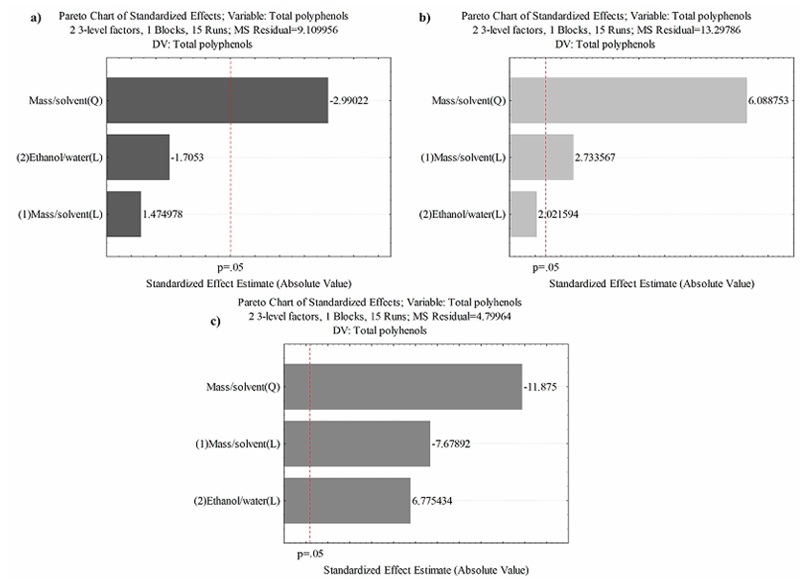
In the three different extraction methods (maceration, percolation, ultrasound-microwave), the most influential factor was the mass/solvent ratio. However, it´s impact was negative for percolation and ultrasound-microwave assisted extraction, in contrast to maceration. Notably, since this effect is quadratic, there is potential for optimization in future studies (Figure 3). Wong-Paz et al. (2015) reported that in E. camaldulensis leaves, the main factor interfering in the extraction of polyphenols was the ethanol/water ratio, where it was possible to obtain the highest content of 14 mg of hydrolyzable tannins using 35% ethanol/water with a conventional heat reflux extraction system. Water is a great solvent for the obtention of polyphenols (Hernández-Hernández et al., 2020), due to its capacity for solubilized natural compounds by their polarity, also the combination with ethanol allows to improve the extraction of phenolic compounds due to reducing the polarity to obtain more compounds (Lajoie et al., 2022). However, under the maceration and ultrasound-microwave assisted extraction methods used in this study, it was possible to obtain a more elevated content of phenolic compounds, using the same ethanol/water ratios. The factor that allowed obtaining a higher phenolic content could be due to the mass/volume ratio. The mass/solvent ratio in the extraction is an essential and strategic factor for obtaining phenolic compounds, as well as the polarity of the extractant solvents (Osorio-Tobón, 2020). A good mass/solvent ratio in te extracción of phenolic compounds allows that vegetal material have a good solubility in the solvent, improve the solubility of comnpounds, according to mass transfer principles (Elboughdiri, 2018).
Bound polyphenols
Bound phenolic compounds are covalently bound to other cell wall structures. Unlike free phenolic compounds that do not interact with other molecules and conventional solvents including organic solvents, bound phenolic compounds are not soluble because of the interaction that occurs with macromolecules such as cellulose or proteins through covalent bonds in the plant cell wall (Rocchetti et al., 2022).
From the determination of the bound phenolic compounds, in the maceration extractions where a higher content of bound phenols was found in the extraction with a 1:8 solvent mass ratio and 0% ethanol, this result shows that the use of these conditions is less favorable to obtain higher number of polyphenols in comparison with the other conditions. By the way, percolation and ultrasound-microwave assisted extractions can also observe a similar behavior, where, using a 1:8 solvent mass ratio and 70% of ethanol retained the highest amount of bound polyphenols compared to the other conditions in their extraction method. In addition, the lowest percentage of bound polyphenols was found in the ultrasound-microwave-assisted extraction with 16 % bound polyphenols compared to soluble ones (Figure 4). This is due to the ability of hybrid technology to break the cell through cavitation and joint temperature, thus allowing the solvent to penetrate the cell and obtain more polyphenols (Estrada-Gil et al., 2022). However, the bound phenolic content of E. camaldulensis has not been reported so far in other investigations (Hernández-Hernández et al., 2020), that used the same extraction conditions and microwave ultrasound equipment, where they found that contrary to what was reported in our research, the extraction condition with the lowest number of bound phenols was 1:16 and 70% ethanol, and 1:8 with 70% ethanol.
Figure 4 Comparative graph of soluble phenolic compounds vs. bound phenolic compounds obtained by a)percolation, b) maceration and c) ultrasound/microwave extractions. Different letters in the columns indicate significant differences between runs and equal letters indicate that there was no statistically significant difference (p < 0.05).
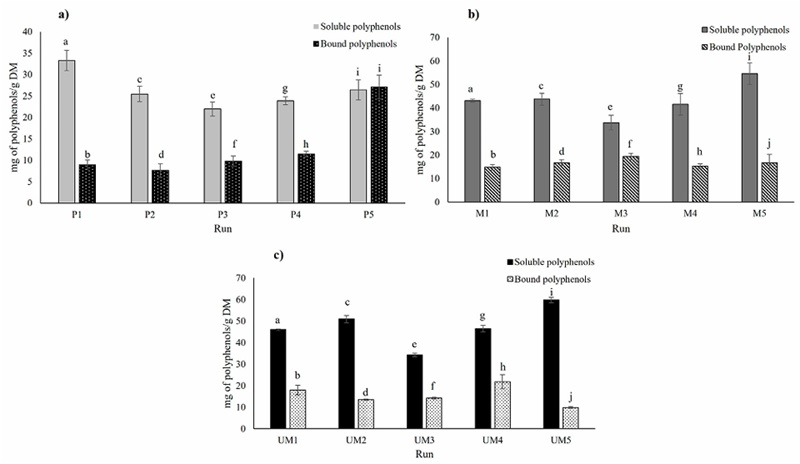
Figura 4. Gráfico comparativo de compuestos fenólicos solubles frente a compuestos fenólicos obtenidos mediante extracciones por percolación a), maceración b) y ultrasonidos/microondas c). Letras diferentes en las columnas indican diferencias significativas entre las series y letras iguales indican que no hubo diferencias estadísticamente significativas (p < 0.05).
Identification of phenolic content
The extract with the highest content of total polyphenols using ultrasound-microwave assisted extraction, mass/volume ratio of 1:12, and 30 % ethanol, was partially purified using XAD-16 amberlite and then the purified fraction was dry. Phenolic compounds were identified via HPLC-ESI-MS, where six ellagitannins and one gallotannin, belonging to the group of hydrolyzable tannins, were found as the main chemical compounds in this fraction, being pedunculagin and tellimagrandin I, ellagic acid, some of those previously reported (Table 2).
Table 2 Identification of obtained compounds from E. camaldulensis fraction (Ultrasound-microwave extraction, 1:12 mass/solvent, and 30 % ethanol).
Tabla 2. Identificación de los compuestos obtenidos de la fracción de E. camaldulensis (extracción por ultrasonidos y microondas, 1:12 masa/disolvente y 30 % de etanol).
| RT | [M-H]- (m/z) | MS2 | Compound | Group |
| 6.78 | 633 | 463, 302, 301, 249 | Galloyl-HHDP-hexoside | Ellagitannin |
| 23.96 | 783 | 481, 375, 301 | Pedunculagin | Ellagitannin |
| 34.06 | 785 | 765, 633, 483 | Tellimagrandin I | Ellagitannin |
| 36.03 | 463 | 302, 301, 300 | Ellagic acid-hexoside | Ellagitannin |
| 39.08 | 301 | 229, 185 | Ellagic acid | Ellagitannin |
| 42.2 | 477 | 315, 300 | Methyl ellagic acid hexoside | Ellagitannin |
| 46.02 | 483 | 331, 169 | Di-galloyl glucose | Gallotannin |
Singa et al. (2011) reported several ellagitannins and other phenolic compounds in crude extracts of E. camaldulensis leaves, among which pedunculagin and tellimagrandin I and II were the most important, these reports have been confirmed by Boulekbache-Makhlouf, Slimani and Madani (2013) in Eucalyptus leaves. This agrees with what was reported in this study.
Antioxidant Assays
The antioxidant activity from of E. camaldulensis fraction obtain from hybrid extraction was determined through DPPH radical inhibition, FRAP, and lipid oxidation inhibition, and ABTS assay. Table 3 show the results of antioxidant assays, where the inhibition is presented as IC₅₀, are determined by the half-maximal inhibitory concentration.
To DPPH assay, has been reported in other research with extracts from E. camaldulensis, obtained by Nwabor et al. (2021) an activity of IC₅₀ 65.67 mg/L, in contrast with the results reported in our investigation, is a best activity (IC₅₀ 371.13 mg/L). Alghoraibi et al. (2020) described a DPPH scavenging activity higher (IC₅₀ 90 mg/mL). Furthermore, these authors found the antioxidant activity of IC₅₀ 82.9 mg/mL to ABTS to be different from our results this activity is higher. However, these activities could be for other compounds in your extract, and in our study, only a fraction of ellagitannins were evaluated.
Another important antioxidant capacity is the ferric reducing antioxidant power (FRAP); in the results presented in Table 3 an antioxidant capacity higher than 500 mg eq. of Trolox/g. This result is an important finding, because there are reports of lower concentrations than those reported in a study realized by Gullón et al. (2019), who reported a content of 112.4 mg equivalent of Trolox/g with Eucalyptus globulus, showing that in E. camaldulensis a higher activity on FRAP than E. globulus can be found.
On the other hand, no recent reports have been found on the inhibition of lipoperoxidation with compounds from Eucalyptus camaldulensis, nevertheless, Assaggaf et al. (2022) reported with another Eucalyptus species an IC50 0.17 μg/mL, likewise. Harkat-Madouri et al. (2015) reported an IC50 of 6.75 mg/mL, both being higher than reported by our study.
Antioxidant capacity is an activity that has been related to anticancer and antitumor activities. Thus, some of the compounds found in isolation in this study show antioxidant activity. The activity of pedunculagin isolated from leaves of Eucalyptus spp. against liver tumor cells in-vitro (QGY-7703) has been reported with IC₅₀ 64.3 ± 6.1) μg/mL, causing holes in the membrane of tumor cells (Xiao et al., 2012). Furthermore, Al-Sayed and Esmat (2016) reported the antioxidant activity of pedunculagin and tellimagrandin I in an in-vitro assay, demonstrating protection against carbon tetrachloride-induced hepatotoxicity in HepG2 cells. Pedunculagin increased superoxide dismutase levels by 76%, while tellimagrandin I elevated glutathione levels by 81%. Additionally, the isolated ellagic acid has shown activity on ABTS (4.59 ± 0.07 μg/mL) and DPPH (10.54 ± 0.07 μg/mL) (Yang et al., 2023).
Giardia lamblia inhibition
The results in Figure 5 show the inhibitory effect of ellagitannins from Eucalyptus camaldulensis at 24, 48 and 72 h. Inhibitory effects of 18 -52% were obtained at the first 24 h, from 150-300 µg/mL, reaching the maximum inhibitory effect (83 ±6.03%), however, there is no difference between the control and the first two concentrations (100 and 150 µg/mL). The highest inhibitory effect took place at 48 h at the highest concentration (300 µg/mL), on the other hand, the effect of 150 µg/mL remained static with no difference p<0.05 compared to the control, reaching an IC₅₀ 183.6. At 72 hours the concentrations of 150-250 µg/mL decreased their effect to less than 40% inhibition. Unlike the 300 µg/mL concentration with an effect of 80% ±6.73. The use of ethanol extracts of pomegranate peel in the inhibition of Giardia lamblia has been reported.
Garza-Ontiveros et al. (2024) observed that grape pomace polyphenols had the greatest effect on G. lamblia at 48 h with 59% inhibition at a concentration of 200 µg/mL, and that grape pomace polyphenols induced an apoptosis-like process in Giardia lamblia trophozoites. It was also shown that all concentrations caused alterations in the distribution of α-tubulin in the ventral disc, flagella and midbody. They also showed a decrease in flagella size or loss of flagella as the concentration of polyphenols increased. In vitro effects could be due to alterations in cytoskeletal dynamics or the stress response culminating in apoptosis-like cell death in the parasite. The effect could be due to changes in cytoskeletal dynamics or the stress response culminating in apoptosis-like cell death in the parasite. Nevertheless, El-Kady et al. (2021) reported an inhibition of up to 98% in higher concentrations (50 mg/mL than those reported in this study (0.3 mg/mL) of pomegranate peel extracts, being that pomegranate peel possesses some ellagitannins such as pedunculagin, galloyl-HHDP-hexo side, ellagic acid-hexosid in addition to ellagic acid, which are found in our study (Hernández-Corroto et al., 2020). Other authors such as Palomo-Ligas et al. (2022) showed inhibition of Giardia lamblia with an extract of pomegranate peel with ellagitannins (punicalin, punicalagin and ellagic acid) at concentrations of 150, 175 and 200 µg/mL, showing a maximum inhibition of 74% at 48 h. Surprisingly, they also showed deformations of the trophozoites such as elongation, loss of the characteristic shape, protuberances on the dorsal surface, irregularities on the periphery and, in addition, caused deformations of the flagella such as shortening or even loss, as well as perforations in the membrane with the treatments at 150, 175 and 200 µg/mL. Surprisingly, they demonstrated that this pomegranate peel extract interacts with the cytoskeleton of Giardia by altering tubulin, thus causing alterations to the microtubules of the ventral disc, flagella, causing deformation, decreasing their adhesion capacity and growth inhibition. This could be one of the inhibition factors of Giardia lamblia in our study, since ellagitannin compounds are similar to those reported for E. camaldulensis; however, in our research, more studies are needed to determine if this is the same behavior.
Conclusions
Hybrid extraction (ultrasound-microwave assisted extraction) shows that it is a good method for obtaining ellagitannins from Eucalyptus camaldulensis compared to extraction methods such as maceration and percolation, and allows obtaining compounds such as tellimagrandin I, pedunculagin. Therefore, E. camaldulensis is a plant source of ellagitannins, which possess antioxidant activity such as ferric-reducing antioxidant power, inhibition of lipid oxidation, DPPH radical inhibition, and ABTS radical inhibition. Furthermore, ellagitannins from E. camaldulensis possess antiparasitic activity against Giardia lamblia.

