




 nueva página del texto (beta)
 Inglés (pdf)
 Artículo en XML
 Referencias del artículo
 Traducción automática
 Enviar artículo por email
 Citado por SciELO
  Similares en
SciELO
Similares en
SciELO 
 Permalink
Introduction
In Mexico, one of the most threatened ecosystems is the natural grassland, mainly caused by the livestock activities (CONABIO, 2022), which are carried out extensively in approximately 110 million hectares, with adverse effects in 95 % of that area (SEMARNAT, 2015). This has an impact on decreasing vegetation cover as well as on the development and reproduction of plant species with the highest nutritional value for livestock (CONABIO, 2022). In addition, it increases the soil’s compaction by trampling, reduces infiltration, encourages runoff and, as a consequence, generates erosion (Gutiérrez et al., 2014). Also, it disturbs the availability and quality of surface and groundwater; and finally, it causes a loss of biodiversity, stability and ecosystem resilience (SEMARNAT, 2015).
In the state of Durango, the total area used for forestry, farming and livestock production, is 6.3 million hectares (INEGI, 2022). Of this, 45 % is affected by overgrazing, where the extensive “cow calf” system predominates with production and sale of offspring at weaning (SEMARNAT, 2015). The Livestock Law for the State of Durango establishes in article 156, the cattle ranchers’ obligation to conserve and improve grasslands (Congreso del Estado de Durango, 2021a). Meanwhile, the Sustainable Rural Development Law, in article 120, considers that resources should be applied for the same purposes (Congreso del Estado de Durango, 2021b). However, few producers comply with these provisions, and generally, the stocking rate exceeds the land’s carrying capacity (COTECOCA, 1979).
To counteract the deterioration of grasslands, the National Institute of Forestry, Agricultural and Livestock Research (INIFAP) recommends the application of management and conservation practices such as adjustment of the stocking rate, rotational grazing systems, exclusion in degraded areas, and planting of grasses, among others. Also, in order to capture water, reduce runoff and increase forage production, it suggests works such as level ponds, banks and fur-rows (Gutiérrez et al., 2014).
Another alternative to reduce erosion risks in the event of flows is the HKD, which considers the construction of retention or drainage works to conserve the soil and generate water reserves (Giambastiani et al., 2023; Villalobos, 2017). In 1950, Percival Yeomans integrated the use of level or slightly sloped lines (keyline) to the method, to direct the rain runoff towards the driest parts of the land and to infiltrate it. This practice reduces erosion and favors the regeneration of vegetation (Cortés and Ramírez, 2013). It consists in the identification of the keypoint on a topographic plane, which indicates a change from a steep slope to a softer one (Figure 1) and the keyline extends on both sides of the keypoint. The tillage pat-tern is traced on the keyline (Ruiz, 2013), which is subsequently tilled with a Yeomans-type underground cultivator (Gras, 2012).
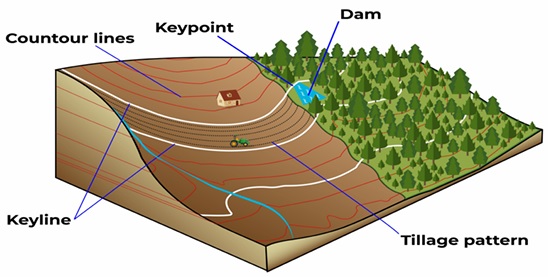
The first applications of keyline designs were made in 1950 by Percival Yeomans to control rain runoff on undulated terrain in Australia (Cortés and Ramírez, 2013). For their part, Mollison and Holmgren used it to establish ecological farming on organic farms in Australia in the 70’s (Almaraz and Gras, 2012). Recently, it was implemented as part of a comprehensive agriculture system in Colombia (Buitrago, 2013). In Patagonia, grassland regeneration was the focus (Valdez and Aramayo, 2018). Similarly, Gras (2012) applied it in Mexico in various regions with the same purposes. Despite this, there is little information with scientific rigor on the subject.
The objective of this study was to evaluate the effect of HKD on soil and water conservation, as well as vegetation growth in a grassland ecosystem in the state of Durango, Mexico. The hypothesis proposed was that the application of hydrologic keyline design favours the soil retention, conservation of vegetation, as well as the conservation and distribution of moisture in the land.
Material and methods
Study area
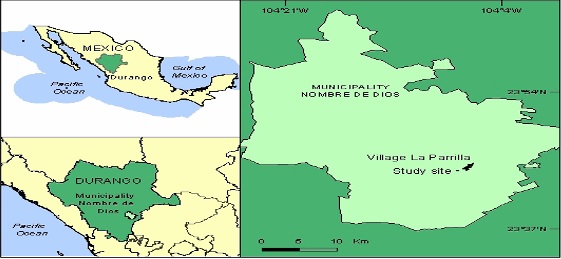
The study area is located south of the village “San José de La Parrilla”, Nombre de Dios, Durango, Mexico, which is 76 km from the city of Durango (Figure 2). The geographical coordinates are: 23° 44’ 14.54” N and 104° 7’ 32.37” W and the altitude is 2,130 m. The studied area is 12 ha and is part of a private property.
General site description
The site is used for beef cattle production and has an average slope of 14 %. According to COTECOCA (1979), the vegetation corresponds to a medium grassland with shrubs and trees (Cb(B)35), which is composed of perennial, medium, and tufted grasses that are associated with shrubs and low-growing trees (less than 5 m). The soil is of colluvial origin and is derived from igneous rocks; it has a shallow depth (less than 25 cm) and medium internal drainage, but when it rains, the surface runoff is rapid. This corresponds to the leptosol soil group, which is characterized by having little development, high stoniness, rocky outcrops, and a large amount of calcareous material (SEMARNAT, 2014).
The area was overgrazed for over 50 years, but since 2002, it has been fenced off and managed with light to moderate grazing. Despite this, the effects of improper management, eroded areas, presence of calcareous outcrops, and invasion of undesirable plant species are still evident.
The land’s hydrology has not allowed for soil improvement due to runoff flowing from the ridges to the gullies, causing loses of water, soil, and nutrients through streams in the area. All this is increased by the lack of soil conservation works.
Soil physicochemical characteristics
To characterize the soil’s physicochemical properties, 18 samples were randomly extracted at a depth of 0 to 20 cm, with which a composite sample was established. The sample’s physicochemical parameters that appear in Table 1 were reviewed in accordance with the methods indicated in NOM-021-RECNAT-2000 (SEMARNAT, 2002).
Tabla 1. Parámetros fisicoquímicos del suelo en el área experimental.
| Parameters | Result | Classification | Method used |
| Sand (%) | 73 | Bouyoucos | |
| Clay (%) | 9 | ||
| Silt (%) | 18 | ||
| Texture class | Sandy loam | ||
| Field capacity (%) | 11.6 | Bodman y Mahmud | |
| Permanent wilting point (%) | 3.6 | ||
| pH | 7.7 | Moderately alkaline | Potentiometer |
| Electric conductivity (dS m-1) | 1.2 | Moderately low | Conductivity meter |
| Total carbonates (ppm) | 6.81 | Moderately low | Acid neutralization |
| Organic matter (%) | 3.1 | Half | Weight Loss-on-Ignition |
| Phosphorus (ppm) | 27.7 | High | Olsen |
| Nitrate (ppm) | 9.23 | Moderately low | Colorimetric |
| Potasium (ppm) | 219 | High | Ammonium acetate |
| Sulfur (ppm) | 1.55 | Very low | Turbidimetric |
| Magnesium (ppm) | 154 | Moderately low | Ammonium acetate |
| Cation Exchange Capacity (meq 100 g-1) | 22.2 | Medium | Ammonium acetate |
Climate
The climate is semi-dry temperate with rains in summer and an average annual rainfall of 400 to 600 mm in the July-September period, and an average annual temperature of 16 to 20°C (INEGI, 2017). In order to obtain climatic data for the site and study period, the temperature and relative humidity were recorded from June 2017 to December 2018 by using a data logger (HOBO). The minimum temperature recorded was -7 °C, the maximum was 32 °C and the average was 18 °C. The minimum relative humidity in the summer was 18 %, the average was 62 % and the maximum was 86 % in both years. Annual precipitation at the site was 485 mm in 2017 and 395 mm in 2018.
Site preparation
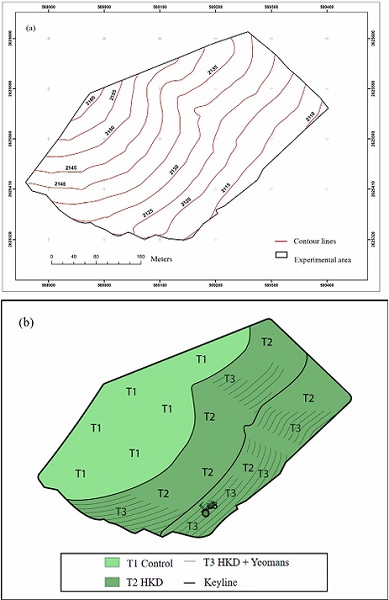
The area was surveyed with a fixed-wing drone (model eBee). With the information obtained, a plan was drawn up with level contour lines one meter apart (Figure 3a), where the HKD was established according to the methodology described by Gras (2012). Two keylines were identified to change the site’s hydrology (Figure 3b). These were designed as level canals to retain and direct the rain runoff from the gullies (where it normally accumulates and runs) to the ridges (generally the driest parts), and thus distribute the water throughout the land and also infiltrate it.
The foregoing was done in order to reduce the runoff speed, allow water to remain on the site, reduce the dragging of particles, and finally favour the regeneration of soil and vegetation on the site.
In July 2017, the HKD was implemented. The keylines were marked on the ground with points 15 m apart, by using two 2-meter-long graduated rulers and a transparent hose with water acting as a level. The canals were built following the outline of these keylines with a D-4 Bulldozer using a 3-meter-wide blade. Subsequently, the tillage pattern was made according to the design with a farm tractor and a Yeomans-type chisel plough (Figure 3b). The canals were used as guides to design the tillage pattern that the Yeomans-type cultivator should follow, which according to Ruiz (2013) is made in a parallel and progressive manner below and above the canals. However, it was delineated smoothly higher on the gullies, and lower on the ridges (Figure 3a). The ploughing was done where the topography and vegetation allowed the entry of agricultural equipment (Figure 3b).
Treatments
According to the previous description, the implemented and evaluated treatments were: T1) Control, without HKD; T2) HKD, part of the area below the canals; and T3) HKD+Yeomans (Figure 3b).
Variables evaluated
Six sampling sites (repetitions) were established for each treatment, where humidity, soil compaction, soil erosion, vegetation cover, and aerial phytomass yield were quantified (Figure 3b).
Soil
Humidity (%): To measure it, gypsum blocks were used according to Florentino (2011) and with the help of a multi-meter, the soil’s electrical resistance emitted by the blocks was measured, which is inversely related to humidity. The soil moisture curve determined by gravimetry was used for its calibration. The measurements began in October 2017 by placing sensors in each treatment. The readings were grouped into three periods: end of the rainy season in 2017, the dry season in 2017-2018, and end of the rain season in 2018.
Compaction (kg cm -2 ): Compaction was recorded 18 months after the study was established; a Dickey John brand compaction tester was used. The meter’s tip was placed on the ground and then uniform and constant pressure was applied to slowly penetrate the tip until it could no longer enter; this allowed to register the resistance to penetration.
Erosion (ton ha -1 ): Erosion was evaluated one year after the trial was established and after the rainy season. Erosion was estimated according to the UNESCO method (2017); for this, 25-cm-long nails were placed and buried 15 cm apart with washer as a stop. Soil loss or accumulation was measured with a digital vernier to the nearest hundredth of a millimetre.
With the data obtained, the erosion was estimated by adding the readings of the nails that lost soil, and those that had sedimentation were given a value of zero. Then, they were divided by the total number of nails. The sedimentation average was quantified with the same criteria.
At the same time, the net erosion was determined, which is the difference between the removed soil and the sedimented one (exit and entry on the surface of the treatments). After adding them, the mobilized soil was obtained according to the procedure indicated by Pizarro and Cuitiño (2002). The results were extrapolated to tons per hectare.
Vegetation
Vegetation cover (%): Six and 18 months after the experiment was established, the vegetation cover was determined with the use of Canfield Lines (Silva-Piña et al., 2018); for this, 5-meter-long lines were established, where the following was estimated:
Herbaceous cover. The herbaceous species intercepted by the line were considered.
Soil without cover. Soil without vegetation was considered.
Mulch. Referring to waste derived from material of plant origin.
Aerial phytomass yield (kg ha -1 ): Six months into the design, the phytomass yield was estimated in the HKD and Control treatments. It was not quantified at that time in the HKD+Yeomans, because the vegetation cover was disturbed by the passage of the Yeomans-type cultivator, so at the moment, there was no effect revealed. Finally, at 18 months, the yield was estimated in the three treatments.
In rectangular 0.5 m2 plots (quadrants of 1.0 x 0.5 m), all the plants were cut flush with the ground. Subsequently, they were dried in a forced air oven at 55°C until the weight was constant. Finally, the dry weight and yield were determined, and based on this, the kilograms per hectare were extrapolated (Gutiérrez-Arenas et al., 2018).
Statistical analysis
The research work was carried out according to a completely randomized design. The data were subjected to a normality analysis using the Shapiro-Wilk test (P < 0.05). When the variables met the normality requirement, analysis of variance was performed and in cases where there were significant differences, Tukey’s mean comparison tests were performed (P < 0.05). When the data did not present normality, the Kruskal-Wallis non-parametric test was used. Statistical analyses were carried out through the use of the STATISTICA program.
Results
Soil
Humidity. The differences between treatments were not significant at the end of the period in 2017 (P > 0.05). However, in the dry period (Nov. 2017 to Jun. 2018), the humidity differed between treatments (P < 0.05), where HKD+Yeomans kept the humidity above the permanent wilting point (3.9 %). Equally, in the final rainy season of 2018, the HKD+Yeomans treatment statistically surpassed the control (P < 0.05) with 2.9 % (Table 2).
Tabla 2. Resultados del análisis estadístico, que muestran el efecto de los tratamientos sobre la humedad del suelo (%).
| Season-year | Treatment | SS | DF | MS | F | P | n | ||
| Control | HKD | HKD+ Yeomans | |||||||
| End rainy-2017 | 9.1a ± 4.7 | 9.9a ± 4.7 | 9.8a ± 3.2 | 6.751 | 2 | 3.376 | 0.1873 | 0.829746† | 18 |
| Dry 2017-2018 | 2.6b ± 1.1 | 3.2ab ± 2.4 | 3.9a ± 2.6 | 37.264 | 2 | 18.632 | 4.0526 | 0.01958† | 45 |
| End rainy-2018 | 9.9b ± 1.2 | 12.1ab ± 1.1 | 12.9a ± 2.1 | 30.903 | 2 | 15.452 | 6.051 | 0.010364†† | 6 |
a,b Different letters in the same row indicate significant differences among treatments, according to the †Kruskal-Wallis and ††Tukey tests. ± standard deviation. a,b Diferentes letras en el mismo renglón indican diferencias significativas entre los tratamientos, según las pruebas †Kruskal-Wallis y ††Tukey. ± desviación estándar.
Compaction. The soil’s resistance to the penetrometer was similar in the three treatments (P > 0.05; Table 3). A resistance of 23 kg cm-2 means that compaction is high in the first 20 cm of the soil profile (Unger and Kaspar, 1994; Singh et al., 2015).
Table 3 Statistical analysis, and effect of treatments on resistance to penetration in the soil (kg cm-2).
Tabla 3. Análisis estadístico y efecto de los tratamientos sobre la resistencia a la penetración en el suelo (kg cm-2).
| Parameter | Treatment | SS | DF | MS | F | P | n | ||
| Control | HKD | HKD+ Yeomans | |||||||
| Compaction | 23.9a ± 1.0 | 23.3a ± 0.6 | 23.8a ± 1.4 | 1.15 | 2 | 0.58 | 0.520 | 0.60497 | 6 |
a Equal letters for the same variable indicate no significant differences between treatments according to the Kruskal-Wallis test. ± standard deviation. a Las letras iguales para la misma variable indican que no hay diferencias significativas entre los tratamientos según la prueba de Kruskal-Wallis. ± desviación estándar.
Erosion. The area with HKD had the least erosion, followed by HKD+Yeomans, and the control. In the latter, soil loss was higher than treatments two and three, with 126 and 117 ton ha-1, respectively (Table 4).
Tabla 4. Componentes de la erosión (ton ha-1), derivados de los tratamientos aplicados (n=6).
| Treatment | Erosion (a) | Sedimentation (b) | Net erosion (a-b) | Mobilized soil (a+b) | Potencial erosion classification †† |
| 1.- Control | 157 | 30 | 127 | 188 | 150 a 200 High |
| 2.- HKD | 31 | 148 | -116† | 179 | < 50 Low |
| 3.- HKD+Yeomans | 40 | 40 | 0 | 80 | < 50 Low |
† Negative value indicates a positive net balance or soil gain. †† Classification of the level of erosion according to Montes-León et al. (2011). † El valor negativo indica un balance neto positivo o una ganancia de suelo. †† Clasificación del nivel de erosión según Montes-León et al. (2011).
Vegetation
Vegetation cover. Six months after the experiment was established, low herbaceous cover (13 %, on average) was found with no statistical difference between treatments (P > 0.05), but with a statistical difference among components (P < 0.05) (Figure 4a), where the highest component was the mulch with around 60 % in both treatments.
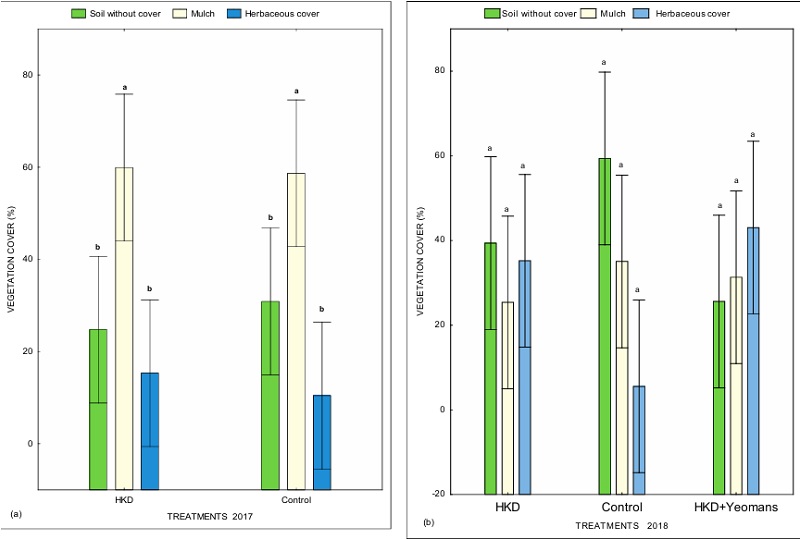
At 18 months, there were important changes in the vegetation cover (Figure 4b). In the HKD and HKD+Yeomans, the percentage of soil without cover was lower than the control with 20 and 35 percentage points, respectively. The herbaceous cover was higher in the HKD with 32 percentage points and HKD+Yeomans with 38 units with respect to the Control (P > 0.05).
Aerial phytomass yield
Six months after the experiment was established, differences were observed between treatments (P < 0.05), where HKD+Yeomans surpassed the Control with 753 kg ha-1 and HKD with 360 kg ha-1 (Table 5, P < 0.05). At 18 months, HKD+Yeomans and HKD exceeded the Control with 770 and 454 kg ha-1, respectively (Table 5, P < 0.01).
Tabla 5. Rendimiento de fitomasa aérea (kg ha-1) por tratamiento.
| Year | Treatment | SS | DF | MS | F | P | n | ||
| Control | HKD | HKD+ Yeomans | |||||||
| 2017 | 100b ± 49.6 | 460ab ± 472.3 | 853a ± 781.2 | 1133217 | 2 | 566608 | 2.033385 | 0.0183 | 4 |
| 2018 | 33b ± 18.4 | 487ab ± 438.3 | 803a ± 820.6 | 1800642 | 2 | 900321 | 2.97405 | 0.0099 | 6 |
a,b Different letters for the same variable indicate significant differences between treatments according to the Kruskal-Wallis test. ± standard deviation. a,b Letras diferentes para la misma variable indican diferencias significativas entre los tratamientos según la prueba de Kruskal-Wallis. ± desviación estándar.
Discussion
Soil
Humidity. At the end of the 2017period, higher humidity was expected in the treatments where HKD was applied, but it is difficult for humidity to be conserved due to the soil’s characteristics in the experiment due to the depth of 0-20 cm, sandy loam texture, 14 % slope and compacted soil. These results are in agreement with those obtained by Lal and Shukla (2004), as well as with those reported by Toro-Mujica (2023), in the semi-arid region of Chile.
In the dry period, significant differences were observed in humidity between the treatments. In this regard, Almaraz and Gras (2012) explain that the Yeomans underground subsoiler creates canals with little soil disturbance, where water is easily transported, runs slowly, infiltrates and remains in the ground longer.
This is repeated, in the final 2018rainy season, where the HKD+Yeomans treatment surpassed the Control. This confirms that the hydrological keyline design accompanied by the Yeomans underground cultivator favours water retention. Studies by Oscanoa and Flores (2019) describe that the introduction of soil conservation techniques such as furrows and holes. influence the increase in soil humidity by up to 6 %.
Compaction. High resistance values observed in soil penetration, are influenced by the soil’s sandy loam texture as it is susceptible to compaction especially in the upper layers (Oscanoa and Flores, 2019). This condition can affect the establishment and development of vegetation since root growth decreases when compaction is greater than 20 kg cm-2 (Unger and Kaspar, 1994). In addition, the pore space is reduced, and the water infiltration rate is affected (Lal and Shukla, 2004).
Ruíz (2013) explains that the use of the Yeomans plough in grasslands, in addition to help water transport without disturbing the soil, it cuts the compacted layers and improves their depth. Therefore, compaction is expected to decrease in the medium term in the areas where the implement is used consecutively.
Erosion. According to the amount of soil removed in the different treatments, the presence of the HKD reduced the erosion range from highest (> 150 ton ha-1) to lowest (< 50 ton ha-1) according to Montes-León et al. (2011).
Regarding the accumulation of sediments, the HKD treatment retained a greater amount; this indicates the dragging of external materials to the treatment area, resulting in negative net erosion and a high volume of mobilized soil (Table 4). On the other hand, the Control presented the lowest values in sediments; this may be due to the lack of structure to retain the runoff and dragging of particles, which increased net erosion. Ponce-Rodríguez et al. (2019) and Giambastiani et al. (2023), explain that the presence of conservation works established with contour lines, changes the terrain’s hydrology and runoff is reduced and distributed by the established infrastructure. Likewise, conservation works are reported to reduce erosion (Oscanoa and Flores, 2019).
Grassland areas with high erosion rates are much more difficult to recover by simply excluding them and moderating grazing (Distel, 2013). Thus, other practices are required as is the case in the study area where the grassland has minimally recovered in almost two decades.
The amount of soil eroded was equal to the amount of sedimented soil in the HKD+Yeomans (Table 4), which equates to a net erosion of zero; this is the lowest volume of soil mobilized among the three treatments. This shows that the canals created by the Yeomans subsoiler produce detachment and dragging of soil particles; however, these are retained by HKD+Yeomans reducing erosion as mentioned by Buitrago (2013). A higher rate of soil infiltration allows for less soil removal.
Vegetation
Vegetation cover. The low percentages of vegetation cover estimated six months after the study was established, reflect the grassland’s degradation due to improper use. However, the high fraction of mulch is a contribution of organic matter and seeds, which will promote the regeneration of soil and vegetation (Massara et al., 2013).
Regarding the changes reflected in components evaluated at 18 months, it is expected that the presence of the hydrological keyline design favours the development of vegetation, which is in line with the results of IMTA (2013), who reported an increase of 13 % in the forage sorghum yield. Similarly, Valdez and Aramayo (2018) achieved positive results in the growth of grasslands vegetation in Patagonia.
Aerial phytomass yield. The higher forage yield in treatments with keyline can be explained on the amount of available water was higher, especially in the HKD+Yeomans, where it was above the permanent wilting point in the dry period (Table 2). This shows that the use of the Yeomans plough integrated with HKD in grasslands favoured the humid condition for plant growth.
According to Ruiz (2013)), the technique leaves roots in the soil and helps to conserve organic carbon, which in turn will conserve more water (144,000 L ha-1 for every 1 % of organic carbon), which favours soil fertility as reported by Hishe et al. (2017)) for other conservation works, and therefore helps vegetation development (IMTA, 2013; Valdez and Aramayo, 2018; Toro-Mujica, 2023).
Conclusions
The hydrological keyline design had a positive effect on soil conservation by reducing erosion, having the highest moisture percentages, and improving the phytomass yield. The implementation of HKD, especially combined with the use of the Yeomans-type subsoiler in pasture areas, is a useful tool to improve the condition of grasslands.

