


 nueva página del texto (beta)
 Inglés (pdf)
 Artículo en XML
 Referencias del artículo
 Enviar artículo por email
 Citado por SciELO
  Similares en
SciELO
Similares en
SciELO 
 Permalink
Introduction
Rocky Mountain Spotted Fever (RMSF) is a disease caused by the Rickettsia rickettsii bacterium, transmitted in Mexico mainly through the bite of infected Rhipicephalus sanguineus hard ticks, a common parasite of domestic dogs (Biggs et al., 2016). Although RMSF can be prevented and treated, it remains as the most lethal of the spotted fever group rickettsioses (Biggs et al., 2016; Álvarez-Hernández et al., 2017; Treadwell et al., 2000).
Multiple biological, environmental and social determinants can be associated with the burden of the disease, despite understimation of its actual magnitude and impact (Álvarez-Hernández et al., 2024a) . In Mexico the most afflicted are biological and socially disadvantaged groups, such as children younger than 10 years, older adults, and people living in poverty (Álvarez-Hernández et al., 2017; Álvarez-Hernández et al., 2024b). Despite uncertainty on the causal mechanism, factors such as socioeconomic status, individual behaviors, and interaction between human and host reservoirs (i.e. dogs), among others, have been associated with heavy exposure to ticks and increased risk of being infected (Parola et al., 2008; Atkinson et al., 2012; Tomassone et al., 2018). Moreover, variability of air temperature and relative humidity have an impact on the density and spatial distribution of hard ticks (Dantas-Torres, 2010; Ogden 2021; Nutall, 2022).
In Mexico, the annual cumulative incidence (CI) of RMSF fluctuates between 3.2 and 9.8/1 000 000 inhabitants (Álvarez-Hernández et al., 2024b). Sonora is a northwestern Mexican state, with an upward trend of morbidity and mortality of the disease since its reemergence in the early 2000’s. Here, the incidence of RMSF is 26 times higher than the national average, with case-fatality rates (CFR) above 30 %, mainly in children and socially underserved groups (Álvarez-Hernández et al., 2017; Álvarez-Hernández et al., 2024). Within the state of Sonora, the cities of Hermosillo and Obregon together account for 53 % of the annual volume of cases (Álvarez-López et al., 2021).
Overall, there is little evidence about the potential link between temperature and the geographic distribution of RMSF at the small-area level in urban settings. In Mexico, scarcity of data from meteorological stations in urban areas and limited access to laboratory techniques to confirm cases hamper real-time studies. However, by using Land Surface Temperature (LST) as a proxy for air temperature variations, can serve to approaching variability of environmental temperature, which is important because survival of ticks may be influenced by the formation of microclimates within a city (Suss et al., 2008); therefore, LST can help in identifying areas that can be suitable for the abundance of R. sanguineus ticks.
The aim of this research was to describe the spatial distribution of RMSF at the census tract level in two cities in the state of Sonora, Mexico, by examining the correlation between the CI of the disease with an index of social marginalization (ISM), and LST. The study of the geographic distribution of RMSF at the small area level can provide understanding to design effective public health interventions to deal with the problem.
Material and methods
Study Area
An ecological study was carried out in Hermosillo and Obregon (see Figure 1a), the most populated cities in the state of Sonora, Mexico. Both cities comprise the highest incidence of RMSF within the state (Álvarez-López et al., 2021). Hermosillo is the state capital and had a population estimated to be 936,263 in the year 2020, and 530 urban census-tracts, known in Mexico as Basic Geostatistical Areas (BGA) [INEGI, 2020], which is the unit of analysis of this study. Its average annual air temperature is 24.9° C (17.4º C-34.0º C) [Navarro et al., 2018]. On the other hand, Obregon had an estimated population of 436,484 and 244 urban census tract [INEGI, 2020]. It has an average annual air temperature of 25.1° C (17.6° C-33.9° C) [Navarro et al., 2018]. The annual precipitation in both cities depends on the influence of the North American monsoon which generates around 70 % of the rainfall during the months of July - September. In the urban area, the historical precipitation in Hermosillo is 356 mm per year and in Obregon is 386 mm per year [Navarro-Estupiñán et al., 2018].
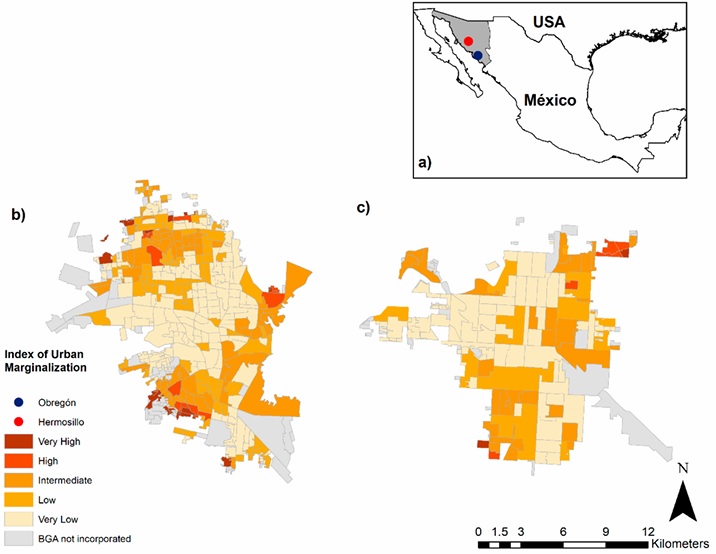
The socioeconomic status of each census tract is based on ISM, a population indicator widely used in Mexico to categorize the social welfare of a defined population. The ISM was from the year 2020; it is based on nine socioeconomic variables, three of them hypothetically related with tick exposure (i.e., percentage of illiterate adult population, proportion of homes having dirt floors, and proportion of employed population earning up to two minimum wages). Statistically, the ISM is built on a principal components technique to classify into five strata the degree of social marginalization: very high (worst level), high, intermediate, low, and very low (best level). Each census tract has an ISM that allows the stratification into one of the five strata (Gobierno de México, 2020). Thus, Hermosillo grouped 68 % and Obregon 73 % of their census tracts in the intermediate, low, and very low strata. See figure 1b-c.
Rocky Mountain Spotted Fever (RMSF) data
All cases of RMSF included in the study corresponded to the period 2006-2018. Each case is systematically registered in an electronic database from the Sonora Public Health Department, from which they were retrieved. A confirmed case of RMSF, code A77.0 of the 10th Rev of the International Classification of Diseases (WHO, 2019), was as a patient with two or more acute clinical manifestations (≤7 days) including fever, headache, malaise, rash, diarrhea, vomit, and history of tick exposure with a single positive confirmatory test, which included detection of R. rickettsii DNA using real-time or end-point polymerase chain reaction (PCR) from a whole blood specimen. To identify the Rickettsia genus, the gltA gene was used with an amplification product of 401 base pairs (Labruna et al., 2004). For the rickettsii species, the A1G_04230 gene was identified, which codes for the hypothetical protein through an amplification product of 153 base pairs (Kato et al., 2013). We also confirmed a case in clinically suspected patients with detection of antibodies IgG (>1:64) specific against R. rickettsii in an Indirect Immunofluorescence Assay (IFA) from a single blood sample. All the diagnostic tests were performed in the Sonora State Laboratory of Public Health. Only cases with a known address were included.
The study database included 428 cases, 202 (48.1 %) from Hermosillo, and 226 (51.9 %) from Obregon, who were linked geographically to their corresponding census tract. By using Google Earth®, we retrieved the street, number, intersections, and neighborhood of each case and then exported to a Geographic Information System (GIS) without identifying any of the subjects’ addresses to safeguard privacy and confidentiality. All study procedures were approved by the Bioethics Committee of the Department of Medicine and Health Sciences, University of Sonora (D-124/24.08.2019).
Spatial variability of Land Surface Temperature
It has been referred that because of the scarcity of climate stations within the city limits, many cities are unable to generate spatial maps and temporal resolutions about the variability of air temperature (Tsou et al., 2017; Yang et al., 2017). Thus, satellites can measure the radiation coming from the Earth-Ocean-Earth-Atmosphere systems, including the solar radiation reflected and the infrared radiation emitted, which can be used as a proxy for air temperature variations (Sorek-Hamer et al., 2016).
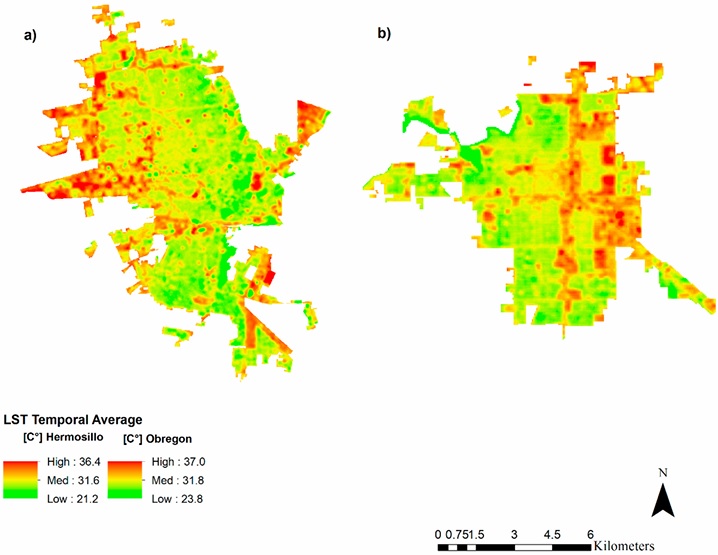
In our study, data was obtained through the thermal infrared sensor (TIRS) of the satellites Landsat 5 and Landsat 8; remote sensing images were used to estimate the Land Surface Temperature (LST). Three thermal bands at a resolution of 30 meters were used, with images available approximately every 16 days at 11:00 am local time (Navarro-Estupiñán et al., 2018). To calculate the LST, data from the Landsat 5 were used for the period 2006 - 2012, while the Landsat 8 images were utilized for the period from 2013 - 2018. A total of 428 satellite images were downloaded, from which 100 were eliminated due to cloud cover (Figure 2).
Descriptive data analysis
We described the geographic distribution of cases by gender, age, and the census tract assigned category of social marginalization. The georeferenced census tracts were the basis for depicting the spatial distribution of cases by using the point density tool in ArcGIS TM (ESRI, 2011). The statistical differences in categorical variables between the cities were examined using the chi-squared test; a two-tailed hypothesis was used, and p values < 0.05 were considered statistically significant. We utilize the StataSE 12.0 TM software to conduct the statistical analysis.
Cumulative incidence (CI) of RMSF per 10,000 inhabitants was calculated for each census tract; because of heterogeneity in the population size of the census tract, the CI of RMSF was smoothed through the Bayes empirical method (Besag et al., 1991) by using the GeoDa ™ software version 1.14.0. Once the CI was smoothed, maps about its geographic distribution were created for both cities using ArcGIS™ version 10.3.
Statistical and spatial correlations
The Moran’s I statistic measured the global spatial correlation between the cumulative incidence of the disease and the ISM. The observed Moran’s I value ranges from -1 to +1. For interpretation purposes, a value close to +1 indicates a strong positive spatial correlation, meaning a clustering of cases in a geographic area of high social marginalization and high rates of the event; a value close to -1 indicates strong negative spatial correlation, that is, a dispersion pattern; and a value of zero implies a random pattern (Siabato y Guzmán-Manrique, 2019). The Local Indicators of Spatial Association (LISA) method was used to identify statistically significant local clusters and local spatial outliers (Celemín, 2009). Maps were obtained through the GeoDa™ software version 1.14.0.
To assess the spatial correlation between the CI of RMSF, ISM and LST, each variable was normalized into a common scale (0 to 1). In Hermosillo, average LST higher than 31.6° C received a value of 1, while a CI ˃ than 3.8 cases per 10,000 inhabitants (80th percentile) was considered to have a value of 1; for Obregon, LST higher than 31.8 ° C and a CI > 8.16 cases per 10 000 inhabitants corresponded to a value of 1. Furthermore, each stratum of the ISM was assigned with a value ranged from 1 (very high social marginalization) up to 0.2 (very low)
Lastly, the Getis-Ord (Gi*) method was applied to find statistically significant “hot” and “cold” spots in the heat risk map. G i * is a Z-score, with large values implying a more intense clustering of high values and negative values mean cold spots as shown in the equation:
Where G i * (d) is the local G statistic for a feature i within a distance (d), and W ij (d) is the spatial weight for the target-neighbor i and j pair (Peeters et al., 2015). Ord and Getis (Ord y Getis, 1995) developed a z-transformed form of Gi * to improve the statistical testing. The statistical significance and degree of clustering is evaluated according to the confidence level and Z-scores. If Z(G i * ) has a positive and significant value, it means that the pixel has a relatively high probability of being a hot spot area. Otherwise, if Z(G i * ) has a negative and significant value, the pixel has a high probability of being a cold spot area (Ord y Getis, 1995).
Results
The study sample consisted of 428 cases of RMSF, 200 (46.7 %) of them were confirmed through PCR, 104 (24.3 %) by detection of IgG ≥ 1:64; in 84 (19.6 %) patients both IgM and IgG titles ≥ 1:64 were found, while in 40 (9.4 %) only IgM was detected. The overall cumulative incidence (CI) for both cities was 4.7 per 10,000 inhabitants, while in Hermosillo was of 3.5 cases per 10,000, and for the city of Obregon was of 6.9 per 10,000. The observed case fatality rate (CFR) was of 18.0 % (77/428), 56 (CFR 29.1 %) of the deaths occurred in Hermosillo, 21 (CFR 9.8 %) took place in Obregon. Ninety-five percent (407) of the subjects were linked geographically to their census tract of residence. Out of these, 44.8 % (192) resided in Hermosillo and 50.2 % (215) in Obregon.
A higher proportion (59.5 %) of the cases were women, even more (67.9 %) in Ciudad Obregon than in Hermosillo (50.0 %) (p < 0.001). The cases were more frequent (167; 41.0 %) among children and adolescents, followed by adults aged 30 - 49 years (128; 31.5 %). A significant difference (p = 0.004) in the age distribution of the cases was observed. Regarding the degree of social marginalization, the highest proportion (33.7 %) of cases corresponded to the intermediate stratum, while only 13.3 % was into the strata of high and very high social marginalization, such differences were significant (p = 0.008) (Table I).
Tabla I Características seleccionadas de casos incidentes de fiebre manchada por Rickettsia rickettsii. Sonora, México. 2006-2018-
Table I. Selected characteristics of incident cases of Rocky Mountain spotted fever. Sonora, Mexico. 2006-2018
| Variable | N (%) | P* | ||
| Hermosillo (n = 192) | Obregon (n = 215) | Total (n = 407) | ||
| Sex * | ||||
| ̶ Male | 96 (50.0) | 69 (32.1) | 165 (40.5) | |
| ̶ Female | 96 (50.0) | 146 (67.9) | 242 (59.5) | 0.000 |
| Age group (years)* | ||||
| < 10 | 41 (21.4) | 31 (14.2) | 72 (17.7) | 0.040 |
| 10 - 19 | 52 (27.1) | 43 (20.0) | 95 (23.3) | |
| 20 - 29 | 27 (14.1) | 30 (13.9) | 57 (14.0) | |
| 30 - 49 | 49 (25.5) | 79 (36.7) | 128 (31.5) | |
| 50 - 59 | 13 (6.8) | 24 (11.2) | 37 (9.1) | |
| > 60 | 10 (5.2) | 8 (3.7) | 18 (4.4) | |
| Degree of social marginalization a* | ||||
| ̶ Very high | 7 (3.7) | 4 (1.9) | 11 (2.7) | 0.008 |
| ̶ High | 30 (15.6) | 13 (6.0) | 43 (10.6) | |
| ̶ Intermediate | 67 (34.9) | 70 (32.6) | 137 (33.7) | |
| ̶ Low | 47 (24.5) | 67 (31.2) | 114 (28.0) | |
| ̶ Very low | 41 (21.4) | 61 (28.4) | 102 (25.0) | |
a Based-on data from the National Population Council 2015. The Index of social marginalization is composed of nine variables: % of illiterate population >15-years-old; % of population >15-years-old without elementary; education; % of occupants in homes without drainage or toilets; % of occupants in homes without electricity; % of occupants in homes without piped water; % of homes with certain level of overcrowding; % of occupants in homes with dirt floors; % of population in towns with less than 5000 inhabitants; and % of employed population earning up to two minimum wages. *Based on a χ2 statistic
On the other hand, the census tract having a high degree of social marginalization had the highest smoothed CI of RMSF, followed by those with very high degree of social marginalization. This pattern was observed for both localities, despite the largest number of census tracts corresponded to neighborhoods with low (n = 130) or very low (n = 259) level of social marginalization (Table 2).
Tabla II Incidencia de fiebre manchada por Rickettsia rickettsii por índice de marginación social a nivel de área censal de las localidades de estudio. Sonora, México. 2006-2018.
Table II. Incidence of RMSF by index of social marginalization according to census tract in study localities. Sonora, Mexico. 2006-2018.
| Variable | Hermosillo | Obregon | ||
| Incidence of RMSF * | IQR | Incidence of RMSF * | IQR | |
| Degree of social marginalization a | ||||
| ̶ Very high (n= 25) | 2.2 | 1.8 - 2.4 | 10.0 | 10.0 - 10.4 |
| ̶ High (n= 20) | 5.6 | 2.3 - 9.5 | 7.2 | 6.9 - 13.0 |
| ̶ Intermediate (n= 107) | 2.1 | 0.8 - 4.0 | 6.9 | 6.1 - 9.1 |
| ̶ Low (n= 130) | 1.6 | 0.8 - 3.8 | 6.7 | 5.8 - 8.2 |
| ̶ Very low (n= 259) | 1.3 | 0.8 - 2.2 | 6.5 | 5.6 - 6.8 |
a Based-on the index of social marginalization with data from the National Population Council, 2015. * Smoothed rate per 10,000 population. IQR= Interquartile Range.
Density of RMSF cases per km2
Overall, a heterogeneous geographic pattern of the RMSF cases throughout both cities was observed, with no evident clustering. However, when using the density of cases per km2, a higher case-density in scattered census tracts in Hermosillo was observed, reaching clusters of 12 to 14 cases per km2, mainly in the north of the city. In Obregon, clusters of 23 to 27 cases per km2 were found in the northeast and the southwest of the city, as shown in the Figure 3 a-b.
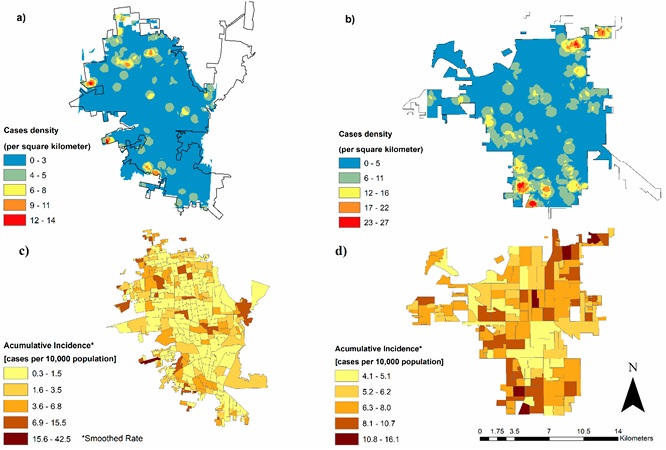
Regarding the spatial distribution of the smoothed CI, the census tracts with the highest CI of RMSF in Obregon are coincidently located at the northeast side of the city, whereas in Hermosillo are placed at the east and north, with higher dispersion towards the city suburbs (Figure 3 c-d).
Spatial correlations and clustering
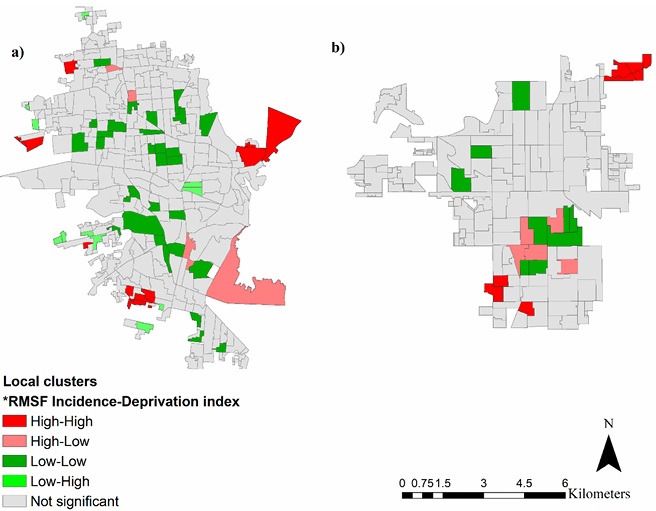
Broadly, a weak (Moran’s I = 0.27) although positive (p < 0.05) spatial autocorrelation between the smoothed CI of RMSF and the ISM was observed in Hermosillo. Additionally, in the local bivariate analysis, census tracts having high incidence of RMSF as well as high ISM were detected throughout the four cardinal points of the city. A similar value (Moran’s I = 0.29) for the geographic autocorrelation was found in Obregon. Despite that, census tracts with high incidence of RMSF and high social marginalization were identified at the northeast and southeast sides of this city (Figure 4).
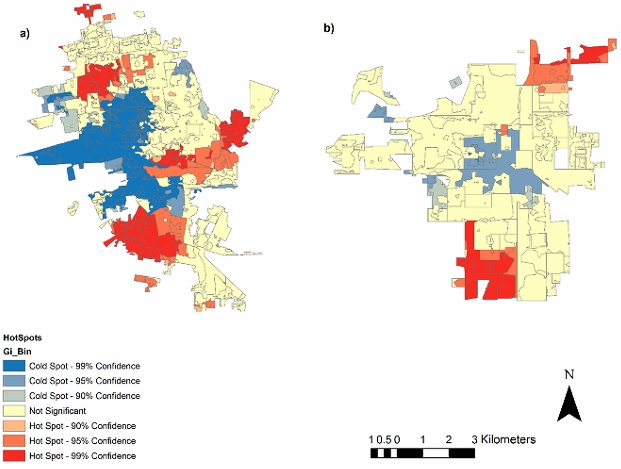
Lastly, by using the Gi* method several RMSF hot spots were detected in Hermosillo, in such areas coincided a high smoothed CI (> 3.88 cases per 10 000 inhabitants), high degree of social marginalization, and land surface temperature > 31.6° C; these clusters were statistically significant and can be qualified as of high risk for transmission of the disease within the city. Furthermore, in Obregon two hot spots were clearly defined at the northeast and southwest sides of the city. Such patterns are displayed in Figure 5.
Discussion
Since early 2000, RMSF has remained as a serious public health problem in Sonora and other regions of Mexico, with growing evidence about its geographical spread across the country, particularly along the US-Mexico border (Drexler et al., 2017; López-Castillo et al., 2018; Maynez-Prieto et al., 2021; Zazueta et al., 2021; Estrada-Mendizabal et al., 2023). In this context, our findings can contribute to gain understanding on the geographic distribution of the disease in urban settings. More specifically, in determining neighborhoods that are at high-risk and where interventions can be implemented. Overall, we found that RMSF followed a heterogeneous spatial distribution within the study cities, albeit several high-risk areas with a high incidence of RMSF and a high degree of social marginalization were identified by using spatial interpolation and clustering techniques.
Although there is no certainty about the urban distribution of RMSF in Mexico, our findings are consistent with evidence from Brazil in which the spatial distribution of the disease correlates with socioenvironmental variables and tick-host interaction (Ribeiro et al., 2020). In this sense, we cannot conclude that there is an individual effect of socioeconomic status over the risk of RMSF, but an aggregated effect may exist since the higher incidence of the disease was positively correlated with worse living-conditions at the census-tract level in both cities.
In RMSF endemic regions, it is pivotal to relate the population wellbeing with the geographic patterns of the disease. In Mexico, the ISM is an influential indicator and can be helpful to understand the spread of the disease, mainly because it includes indicators about sanitary conditions of households, such as the quality of build materials, access to sanitation, disposal of garbage, among others. Some of these characteristics can help to depict epidemiological patterns of the disease, as many determinants of the physical space can foster growth, multiplication, and development of the brown dog tick. For instance, the makeshift building materials are directly related with sites suitable for breeding and hiding of ticks (i.e., holes in walls or floors, yards with dirt floors) around and indoor of households, which increases the risk of cases and outbreaks of the disease (Demma et al., 2005; Álvarez-Hernández et al., 2020). Additionally, demography and movement patterns of dogs, as related with density of homes, should be considered when analyzing urban patterns of the disease (López-Pérez et al., 2020).
We also found that high incidence of RMSF correlate with a high degree of social marginalization, similar to that observed in endemic regions of Brazil (Oliveira et al., 2017). In Sonora, there are no studies specifically addressing the geographical distribution of RMSF at the census-tract level, however, previous findings at the individual level highlight the need to improve preventive strategies for the disease, particularly in socially vulnerable neighborhoods (Reyes-Castro et al., 2021).
On the other hand, across the Americas RMSF shows a seasonality with epidemic peaks when environmental temperature and humidity are higher (Biggs et al., 2016). In Sonora that rise occurs during the period of June through November, thus environmental conditions may increase the risk for RMSF in the outskirts of localities where a higher land surface temperature (LST) significantly correlate with higher incidence of RMSF. However, a more refined analysis at the regional level is needed, for instance differentiating the LST by time of day could determine if this effect is associated with patterns of feeding, growth, or development of the brown dog tick and how this could explain local patterns of disease transmission.
Furthermore, by using the Gi* method for joint analysis we found significant clusters of RMSF, where there is an overlap between high levels of social marginalization, high cumulative incidence, and high LST. Although we did not assess the role of relative humidity, our finding is comparable with previous evidence, in which a higher level of poverty, a higher average of land temperature (> 35.0 °C), and increase of relative humidity, were associated with higher incidence of RMSF (Raghavan et al., 2016).
For a tick to transmit the disease, the pathogen R. rickettsii must survive the molting of every stage of the tick, which means that the pathogen greatly depends on the development, survival, and reproduction of the tick, and on the relationships with the environment (Parola et al., 2008; Tomassone et al., 2018). Therefore, factors like urban poverty and climate can be critical for the spread of RMSF, because such determinants can provoke microclimates that affect the life cycle of hard ticks (Estrada-Peña y Venzal, 2007; Gray et al., 2009). Soil temperature is correlated with evaporation, so the presence of uncut brush, scrubs, and other shelters in-and-around homes (i.e. cracks in walls and floors) may provide a suitable microclimate for the development of ticks, increasing the risk of human exposure to R. rickettsii and other rickettsial pathogens (Dantas-Torres, 2010).
Finally, our study has limitations that should be carefully considered. First, our ecologic design could bias the global effect of social and environmental factors on the geographic pattern of the disease, which may flaw the correlation between the actual incidence of RMSF and ISM, therefore future studies can explore that relationship with epidemiologic designs using individual units of study. Importantly, misclassification of RMSF cases may have arisen because 50 % of study subjects were confirmed with a single blood sample processed by IFA, which is notoriously unable to distinguish between SFGR and RMSF (McQuiston et al., 2014); in addition, we used regular PCR targeting a 401 base pairs of Rickettsiae from human blood samples, which could have a relatively low sensitivity, prompt to false negatives. Undoubtely, there is an urgen need to improve the methods of diagnosis of RMSF in Mexico. Despite this, still there is a strong indication that R. rickettsii is the only pathogen associated with the occurrence of RMSF cases in northwest Mexico (Álvarez-López et al., 2021; Zazueta et al., 2021; Estrada-Mendizabal et al., 2023) so our findings can be orientative for studying urban distribution of the disease in endemic regions.
Conclusions
The global distribution of RMSF is heterogeneous in the study cities, with areas of high incidence randomly spread. Moreover, at the global level, a weak spatial correlation between the incidence of RMSF and the ISM was identified, but socially deprived census tracts within the cities showed high incidence of the disease, and thus, can be considered hot spots for public health interventions. The land surface temperature can be a useful indicator to detect hot spots of the disease, given that the survival and development of hard ticks, such as R. sanguineus sensu lato, are associated with ecosystems having warmer surface temperatures (Parola et al., 2008; Ogden et al., 2021; Nutall, 2022).
Our findings show that spatial analysis is a useful tool for the identification and stratification of risk areas for RMSF at the small-area level. In scenarios like ours, its routinary use can be cost-effective and, through data management systems, can improve the quality of information sources. This has the potential for better analysis and real-time results that would help with timely decision making for the prevention and control of the disease.

