


 nueva página del texto (beta)
 Inglés (pdf)
 Artículo en XML
 Referencias del artículo
 Enviar artículo por email
 Citado por SciELO
  Similares en
SciELO
Similares en
SciELO 
 Permalink
Introduction
Since the domestication of turkey (Meleagris gallopavo) in the Southwestern United States and Mexico (Thornton et al., 2012; Vergara et al., 2019), it has been considered one of the major important poultry species that contributes to meat production worldwide (Aslam et al., 2011). The United States is the leading country in turkey’s meat intake, followed by Brazil and Germany, which accounted for 41, 8.1, and 8 % of the total intake of turkey meat (Hristakieva, 2021). Nevertheless, turkey meat still shares a small proportion of global meat demand. According to FAO, turkey meat production ranked second (5 %), after chicken (90 %), of the global poultry meat production. The environmental and ethical concerns surrounding industrial animal agriculture have become increasingly evident. Therefore, the intake pattern of meat-based proteins is projected to be reshaped significantly by 2030. While ruminants are a major contributor to greenhouse gas emissions (Giamouri et al., 2023), turkey production, once viewed as a promising alternative to traditional livestock, is also expected to decrease emissions in the coming decade (Kheiralipour et al., 2024; Clauss et al., 2020).
Generally, avian genomes are interesting because they tend to be compact, with less DNA overall, yet packed into more chromosomes compared to mammals (Axelsson et al., 2005). Turkey’s genome is quite larger than chicken and consists of 1,115,474,681 bp, with 16,226 coding genes, and 30,708 gene transcripts (Dalloul et al., 2010). The genome of the turkey is not fully uncovered, and massive efforts are needed to be fully understood (Barros et al., 2023). For many decades, microsatellites (also called Short Sequence Repeats, SSRs) were the markers of choice for breeders and geneticists, as they were used for many purposes including the conservation of genetic resources (Olubunmi, 2019). Microsatellite loci are scattered throughout the genome in both coding and non-coding regions. Certain repeats are preferred and are often predominant in certain genomic locations. However, the significance of this observation is unclear (Vieira et al., 2016). Microsatellite loci are among the variable types of DNA within the genome, and the changes in their polymorphisms derive mainly from changeability in length instead of within the essential arrangement (Abdul-Muneer, 2014). A more profound understanding of the developmental and mutational properties of microsatellites is in this manner required, not as it were to get it how the genome is organized, but moreover to accurately utilize microsatellites information in populace inheritance of important traits (Wöhrmann and Weising, 2011).
In the past few decades, there has been significant effort focused on the development of microsatellites in the genome of turkeys. In 1999, several turkey genomic libraries were constructed, and 50 microsatellite loci were characterized (Huang et al., 1999), followed by the construction of a linkage map contacting 74 markers (Burt et al., 2003), and arranging 314 microsatellite loci in 29 linkage groups. The latter resulted in the identified of ~800 microsatellite markers (Reed et al., 2007). Recently, a set of 34 microsatellites was identified (Canales Vergara et al., 2020), and successfully used to estimate genetic diversity parameters in 10 domestic turkey populations.
Given the high cost, labor-intensive nature, and limited scalability of developing microsatellite markers, in silico approaches present a valuable alternative, offering faster and more comprehensible insights into target genomes. Therefore, this study aimed to perform an in silico analysis of the whole-genome sequence of the turkey (Meleagris gallopavo) mining it to identify a panel of microsatellite loci, and explore the distribution and density of microsatellites within the turkey genomes.
Mathematical model
Data source. Sequence data of the domestic turkey chromosomes were obtained from the National Center for Biotechnology Information (NCBI). The analyzed reference sequences were uploaded to NCBI in 2019, with a reference of Turkey_5.1 (GCA_000146605.4).
In silico mining of whole-genome-wide SSRs. The sequence data were downloaded in FASTA format. The Krait software v.1.1.0 (Du et al., 2018) was used for microsatellite mining. Krait software is based on several data mining algorithms for microsatellite detection. It uses pattern recognition to identify repeat sequences within genomic data, sequence alignment to compare these sequences against databases for accuracy, and also conducts statistical analysis to calculate frequency and distribution of microsatellites across chromosomes. The authors selected to use Krait for the analysis because it is an ultrafast tool with a user-friendly graphical interface, making it ideal for genome-wide microsatellite analysis. Additionally, Krait is a powerful tool that not only detects various types of microsatellites (both perfect and imperfect) but also assists in designing primers for them. This makes it ideal for efficiently identifying and defining valuable microsatellite markers. The analysis was carried out based on to the following criteria: mono-nucleotide repeat motifs were required to have at least of 10 repeats, di-nucleotide repeat motifs were at least 7 repeats, tri-nucleotide repeat motifs at least 5 repeats, and tetra-, penta-, and hexa-nucleotide repeat motifs at least 4 repeats.
The Primer3 tool (Rozen and Skaletsky, 1999) integrated within the Krait software package was used to design primers for the identified microsatellite markers. Primer3 uses empirical formulas to calculate the melting temperature of potential primers to select suitable Tm ranges. Additionally, Primer3 checks the primer specificities by aligning the primers against target sequences in order to minimize non-specific binding. The program also assesses the primer lengths and GC contents regarding optimal annealing and stability (Untergasser et al., 2012).
The total numbers obtained were normalized either as a percentage or as the number of SSRs per megabase (Mb) of sequence, enabling comparison across genome sequences of different sizes such as relative abundance. The estimated repeat density (base pairs per Mb) was obtained by dividing the total number of base pairs occupied by SSRs by the total genome size. Correlation coefficients between different SSR-related parameters were estimated using the software SPSS (Morgan et al., 2019).
Results
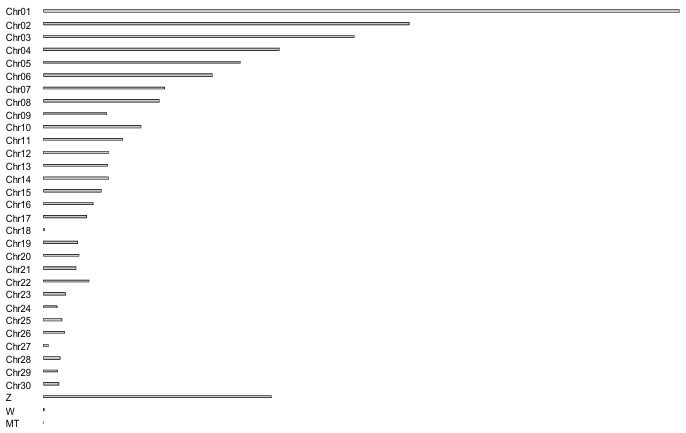
The domestic Turkey is one of the most important poultry species, with a large genome consisting of 1,061,817,103 base pairs. A total of 30 autosomal and two sexual chromosomes were analyzed. The total sequence length was 1,115,474,681, and the total unmapped length was 1,080,180,254, with scaffolds of 187,695. As shown in Figure 1, the largest chromosomes of the turkey genome are chromosomes 1, 2, and 3, followed by the Z chromosome. In contrast, chromosome 18 is the smallest autosomal chromosome measuring 244,177 bp.
Perfect microsatellites. Table 1 presents the number of perfect microsatellites detected in different chromosomes. Interestingly, the number of perfect SSRs did not correlate with chromosome size. The highest number of perfect microsatellites (16743) was found in chromosome 4, despite not being a large chromosome (74,864,452 bp, and it ranked 5th in size within the turkey genome). The second highest numbers were detected on chromosomes 8, 1, 15, and Z, respectively. However, significant positive correlation coefficients were observed between chromosome size and both total number (0.44) and total length (0.457) of perfect microsatellites as shown in Table 2. Conversely, the lowest number of perfect microsatellite was detected in chromosome 18, where only one microsatellite was found. No microsatellites were detected in chromosome W nor mitochondrial DNA.
Tabla 1. Resumen de información de diferentes tipos de microsatélites.
| Perfect SSR | Imperfect SSR | |||||||
| Chr | Total number of perfect SSRs | Total length of perfect SSRs | Relative abundance | Relative density | Total number of imperfect SSRs | Total length of imperfect SSRs | Relative abundance | Relative density |
| 1 | 4610 | 80986 | 246 | 4320 | 18445 | 546084 | 983.9 | 29128 |
| 2 | 2131 | 34285 | 196 | 3156 | 9669 | 261983 | 889.9 | 24113 |
| 3 | 2216 | 38855 | 240 | 4216 | 9061 | 269405 | 983.2 | 29234 |
| 4 | 16743 | 271480 | 240 | 3896 | 68202 | 1939960 | 978.7 | 27837 |
| 5 | 1120 | 17626 | 192 | 3017 | 5264 | 144004 | 901 | 24649 |
| 6 | 1129 | 18470 | 226 | 3690 | 4817 | 135581 | 962.4 | 27090 |
| 7 | 320 | 5459 | 180 | 3079 | 1482 | 41222 | 835.9 | 23249 |
| 8 | 6927 | 109015 | 203 | 3195 | 31039 | 847657 | 909.6 | 24839 |
| 9 | 184 | 3597 | 148 | 2891 | 1103 | 31471 | 886.5 | 25294 |
| 10 | 642 | 10265 | 223 | 3570 | 2733 | 77480 | 950.5 | 26945 |
| 11 | 177 | 3167 | 153 | 2740 | 934 | 25310 | 808.1 | 21898 |
| 12 | 174 | 2969 | 148 | 2531 | 1134 | 31925 | 966.6 | 27211 |
| 13 | 249 | 4202 | 263 | 4436 | 976 | 27770 | 1030 | 29314 |
| 14 | 164 | 2877 | 172 | 3017 | 755 | 21227 | 791.7 | 22260 |
| 15 | 2960 | 48817 | 173 | 2850 | 15055 | 409929 | 878.8 | 23929 |
| 16 | 225 | 3465 | 152 | 2339 | 1247 | 32134 | 841.9 | 21695 |
| 17 | 190 | 3166 | 210 | 3506 | 792 | 21741 | 877 | 24075 |
| 18 | 1 | 12 | 61.9 | 742.4 | 15 | 498 | 928.1 | 30811 |
| 19 | 89 | 1393 | 178 | 2790 | 448 | 12460 | 897.1 | 24952 |
| 20 | 66 | 1034 | 125 | 1954 | 370 | 9806 | 699.3 | 18534 |
| 21 | 86 | 1622 | 178 | 3360 | 470 | 13679 | 973.5 | 28332 |
| 22 | 81 | 1386 | 121 | 2075 | 545 | 14215 | 815.9 | 21279 |
| 23 | 128 | 1880 | 193 | 2831 | 619 | 15498 | 932.1 | 23338 |
| 24 | 371 | 7135 | 103 | 1975 | 3300 | 90183 | 913.3 | 24959 |
| 25 | 102 | 1876 | 183 | 3363 | 549 | 17922 | 984.2 | 32130 |
| 26 | 101 | 1639 | 158 | 2567 | 547 | 14707 | 856.6 | 23031 |
| 27 | 20 | 337 | 286 | 4811 | 78 | 1907 | 1114 | 27225 |
| 28 | 31 | 530 | 125 | 2138 | 204 | 5655 | 822.8 | 22807 |
| 29 | 36 | 634 | 179 | 3156 | 128 | 3587 | 637.2 | 17856 |
| 30 | 42 | 655 | 189 | 2941 | 224 | 6056 | 1006 | 27193 |
| Z | 1190 | 20969 | 187 | 3299 | 5814 | 168594 | 914.6 | 26521 |
Table 2 Correlation coefficient of chromosome size with total number and total length of perfect and imperfect SSRs
Tabla 2. Coeficiente de correlación del tamaño de los cromosomas con el número total y longitud de SSRs perfectos e imperfectos.
| Variable 1 | Variable 1 | Correlation coefficient | |
| Perfect SSR | Imperfect SSR | ||
| Total number of SSRs | Chromosome Size | 0.440 | 432 |
| P < | 0.013 | 0.010 | |
| Total length of SSRs | Chromosome Size | 0.475 | 0.441 |
| P < | 0.010 | 0.013 | |
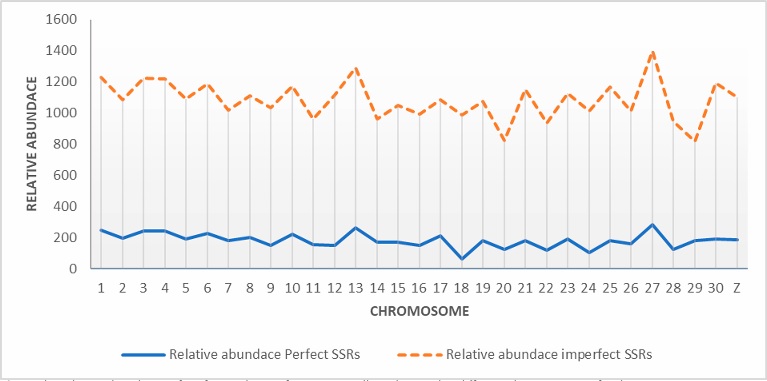
Table 1 also shows the total length of perfect SSRs with the highest value for chromosome 4, due to the large number of microsatellites detected. This was followed by chromosomes 8 and 1, respectively. Figure 2 illustrate the relative abundance of perfect microsatellites across all chromosomes. Chromosome 27 exhibited the highest relative abundance with a value of 285.5, followed by chromosome 13 at 262.4. In contrast, chromsome 18 showed the lowest relative abundance, primarily due to the low number of microsatellites detected on that chromosome. This was followed by chromosome 24 with a relative abundance of 102.68.
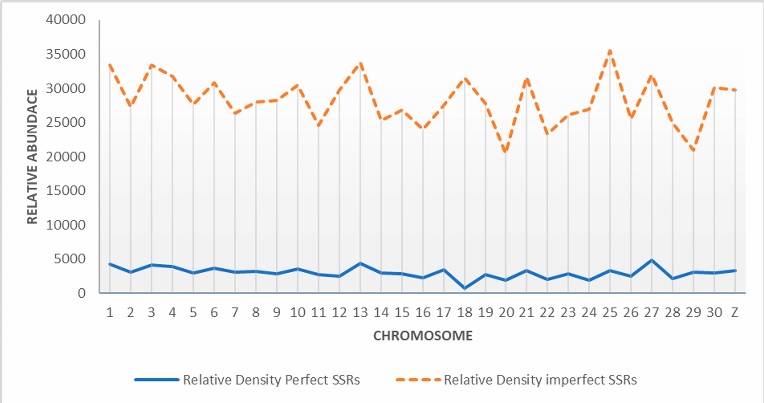
The estimated repeat density values (bp/Mb) in each chromosome are shown in Figure 3. The repeat density pattern closely mirrors the pattern of relative abundance, with chromosome 27 and 13 exhibiting the highest repeat densities. In contrast, chromosome 18 had the lowest repeat density.
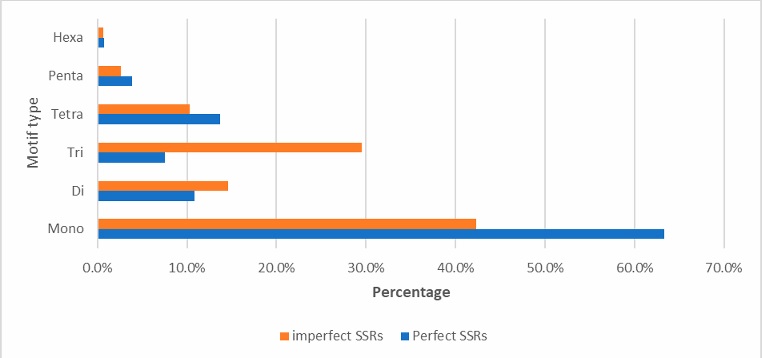
The overall distribution of SSR repeat types is presented in Figure 4, mononucleotide repeats were highly frequent, accounting for 63% of the total detected SRRs, followed by tetranucleotide repeats (14%), and dinucleotide (11%). Trinucleotide, pentanucleotide, and hexanucleotide repeats were less common, each making up less than 10% of the total. The number of imperfect microsatellite repeats detected per chromosome is presented in Table (3). Notably, only one mononucleotide microsatellite was detected in chromosome 18. Excluding chromosome 18, the highest number of mononucleotide microsatellite was detected in chromosomes 4, while the lowest was detected on chromosome 27. Chromosome 4 also had the highest dinucleotide, trinucleotide, tetranucleotide, pentanucleotide, and hexanucleotide repeats. In contrast, chromosomes 28, 29, and 27 had the lowest numbers of dinucleotide, trinucleotide, and tetranucleotide repeats, respectively.
Imperfect microsatellites.Table 1 presents the number of imperfect microsatellites detected across different chromosomes. The highest number (68202) was detected in chromosome 4 (Figure 2). The second highest counts were detected on chromosomes 8, 1, 15, and Z, respectively. On the other hand, chromosome 18 had the lowest count with only 15 imperfect microsatellites detected. These results have a similar trend to those obtained for perfect microsatellites.
Table 1 also presents the total length of imperfect SSRs with the highest value observed on chromosome 4, due to the large number of microsatellites detected. This was followed by chromosomes 8 and 1, respectively. Figure 2 depicts the relative abundance of imperfect microsatellites across all chromosomes. Chromosome 27 exhibited the highest relative abundance reaching 1,113.54, followed by chromosome 13 at 1,030.26. In contrast, chromosome 29 had the lowest relative density. Significant positive correlation coefficients were obtained between chromosome size and both total number (0.432) and total length (0.441) of imperfect microsatellites as shown in Table 2. Similar to perfect microsatellites, no imperfect microsatellites were obtained in chromosome W or in the mtDNA.
The estimated repeat density values (bp/Mb) of each chromosome are shown in Figure 3. The pattern of repeat density closely mirrors that of relative abundance, with chromosomes 27 and 13 exhibiting the highest repeat densities. In contrast, chromosome 18 had the lowest repeat density.
The overall distribution of the type of detected imperfect SSR repeats is presented in Figure 4. Mononucleotide repeats were the most frequent and accounting for 42 % of the total SSRs detected, followed by trinucleotide repeat (29 %), dinucleotide (15 %), and tetranucleotide (10 %). Pentanucleotide and hexanucleotide repeats were less frequent, each accounting for less than 5 %. The number of imperfect microsatellite repeats detected per chromosome is shown in Table 3. The highest numbers of mononucleotide microsatellites was detected on chromosomes 8, while the lowest was found on chromosome. Similar to the results obtained for perfect microsatellites, the highest numbers of dinucleotide, trinucleotide, tetranucleotide, pentanucleotide, and hexanucleotide repeats were observed in chromosome 4. However, chromosome 18 had the lowest numbers for dinucleotide, trinucleotide, and tetranucleotide repeats.
Tabla 3. Distribución de repetidos de microsatélites en los diferentes cromosomas del genoma del pavo.
| Motif | ||||||||||||||
| Perfect SSR | Imperfect SSR | |||||||||||||
| Chr | Mono | Di | Tri | Tetra | Penta | Hexa | Mono | Di | Tri | Tetra | Penta | Hexa | ||
| 1 | 2640 | 452 | 370 | 820 | 256 | 72 | 7776 | 2804 | 4995 | 2150 | 570 | 150 | ||
| 2 | 1444 | 225 | 161 | 233 | 63 | 5 | 3954 | 1428 | 3083 | 934 | 225 | 45 | ||
| 3 | 1249 | 233 | 185 | 380 | 133 | 36 | 3860 | 1361 | 2404 | 1048 | 302 | 86 | ||
| 4 | 10960 | 1707 | 1184 | 2252 | 555 | 85 | 31205 | 9709 | 18009 | 7148 | 1713 | 418 | ||
| 5 | 764 | 110 | 72 | 141 | 31 | 2 | 2173 | 759 | 1648 | 539 | 124 | 21 | ||
| 6 | 746 | 126 | 71 | 132 | 49 | 5 | 2159 | 745 | 1302 | 442 | 128 | 41 | ||
| 7 | 193 | 38 | 37 | 25 | 22 | 5 | 508 | 208 | 553 | 142 | 55 | 6 | ||
| 8 | 4661 | 731 | 498 | 833 | 182 | 22 | 13208 | 4551 | 9348 | 3094 | 680 | 158 | ||
| 9 | 101 | 22 | 18 | 26 | 16 | 1 | 299 | 152 | 512 | 102 | 35 | 3 | ||
| 10 | 425 | 65 | 43 | 88 | 19 | 2 | 1130 | 392 | 831 | 292 | 78 | 10 | ||
| 11 | 109 | 19 | 7 | 31 | 7 | 4 | 341 | 129 | 339 | 94 | 25 | 6 | ||
| 12 | 93 | 28 | 18 | 20 | 13 | 2 | 279 | 169 | 553 | 74 | 51 | 8 | ||
| 13 | 155 | 24 | 22 | 34 | 12 | 2 | 445 | 116 | 270 | 116 | 23 | 6 | ||
| 14 | 90 | 15 | 19 | 27 | 10 | 3 | 237 | 116 | 284 | 79 | 27 | 12 | ||
| 15 | 1926 | 315 | 242 | 355 | 118 | 24 | 5526 | 2172 | 5476 | 1429 | 365 | 87 | ||
| 16 | 157 | 23 | 18 | 20 | 6 | 1 | 492 | 168 | 435 | 119 | 29 | 4 | ||
| 17 | 108 | 33 | 16 | 25 | 8 | 0 | 277 | 143 | 279 | 71 | 19 | 3 | ||
| 18 | 1 | 0 | 0 | 0 | 0 | 0 | 4 | 0 | 8 | 2 | 1 | 0 | ||
| 19 | 64 | 6 | 7 | 8 | 4 | 0 | 177 | 67 | 148 | 41 | 13 | 2 | ||
| 20 | 41 | 8 | 6 | 9 | 1 | 1 | 107 | 71 | 139 | 44 | 7 | 2 | ||
| 21 | 45 | 8 | 13 | 14 | 4 | 2 | 126 | 61 | 215 | 45 | 21 | 2 | ||
| 22 | 47 | 15 | 3 | 10 | 4 | 2 | 119 | 100 | 265 | 45 | 13 | 3 | ||
| 23 | 93 | 15 | 7 | 12 | 1 | 0 | 261 | 90 | 208 | 51 | 9 | 0 | ||
| 24 | 17 | 197 | 64 | 57 | 28 | 8 | 1130 | 452 | 1304 | 297 | 94 | 23 | ||
| 25 | 43 | 9 | 17 | 17 | 13 | 3 | 139 | 76 | 242 | 48 | 32 | 12 | ||
| 26 | 63 | 15 | 9 | 11 | 3 | 0 | 174 | 93 | 206 | 52 | 17 | 5 | ||
| 27 | 4 | 9 | 4 | 2 | 1 | 0 | 15 | 23 | 30 | 6 | 4 | 0 | ||
| 28 | 17 | 4 | 3 | 4 | 2 | 1 | 48 | 34 | 95 | 19 | 7 | 1 | ||
| 29 | 22 | 5 | 1 | 7 | 1 | 0 | 46 | 23 | 38 | 19 | 2 | 0 | ||
| 30 | 27 | 4 | 4 | 6 | 1 | 0 | 96 | 31 | 62 | 27 | 8 | 0 | ||
| Z | 607 | 137 | 101 | 236 | 97 | 12 | 2314 | 905 | 1670 | 676 | 201 | 48 | ||
Designed Primers. A total of 121248 SSR primers were designed. A list of these primers has been deposited in a public repository and can be accessed via the following link: (https://github.com/mosthamed/SSR-primers-Meleagris-gallopavo-.git).
Discussion
Genome-wide studies offer valuable insights into the evolutionary forces that shape the distribution and diversity of microsatellites (Pannebakker et al., 2010), enhancing our understanding of genome architecture. Microsatellites are a significant component of the genome in all organisms, which their abundance closely correlating to genome size (Akemi et al., 2012). However, the biological significance of this genomic regions remains poorly understood . A thorough analysis of microsatellites is essential for uncovering their functional roles (Gochi et al., 2023). Variations in their abundance, variation and repeat types are key factors that contribute to their functions. This study presents a genome-wide analysis of microsatellite distribution in the turkey genome.
Compared to traditional methods of microsatellite identification, in silico genome mining offers several advantages, making it a preferred approach in modern genomics research. The in silico approach is highly efficient and cost-effective, allowing for large genomes to be scanned for potential microsatellite regions without the need for extensive wet lab experiments. By leveraging computational tools and databases, vast amounts of data can be generated quickly. This approach is particularly valuable in fields such as biodiversity studies, conservation genetics, and breeding programs. Additionally, the precision of computational algorithms ensures high accuracy in marker identification, reducing the risk of errors that can occur with manual methods (Safaa et al., 2023).
In the current study, we examined the distribution of perfect microsatellites across different chromosomes. The data revealed no correlation between the number of perfect SSRs and chromosome size. Notably, chromosome 4, which ranks fifth in size in the turkey genome, has the highest number of perfect microsatellites. Chromosomes 8, 1, 15, and Z also showed high numbers of SSRs. Similarly, chromosome 4 also exhibited the highest number of imperfect microsatellites. Previous studies (Zhao et al., 2011; Duhan et al., 2023) have generally found that microsatellite density increases with genome size.
To better understand this trend, we calculated the correlation coefficients between chromosome size and both the total number and total length of detected microsatellites for the two types. Moderate positive correlations were observed, suggesting that the abundance of SSRs can vary widely across animal species, of which mammals tend to have more SSRs than avian species due to the differences in chromosome size. However, further studies should investigate the relationships between the number of chromosomes and the SSR number.
Previous research has reported different levels of correlations between genome size and the number of detected SSRs. For example in insects, the number of SSRs is positively correlated with genome size, with a correlation coefficient of 0.499, similar to our findings. However, the correlation between SSR density and genome size in insects was negative at −0.228 (Ding et al., 2017). In contrast, bovid species show a very high positive correlation (0.980) between SSR number and chromosome size (Qi et al., 2015). Similarly, in macaque species, the correlation between chromosome size and SSR number was positive, while the correlation with SSR density was negative (Liu et al., 2017).
In most vertebrates, mono- and di-nucleotide motifs are the most abundant microsatellite motifs (Zhao et al., 2011; Wattanadilokchatkun et al., 2022; Kumpatla and Mukhopadhyay, 2005). In the present study, mono-nucleotide motifs were the most prevalent for both perfect and imperfect SSRs. However, the di-nucleotide motifs ranked 3rd, following tetranucleotide and trinucleotide motifs for perfect and imperfect SSRs, respectively. In ducks, dinucleotide motifs were found to be the most abundant, accounting for over 50% of the total SSR motifs.
This finding contradicts the previously observed positive relationship between microsatellite density and genome size. The results of the current study suggest that the factors influencing microsatellite distribution may be more complex than a simple linear correlation with genome size. Further research is required to fully elucidate the evolutionary processes shaping microsatellite characteristics in avian species and across boarder range of taxa.
Conclusions
In the current study, we conducted a genome-wide analysis of the distribution and density of microsatellites in the turkey genome. While the findings provides a foundation for future studies into the role of microsatellites in gene regulation, further investigation is needed to understand how these SSRs are distributed across different regions of the genome, including both coding and non-coding areas. A large set of SSR markers was identified across the entire genome, which will be instrumental for linkage mapping and will significantly improve research in turkey genetics. This extensive characterization of SSR markers not only enhances our understanding of turkey genetics but also creates a foundation for further investigations into their functional role in genomic regulation.

