


 nueva página del texto (beta)
 Inglés (pdf)
 Artículo en XML
 Referencias del artículo
 Enviar artículo por email
 Citado por SciELO
  Similares en
SciELO
Similares en
SciELO 
 Permalink
Introduction
Color is considered one of the main attributes of food appearance since it is often related to product quality and acceptability (Sharma et al., 2011). Usually, artificial colors are used in the food industry; however, they have been related to potential adverse effects on human health (Amchova et al., 2015). Therefore, natural pigments are a good option. Betalains are nitrogenous, water-soluble pigments classified into two groups: betacyanins (red-violet color) and betaxanthins (yellow-orange color). They can be found in several plant tissues, roots, and fruits. Pitaya (Stenocereus stellatus) is found naturally in a variety of colors, being red and orange a promising source of betalains and its juice can be used as a food additive without imparting flavor and simultaneously covering an extensive color spectrum (Hussain et al., 2018). Moreover, betalains have been reported to have therapeutic applications such as antimicrobial, antimalarial, anti-lipidemic and as anti-cancer (Gengatharan et al., 2015).
Despite their benefits, the stability of betalains is affected by environmental factors such as heat, pH (> 6), and light exposure. Thus, establishing novel preservation methods to achieve stability could offer some advantages. To achieve this, encapsulation techniques have been applied owing to their low cost, simplicity, and efficient preservation of bioactive compounds (Fang and Bhandari, 2010; Krishnaiah et al., 2014). Spray drying is a widely employed technique for encapsulation due to its ease to process a variety of materials at a low cost (Borrmann et al., 2013). However, the drying temperature could lead to thermal degradation of functional compounds; hence, it is important to use carrier agents that can minimize the loss and preserve the functionality of these components.
A carrier agent is selected considering its possible interactions with the components of interest, increasing the retention of functional compounds, and physical properties of the encapsulates (e.g., smooth and non-damaged surfaces) or the ability to prevent adhesion to the chamber walls (Shishir and Chen, 2017). Several studies report the use of new polymers and their combinations with wall materials to increase compound retention (de Barros Fernandes et al., 2014; Premi and Sharma, 2017; Mahdi et al., 2020). For example, Lacerda et al. (2016) for the encapsulation of jussara (Euterpe edulis) pulp, used different proportions of sodium octenyl succinate starch (OSA starch), inulin, and maltodextrin. They reported that a higher proportion of OSA starch improved the anthocyanin content and antioxidant activity of the encapsulates. Furthermore, do Carmo et al. (2018) used maltodextrin, inulin, and whey protein isolate for beetroot extract encapsulation; a mixture of inulin and whey protein isolate resulted in improved stability of the encapsulated beetroot extract, where the presence of carrier agents modifies the balance of hydrophilic/hydrophobic sites, resulting in substantial changes in water absorption related to stability parameters.
The combination of complex carbohydrates (such as inulin or modified starch) with protein, may favor compound retention due to the possible chemical or physical interactions. Among these interactions are electrostatic or hydrogen bonding, which may occur between betalains and polymers; it is promoted by the cationic nature of the betalains (Cai and Corke, 2000). Moreover, several studies reported proteins as a good choice of wall material, especially for microencapsulation by spray-drying, because they can form thermally stable gels above 70 °C and thus minimize the degradation of bioactive compounds (Bartkowiak et al., 2017). Despite this advantage, carrier agent proportion in the mixture may affect properties such as color, hygroscopicity, and solubility, which are important to product stability. Optimizing the proportions of carrier agents in the mixture could minimize the pigments and other functional bio-compounds degradation, simultaneously rendering beneficial physical properties, and obtaining high-quality encapsulates. Accordingly, this study aimed to optimize a mixture with different proportions of agave fructans (FRU), octenyl succinate starch (OSA starch), and whey protein concentrate (WPC), as carrier agents on the physicochemical properties of the pitaya fruit juice encapsulated by spray drying.
Material and methods
Chemicals
Folin-Ciocalteu phenol reagent, 2,2-diphenyl-1-picrylhydrazyl (DPPH•), 6-hidroxy-2,5,7,8-tetramethylchroman-2-carboxylic acid (Trolox), sodium carbonate, gallic acid, quercetin, kaempferol, and isorhamnetin standards were purchased from Sigma-Aldrich (St. Louis, MO, USA). High-performance liquid chromatography (HPLC)-grade methanol, methanol and hydrochloric acid (analytical grade) were obtained from J. T. Baker (Mexico City, Mexico). Deionized water from a Barnstead deionizer (Thermo Scientific, Dubuque, IA, USA) was obtained. FRU (Agaven®, Guadalajara, Mexico), OSA starch (Ingredion®, Queretaro, Mexico), and WPC (WPC 80 INST, America Alimentos, Guadalajara, Mexico) were used as carrier agents.
Pitaya juice obtaining
Red and orange pitaya (S. stellatus) fruits were collected from Sinaloa state, Mexico. Pitaya fruits were washed and processed using an industrial juice extractor. Seeds and mucilage were removed by centrifugation for 10 min at 3600 × g (Centra CL3R IEC; Thermo Electron Corporation, Waltham, MA, USA). The resulting juice was a mixture of red (54%) and orange (46 %) pitayas. Then, the juice was stored at - 20 °C until further analysis. The total soluble solids (ºBrix) were measured with a refractometer (Atago Co. Ltd., Tokyo, Japan), pH using a pH meter (Hanna Instruments, model EDGE HI2020, Woonsocket, RI, USA), color parameters, antioxidant activity, total polyphenols, quercetin, kaempferol, isorhamnetin, betacyanins, and total betalain were analyzed as describes below.
Preparation and encapsulation of pitaya juice by spray drying
Pitaya juice was mixed with different proportions of carrier agents, according to the mixture design (Table 1), each mixture was adjusted to 22.5 % of total solids (w/v). Carrier agents were added individually following the same order in each treatment, then stirred by magnetic agitation for 10 min and homogenized (Ultra-Turrax IKA T18 basic with a dispersing tool S18N-19G; IKA Works Inc., Wilmington, NC, USA) for 15 min. Spray drying was performed using a pilot plant spray dryer (Niro Mobile Minor DK-2860; GEA Company, Kirchberg, Switzerland) with a rotary atomizer at an air pressure of 0.7 bar. Mixtures of 600 mL were fed using a peristaltic pump (Watson Marlow 504-U; Falmouth, Cornwall, UK) and dried at inlet and outlet temperatures of 160 and 85 °C, respectively. The encapsulates from the outlet were stored in hermetically closed glass jars for the subsequent analysis of physical and chemical properties.
Tabla 1. Proporciones de los agentes acarreadores en las mezclas * de acuerdo al diseño de mezclas D-óptimo.
| Mixture | Coded values | Uncoded values (carrier agent proportions) | ||||
| X1 | X2 | X3 | Fructans (%) | Whey protein (%) | OSA starch (%) | |
| 1 | 0.500 | 0.397 | 0.103 | 50.0 | 39.7 | 10.3 |
| 2 | 0.000 | 0.100 | 0.900 | 0.0 | 10.0 | 90.0 |
| 3 | 0.000 | 0.500 | 0.500 | 0.0 | 50.0 | 50.0 |
| 4 | 0.436 | 0.100 | 0.464 | 43.6 | 10.0 | 46.4 |
| 5 | 0.000 | 0.900 | 0.100 | 0.0 | 90.0 | 10.0 |
| 6 | 0.247 | 0.653 | 0.100 | 24.7 | 65.3 | 10.0 |
| 7 | 0.157 | 0.224 | 0.619 | 15.7 | 22.4 | 61.9 |
| 8 | 0.330 | 0.684 | 0.283 | 3.3 | 68.4 | 28.3 |
| 9 | 0.275 | 0.378 | 0.347 | 27.5 | 37.8 | 34.7 |
| 10 | 0.493 | 0.232 | 0.275 | 49.3 | 23.2 | 27.5 |
| 11 | 0.000 | 0.249 | 0.751 | 0.0 | 24.9 | 75.1 |
| 12 | 0.247 | 0.653 | 0.100 | 24.7 | 65.3 | 10.0 |
| 13 | 0.000 | 0.900 | 0.100 | 0.0 | 90.0 | 10.0 |
| 14 | 0.000 | 0.100 | 0.900 | 0.0 | 10.0 | 90.0 |
| 15 | 0.500 | 0.397 | 0.103 | 50.0 | 39.7 | 10.3 |
| 16 | 0.436 | 0.100 | 0.464 | 43.6 | 10.0 | 46.4 |
* Each mixture was prepared based on 22.5% (w/v) solids content.
Characterization of pitaya encapsulates Physical properties Moisture content
The moisture content of the encapsulates was determined by the gravimetric 950.02 method (AOAC, 1998). Known amounts of samples were dried using a vacuum dryer (Precision Vacuum Oven; Precision Scientific, Inc., IL, USA) at 70 °C for 24 h, followed by cooling at 25 ºC in desiccators. After that, samples were weighted. Analysis was carried out in triplicates and the means were reported as g of water/100 g of samples.
Water activity (aw)
The aw was determined using a Novasina Labmaster-aw (Axair AG, Pfäffikon SZ, Switzerland). Salt solutions at 25 °C were used to calibrate the equipment. Measurements were carried out in triplicates.
Bulk density (BD)
BD was determined for the encapsulates and carrier agents as described by Mahdi et al. (2020). A 2 g sample was deposited in a 10 mL empty graduated cylinder that was slightly tapped. BD was calculated as the mass ratio into the cylinder to the volume occupied. Measurements were performed in triplicates and the results are expressed as g/mL.
Water absorption index (WAI) and water solubility index (WSI)
WAI and WSI were determined following the method described by Anderson et al. (1970) with some modifications. A sample of encapsulates (1.25 g) was added to 15 mL of deionized water and vortexed (Vortex-1; Scientific Industries Inc. Bohemia, New York, USA) and the mixture was incubated at 37 °C for 30 min in a water bath. Then, the mixture was centrifuged for 10 min at 3600 × g in a Centra CL3R centrifuge. The supernatant was carefully collected into pre-weighed porcelain capsules and dried in an oven at 70 °C for 36 h. WAI was calculated by subtracting the weight of the sediment (determined after the removal of the supernatant) from the weight of the sample. WSI was calculated by dividing the weight of the dried supernatant by the weight of the sample. These analyses were carried out in triplicate.
Hygroscopicity (HYG)
Hygroscopicity was determined according to Lacerda et al. (2016). The encapsulates (500 mg) were stored in a desiccator containing a saturated NaCl solution (75.0 % relative humidity) at room temperature for seven days. After that, they were weighed and the hygroscopicity was expressed as a weight percent. Measurements were carried out in triplicates.
Glass transition temperature (Tg)
A differential scanning calorimeter (TA Q-200; TA Instruments, Crawley, UK) was used to determine the Tg of the encapsulates following the method of Puerta-Gomez and Castell-Perez (2015) with some modifications. The sample was placed in a closed aluminum pan and an empty pan was used as a reference. The scans were conducted under an argon atmosphere from 0 °C to 120 °C with a temperature gradient of 10 °C/min, followed by cooling to -30 °C. Measurements were carried out in duplicates and the thermograms were analyzed using the Universal Analysis Software (TA Instruments). Tg is interpreted as the midpoint of the obtained curves.
Color parameters
The color parameters were obtained for the pitaya juice and the different mixtures of juice with carrier agents before spray drying, and the resuspended encapsulates in water; adjusted at 22.5 % of total solids (w/v), to have the same solid content before spray-drying process. These were measured following the method of Lacerda et al. (2016) with some modifications using a Konica Minolta CR-400/410 colorimeter (Minolta Co., Osaka, Japan), previously calibrated with a tile standard. The L* (luminosity), a* (greenness-redness), and b* (blueness-yellowness) values were registered. Measurements were carried out in triplicates and these values were further used to calculate the total color difference (ΔE) using the following equation:
where L 0 *, a 0 *, and b 0 * are the color coordinates of the juice and carrier agent mixture before spray drying, and L 1 *, a 1 *, and b 1 * are the color of the resuspended encapsulates.
Powder morphology
The morphological properties of the powder were investigated by scanning electron microscopy (SEM) at 1000 × (JSM-5800 LV; JEOL, Tokyo, Japan). The encapsulates of each mixture were placed on SEM stubs using two-sided adhesive tape and the samples were observed under low vacuum at 10 kV.
Yield of encapsulation (YE)
The YE for the spray drying was obtained according to Madhi et al. (2020), by the ratio between the total mass of the recovered encapsulates, and the mixture initially fed into the system. It was expressed as a percentage and was obtained using equation 2.
Chemical properties Extract preparation
Extracts for total polyphenol content (TPC) and antioxidant activity (AA) quantification, were prepared according to Vergara et al. (2014) with some modifications. Pitaya encapsulates (500 mg) were dispersed in 10 mL of methanol: acetic acid: water (50:8:42 v/v/v) and then stirred by vortexing for 1 min, sonicated (Branson 1800, 40 KHz; Danbury, CT, USA) twice for 20 min, and centrifuged at 3000 × g for 5 min in a Centra CL3R centrifuge. Supernatants were filtered through a syringe filter with a 0.45 µm nylon membrane and stored at -20 ºC for further analysis.
Total polyphenol content (TPC)
TPC was determined for both pitaya juice and encapsulated extracts following the Folin-Ciocalteu method described by Tabio-García et al. (2021). Measurements were carried out in triplicate and the absorbance was determined at 765 nm. A standard calibration curve was prepared using gallic acid (400 - 1400 mg of gallic acid equivalent (GAE/L). The results are expressed as mg GAE/100 g of sample.
Antioxidant activity (AA)
AA was determined for both pitaya juice and encapsulated extracts following the free radical method described by Brand-Williams et al. (1995), with some modifications. The reaction of 0.1 mL of each extract and 3.9 mL of DPPH• (100 µM) was carried out and after 3 h in darkness; the absorbance was measured at 517 nm. Measurements were carried out in triplicates. A Trolox calibration curve (0.1-1.2 mM of Trolox equivalent (TE) was prepared and the results are expressed as µmol TE/g of sample.
Flavonoid quantification
Flavonoid quantification was performed following the method described by Kuti (2004), for both pitaya juice and encapsulated extracts, with some modifications. Juice and extracts from the encapsulates were subjected to hydrolysis using 1 N hydrochloric acid solution in 50 % methanol to obtain flavonoid aglycones, which were quantified at 370 nm using a Thermo Scientific Dionex Ultimate 3000 UHPLC equipped with a diode array and UV-visible detector (Thermo Scientific Dionex, Sunnyvale, CA, USA). The separation was performed using a reverse-phase nucleosil column (Thermo Scientific Dionex C18, 5 μm, 150 × 4.6 mm). For the separation an isocratic gradient was used; the mobile phases were water acidified with phosphoric acid at pH 2.4 (A) and 100 % methanol (B) with a proportion of 65:35 (A:B), at a flow rate of 1 mL/min, and an injection volume of 20 μL. The flavonoids were identified according to their retention times. For quantification, standards HPLC grade of quercetin, kaempferol and isorhamnetin were used to perform calibration curves. The results of quercetin, kaempferol, or isorhamnetin are reported as mg/100 g of sample.
Betalains extraction
For the extraction of betalains, the method proposed by Castellano-Santiago and Yahia (2008) was followed. Briefly, 500 mg of encapsulates were dispersed in 10 mL of deionized water by vortexing for 1 min. Then, the sample was sonicated for 20 min and centrifuged at 3000 × g for 5 min in a Centra centrifuge (CL3R IEC; Thermo Electron Corporation). The supernatant was filtered through a 0.45 μm nylon filter (Millipore Corp. Burlington, Massachusetts, USA) and stored at -20 °C for subsequent analysis.
Betalain quantification
Photometric quantification of total betalains for both pitaya and encapsulated juice extracts was performed according to the method described by Cai et al. (1998). Betacyanin content (BC) and betaxanthin content (BX) were calculated using the following equation:
where A is the absorbace for betacyanins and betaxanthins of pitaya juice or encapsulated extract at 535 and 483 nm, which are their maximum wavelengths, respectively. DF is the dilution factor, Vd is the extract volume (mL), Wd is the encapsulates weight (g), and L is the cell path length (1 cm). Betanin (Mw = 550 g/mol; ε = 60000 L/[mol·cm] and indicaxanthin I (Mw = 308 g/mol; ε = 48000 L/[mol·cm] were used for betacyanins and betaxanthins quantification, respectively. Measurements were obtained in a Lambda 25 UV-Vis spectrophotometer (Perkin Elmer, Waltham, MA. USA) in triplicate, and the results were expressed as total betalain content (TBC) in mg/g of sample, which represents the sum of BC and BX content.
Experimental design
This study was carried out under a D-optimal mixture design with the following factors: FRU (X 1 ), WPC (X 2 ), and OSA starch (X 3 ). Component proportions were expressed as fractions of the mixture with a sum (X 1 +X 2 +X 3 ) of 100. Preliminary tests were conducted to establish the proportions for each component resulting in the following restrictions: 0≥X 1 ≤50, 10≥X 2 ≤90, and 10≥X 3 ≤90. Table 1 shows the factors and proportions of the encapsulating agents. The resulting design had 16 runs (six model points, five points for the lack of fit, and five randomly selected replicates). Moreover, three additional treatments with each carrier agent were used as controls. The responses were analyzed using a polynomial Scheffé model. The fitted equation is as follows:
where Y is the estimated response; X 1 , X 2 , and X 3 correspond to the linear mixture components, while X 1 X 2 , X 1 X 3 , and X 1 X 2 X 3 correspond to the binary and ternary mixture components, respectively; β 1 , β 2 , β 3 , β 12 , β 13 , β 23 , and β 123 are the estimated coefficients.
Statistical analysis
The Design-Expert 12 (Stat-Ease Inc., Minneapolis, USA) software was used to fit the model to the experimental data and create contour plots. The data was analyzed by analysis of variance and non-linear regression. Additionally, a Pearson correlation analysis was applied to evaluate the response correlation. Also, a posthoc group analysis was performed to evaluate the sensitivity of the proportions of the carrier agents in the mixtures (FRU, WPC and OSA starch), through a mean analysis among groups (mixtures with duplicates of the experimental design) by Tukey test. The significance of differences was specified at p ≤ 0.05 using the statistical software Minitab version 16 (Minitab, 2010, State Collage, PA).
Results and discussion
Physicochemical characterization of pitaya juice
The physicochemical properties of pitaya juice showed 54 % red and 46 % orange (Table 2). A high polyphenol content (679.25 mg of GAE/100 g dry basis (d.b.)) was compared to those obtained by Kim et al. (2011) (491 mg GAE/ 100 g d.b.) and by Pérez-Loredo et al. (2016) (372 to 579 mg GAE/100 g d.b.), who evaluated pitaya of different colors. Furthermore, the antioxidant activity of pitaya juice (139.98 µmol TE/g d.b.) was higher than that reported for different pitaya fruits (Pérez-Loredo et al., 2016). Regarding BC, the juice had 0.35 and 1.31 mg/g d.b. of BC and BX, respectively. For the same pitaya variety, Pérez-Loredo et al. (2016) reported 1.46 mg BC/g d.b. and 1.51 mg BX/g d.b. This BC value was higher than ours result, because it was referred to only red pitaya. The high BX content in the juice used in our study, also is observed in the color parameter b* obtained in the juice (Table 2), indicating a good coloration (orange-yellow) provided by a high BX content of the juice used. García-Cruz et al. (2013) reported high BX content (2.67 mg/g d.b.) and similar in BC 0.470 mg/g d.b. The differences between these results may be due to the fruit maturity or the extraction process, as in the aforementioned studies, the flesh and seeds were included in the extraction, while in this study only the juice was used. The reported values were similar for cactus pear (1.71 mg BC/g d.b. and 0.68 mg BX/g d.b.) (Ruiz-Gutiérrez et al., 2014). The flavonoids isorhamnetin, quercetin and kaempferol were identified and quantified; with 1.12 mg/100 g d.b., 1.07 mg/100 g d.b. and 2.36 mg/100 g d.b., respectively. Quercetin and kaempferol contents were higher than those reported (0.709 and 0.350 mg/100 g d.b.) by García-Cruz et al. (2017), while isorhamnetin was not detected.
Tabla 2. Propiedades fisicoquímicas del jugo de pitaya (Stenocereus stellatus).
| Determination | Juice |
| Total soluble solids (°Bx) | 12.2 ± 0.0001 |
| pH | 4.7 ± 0.0001 |
| Moisture content (%) | 86.76 ± 0.09 |
| Betacyanins (mg BC/g d.b.) | 0.35 ± 0.03 |
| Betaxanthins (mg BX/g d.b.) | 1.31 ± 0.06 |
| Total polyphenols (mg GAE/100 g d.b.) | 679.25 ± 13.47 |
| Antioxidant activity (µmol TE/100 g d.b.) | 139.98 ± 5.20 |
| Isorhamnetin (mg/100 g d.b.) | 1.12 ± 0.03 |
| Quercetin (mg/100 g d.b.) | 1.07 ± 0.026 |
| Kaempferol (mg/100 g d.b.) | 2.36 ± 0.025 |
| Color parameters | |
| L* | 37.34 ± 0.49 |
| a* | 42.53 ± 0.56 |
| b* | 18.21 ± 0.52 |
Mean ± standard deviation. BC: betacyanins; BX: betaxanthins; GAE: gallic acid equivalent; TE: trolox equivalent; d.b.: dry basis.
Characterization of pitaya encapsulates Moisture content
The moisture content of the pitaya encapsulates was significantly (p < 0.05) affected by the carrier agents in their linear effect (Table 4). The moisture content ranged from 0.7 % to 2.8 % (Table 3), corresponding to low and high FRU proportions, showing a greater significance due to its high hygroscopicity, that led to encapsulates with high moisture content. It is attributed to the affinity of the hygroscopic groups (OH-) of the FRU for water. Similar findings were reported by de Barros Fernandes et al. (2014) and Sánchez-Madrigal et al. (2019). In contrast, higher OSA starch proportions reduced the humidity of the encapsulates. This behavior was also reported by Mehran et al. (2020) and Souza et al. (2018), and was attributed to starch modification, which reduces the water absorption capacity and improves the product stability, making this type of material suitable for encapsulation (Puerta-Gomez and Castell-Perez, 2015).
Table 3 Physicochemical properties of pitaya (Stenocereus stellatus) encapsulates with different proportions of fructans, whey protein, and OSA starch, as carrier agents.
Tabla 3. Propiedades fisicoquímicas de los encapsulados de pitaya (Stenocereus stellatus) con diferentes proporciones de fructanos, proteína de suero y almidón OSA como agentes acarreadores.
| MIXTURE | Groups | H | a w | BD | HYG | WSI | WAI | YE | Tg | L* | a* | b* | ∆E | TBC | TPC | AA | I | Q | K |
| 1 | 1 | 2.70a | 0.054a | 0.560abc | 31.64a | 1.445a | 0.265a | 44.44c | 38.53bc | 34.04bc | 29.82a | 15.37b | 5.36a | 1.669c | 1862.0bc | 12.28a | 0.376a | 0.251a | 0.366a |
| 2 | 2 | 1.00b | 0.055a | 0.677a | 31.61a | 0.997b | 0.234a | 54.81b | 36.21c | 30.57c | 33.50a | 10.91c | 1.70b | 1.371cd | 934.3d | 8.78a | 0.356a | 0.275a | 0.314a |
| 3 | 1.20 | 0.047 | 0.627 | 30.89 | 0.969 | 0.387 | 64.44 | 38.79 | 32.81 | 32.64 | 13.25 | 3.91 | 1.817 | 2003.5 | 12.62 | 0.409 | 0.282 | 0.330 | |
| 4 | 3 | 1.80ab | 0.048a | 0.648ab | 32.98a | 0.982b | 0.389a | 51.11a | 40.72ab | 31.46bc | 32.95a | 10.44bc | 2.37b | 1.183d | 1117.1cd | 9.92a | 0.329a | 0.303a | 0.316a |
| 5 | 4 | 1.30b | 0.047a | 0.517c | 30.29a | 0.951b | 0.390a | 60.74ab | 40.35ab | 38.12a | 29.59a | 21.27a | 5.86a | 2.278a | 2351.7a | 11.92a | 0.375a | 0.265a | 0.330a |
| 6 | 5 | 1.40b | 0.048a | 0.538bc | 32.01a | 0.945b | 0.381a | 57.77b | 40.33a | 34.64ab | 31.15a | 18.64a | 7.07a | 1.980b | 2379.0ab | 13.23a | 0.379a | 0.286a | 0.323a |
| 7 | 0.70 | 0.050 | 0.668 | 31.72 | 0.682 | 0.342 | 57.77 | 41.26 | 33.00 | 28.78 | 14.39 | 6.99 | 1.361 | 1384.7 | 10.39 | 0.388 | 0.253 | 0.340 | |
| 8 | 2.60 | 0.051 | 0.529 | 30.50 | 0.948 | 0.321 | 60.74 | 41.69 | 37.37 | 28.90 | 20.88 | 6.73 | 1.873 | 2399.9 | 12.69 | 0.390 | 0.242 | 0.335 | |
| 9 | 2.40 | 0.054 | 0.627 | 31.28 | 0.951 | 0.532 | 56.29 | 34.58 | 35.21 | 28.27 | 17.43 | 7.11 | 1.537 | 1714.5 | 9.83 | 0.374 | 0.242 | 0.340 | |
| 10 | 2.50 | 0.058 | 0.590 | 31.57 | 0.940 | 0.575 | 42.96 | 34.74 | 33.94 | 29.17 | 15.58 | 7.29 | 1.276 | 1342.8 | 9.35 | 0.361 | 0.261 | 0.303 | |
| 11 | 1.80 | 0.051 | 0.668 | 30.35 | 0.923 | 0.422 | 60.74 | 42.69 | 34.15 | 29.56 | 16.01 | 5.63 | 1.418 | 1393.7 | 9.75 | 0.337 | 0.247 | 0.303 | |
| 12 | 5 | 1.51b | 0.094a | 0.568bc | 30.93a | 0.971b | 0.344a | 55.55b | 41.53a | 37.41ab | 27.75a | 20.35a | 8.37a | 2.029b | 2138.6ab | 14.30a | 0.345a | 0.263a | 0.320a |
| 13 | 4 | 1.51b | 0.078a | 0.501c | 28.54a | 0.954b | 0.517a | 64.44ab | 40.41ab | 38.40a | 30.34a | 21.70a | 5.96a | 2.558a | 2677.7a | 15.13a | 0.367a | 0.241a | 0.324a |
| 14 | 2 | 1.60b | 0.087a | 0.668a | 30.08a | 0.990b | 0.439a | 55.55b | 37.14c | 30.74c | 31.69a | 10.50c | 2.56b | 1.359cd | 1091.3d | 7.27a | 0.342a | 0.274a | 0.308a |
| 15 | 1 | 2.80a | 0.065a | 0.626abc | 31.27a | 1.533a | 0.374a | 42.22c | 37.03bc | 33.95bc | 31.34a | 15.23b | 5.68a | 1.543c | 1594.9bc | 10.17a | 0.367a | 0.265a | 0.333a |
| 16 | 3 | 2.40ab | 0.060a | 0.627ab | 30.70a | 0.981b | 0.367a | 52.59a | 40.26ab | 32.96bc | 34.10a | 12.84bc | 1.59b | 1.224d | 1250.0cd | 8.35a | 0.328a | 0.266a | 0.318a |
Groups: 1 (mixtures 1 and15), 2 (mixtures 2 and 14), 3 (mixtures 4 and 16), 4 (mixtures 5 and 13) and 5 (mixtures 6 and 12). Groups with different letters present significant difference (p < 0.05) by Tukey`s test (posthoc). H: moisture content (%); aw: water activity; BD: bulk density (g/mL); HYG: hygroscopicity (%); WSI: water solubility index; WAI: water absorption index; YE: yield of encapsulation; Tg: glass transition temperature (ºC); TPC: total polyphenol content (mg GAE/100 g); AA: antioxidant activity (µmol TE/g); TBC: total betalain content (mg/g); I: Isorhamnetin (mg/100 g); Q: Quercetin (mg/100 g); K: Kaempferol (mg/100 g); GAE: gallic acid equivalent; TE: trolox equivalent; L*, a* and b* color parameters correspond to resuspended encapsulates.
Table 4 Regression coefficients and correlation of the adjusted model to the experimental data, in the D-optimal mixture design for the physicochemical properties and color parameters of pitaya (Stenocereus stellatus) encapsulates.
Tabla 4. Coeficientes de regresión y correlación del modelo ajustado a los datos experimentales en el diseño de mezclas D-óptimo para las propiedades fisicoquímicas y parámetros de color de los encapsulados de pitaya (Stenocereus stellatus).
| Variable | Linear terms | Non-linear terms | Model | ||||||
| β1 | β2 | β3 | β12 | β13 | β23 | β123 | R2 | p-value | |
| Physical properties | |||||||||
| BD | 0.511* | 0.463* | 0.687* | 0.316 | 0.156 | 0.158 | -0.182 | 0.889 | 0.007* |
| WSI | 3.34* | 0.934* | 0.973* | -1.95 | -4.25* | 0.068 | -5.77 | 0.832 | 0.004* |
| WAI | 0.949 | 0.481 | 0.356 | -2.30 | -1.74 | -0.249 | 10.67 | 0.418 | 0.442 |
| H | 9.32* | 1.37* | 0.972* | -12.1 | -13.6 | 2.43 | 22.36 | 0.615 | 0.116 |
| aw | -0.196 | 13.74 | 7.92 | 26.83 | 22.53 | 2.15 | -75.95 | 0.267 | 0.763 |
| HYG | 25.66* | 28.99* | 30.58* | 18.10 | 15.87 | 3.51 | -26.92 | 0.568 | 0.172 |
| YE | -14.6* | 60.1* | 51.9* | 89.04* | 134.3* | 30.61* | -227.3* | 0.963 | < 0.0001* |
| Tg | 9.84 | 39.01 | 35.89 | 75.56* | 94.76* | 16.62 | -360.8* | 0.675 | 0.061 |
| Color parameters | |||||||||
| L* | 32.33* | 39.38* | 30.28* | -10.77 | -4.58 | -1.57 | 76.64 | 0.865 | 0.0017* |
| a* | 33.52 | 29.77 | 32.29 | 8.71 | 22.57 | -0.47 | -207.18 | 0.638 | 0.0920 |
| b* | 7.35* | 23.28* | 10.36* | -4.13 | -5.73 | -3.39 | 140.16 | 0.880 | 0.0010* |
| ΔE | -2.42* | 5.82* | 1.86* | 7.31 | -9.62 | 5.24 | 166.44* | 0.796 | 0.0097* |
| Chemical properties | |||||||||
| TBC | 0.89* | 2.61* | 1.32* | 0.413 | 0.195 | -0.970 | -3.59 | 0.968 | < 0.0001* |
| TPC | 69.62* | 2577.4* | 652.2* | 2769.1 | 2664.1 | 1644.6 | -7490.5 | 0.966 | < 0.0001* |
| AA | -1.24* | 13.28* | 6.51* | 31.60 | 28.93 | 9.71 | -108.66 | 0.845 | 0.0030* |
| I | 0.401 | 0.354 | 0.321 | -0.142 | -0.281 | 0.226 | 1.09 | 0.629 | 0.100 |
| Q | 0.159 | 0.252 | 0.271 | 0.379 | 0.445 | 0.0002 | -2.03 | 0.438 | 0.399 |
| K | 0.346 | 0.321 | 0.302 | -0.004 | -0.085 | 0.071 | 0.360 | 0.317 | 0.660 |
*Significance (p < 0.05). β1: fructans; β2: whey protein; β3: OSA starch; BD: bulk density; WSI: water solubility index; WAI: water absorption index; aw: water activity; H: moisture content; HYG: hygroscopicity; YE: yield of encapsulation; Tg: glass transition temperature; ΔE: total color difference; TBC: total betalain content; TPC: Total polyphenol content; AA: antioxidant activity; I: isorhamnetin; Q: quercetin; K: kaempferol.
Water activity
The water activity ranged from 0.047 to 0.094 (Table 3), and it was not significantly (p > 0.05) affected by the carrier agents (Table 4). In comparison with other studies, these values are lower (Vergara et al., 2014); however, they are within the commonly observed aw values in industrial spray drying. This low aw could represent better stability for betalains in the encapsulates.
Bulk density
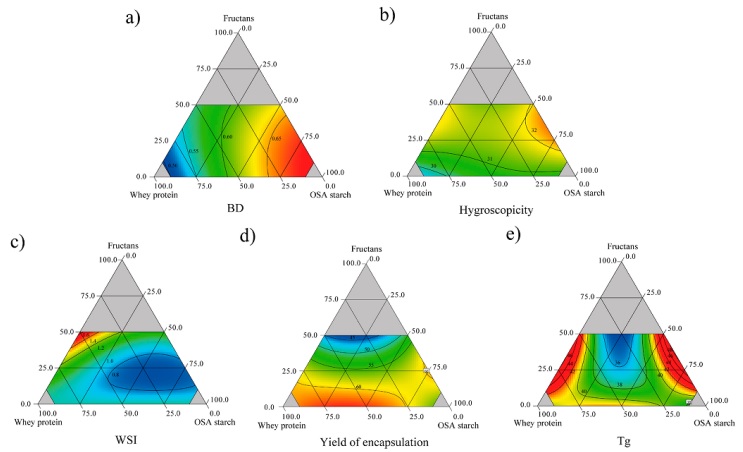
BD values ranged from 0.501 to 0.677 g/mL (Table 3). BD was significantly (p < 0.05) affected by the carrier agents. BD raised, as OSA starch proportions increased (Figure 1a), showing a significant effect (Table 4). This agrees with the BD value for OSA starch (0.52 g/mL) which is one of the carrier agents with high BD value. This could be attributed to the properties acquired by the starch once modified, such as the increase in molecular weight, which allows the material to fill spaces between particles, thus decreasing the occupied volume (Wang et al., 2015). To reduce packaging and transportation costs, high BD values are desirable, and BD is related to other encapsulates properties such as flowability, degree of caking, and solubility, which affect product stability (Bicudo et al., 2015). Conversely, high protein proportions led to the lowest BD values (Figure 1a), meaning that this material occupies great space even at low quantities, which could be attributed to the denaturalization of protein, which reduces solubility. Mixtures with both carrier agents (OSA starch and WPC) with high FRU values, tended to increase the BD values of the encapsulates due to the high BD of FRU (0.58 g/mL); this result agrees with Sánchez-Madrigal et al. (2019), who found that this high BD value is attributed to strongly packed particles occupying less interparticle space.
Hygroscopicity
The encapsulates hygroscopicity ranged from 28.54 to 32.98 (Table 3) and it was significantly (p < 0.05) affected by the linear terms of the carrier agents (Table 4). Mixtures with high proportions of WPC presented the lowest values for this response (Figure 1b). This same tendency was observed by Bhusari et al. (2014), who attributed this result to the high molecular weight of whey protein, which makes it less hygroscopic. Several studies have reported that betalain stability is influenced by hygroscopicity, and according to the results, there was a negative correlation (R = - 0.587; p = 0.017) between hygroscopicity and betalain content. Therefore, lower hygroscopicity values are required to ensure pigment retention.
Water solubility index and Water absorption index
WSI is a crucial parameter of product behavior in the aqueous phase because it determines the reconstitution quality of the encapsulates. The carrier agents showed a significant effect (p < 0.05) on WSI, with FRU showing great significance. However, its interaction with OSA starch (β 13 = - 4.25) had an antagonistic and significant effect (Table 4). WSI values ranged from 0.68 to 1.53 (Table 3), where the higher values corresponded to the encapsulates with high fructan proportions (Figure 1c). This effect was also reported by Sánchez-Madrigal et al. (2019) in anthocyanin encapsulation, attributing this behavior to the high concentrations of fructans; the interaction between the particles is promoted and leads to agglomerations that increase the WSI values. The WAI varied from 0.23 to 0.58 (Table 3) and it was not affected (p > 0.05) by the carrier agents (Table 4).
Yield of encapsulation
The YE varied from 42.2 to 64.4 % (Table 3). According to the criterion of Jayasundera et al. (2011), the YE of most of the treatments evaluated in this study were satisfactory for spray drying at laboratory or pilot scale level. The carrier agents in their linear and interaction terms were affected significantly, and the fitted model explained the data variability in 96.3 % (Table 4). Group 4 (Table 3) with high WPC and OSA starch in a 90:10 proportion conducted to high YE (60 - 64%), while YE decreased with an increase of FRU in the mixture (Figure 1d). Likewise, as observed in Table 4, WPC had the greatest positive effect, followed by OSA starch while FRU had a negative effect on YE. Similar results were reported by Bazaria et al. (2016) with the use of WPC, attributing this to a greater solubility of the proteins in the feed solution and the formation of a glassy skin upon drying, preventing the droplets from coalescing and sticking to the wall of the dryer chamber. A similar behavior was obtained with OSA starch (Figure 1d), where contents < 75 % resulted in high YE. On the other hand, FRU resulted in low YE, attributed to their properties, increasing the viscosity of the feed solution favoring the formation of thickening droplets, which are sticky and are attached in the dry chamber (Silva and Meireles, 2015). Low recovery yields using agave fructans as carrier agent in the microencapsulation of strawberry juice were reported by Santiago-García et al. (2023).
Glass transition temperature
The Tg of the encapsulates ranged from 34.58 to 42.69 °C (Table 3). Carrier agents did not show significant effect, but the interactions of FRU-WPC, FRU-OSA starch and FRU-WPC-OSA starch were significant (Table 4). The highest Tg values were exhibited by encapsulates with high WPC and OSA starch proportions (Figure 1e). The high Tg values obtained are according to other reports (50.5 - 54 °C) when protein isolates or concentrates are used as carrier agents (Puerta-Gomez and Castell-Perez, 2015). On the other hand, OSA starch has been reported with a high Tg value (Sweedman et al., 2013), attributed to the characteristics of hydrophobicity and steric, as well as its highly branched structure leads a molecule with better thermal properties. Borrmann et al. (2013) mentioned that OSA starch is a good carrier agent for the encapsulation of passion fruit juice since it increases the Tg. The obtained values are acceptable because under storage they will show good stability, retarding the degradation process.
Color
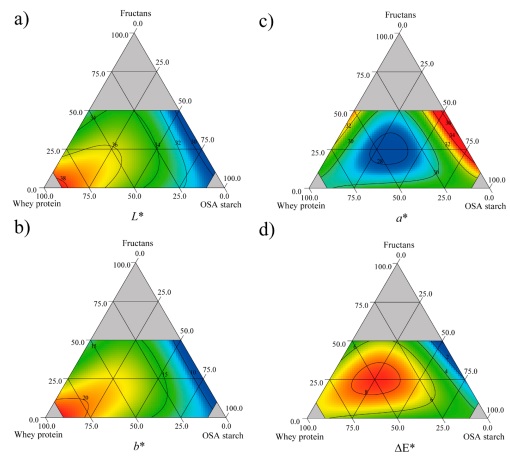
Table 3 shows the color parameters of the resuspended encapsulates. The L* parameter, which represents luminosity, was significantly (p < 0.05) affected by the carrier agents. WPC increased the lightness of the encapsulates compared to FRU and OSA starch (Figure 2a). Similar behavior was reported for betalains in red cactus pear encapsulates (Ruiz-Gutiérrez et al., 2014), where β-glucans were used as carrier agents. Furthermore, the a* parameter was not significantly (p < 0.05) affected by the carrier agents (Table 4), with values ranging from 27.75 to 33.50, where the highest values corresponded to the resuspended encapsulates with high OSA starch proportions (Figure 2b). This tendency agrees with Lacerda et al. (2016), in jussara pulp microparticles produced with mixtures containing high proportions of OSA starch, which presented higher a* values. The b* parameter (- blue/ + yellow) values ranged from 10.44 to 21.70 and the carrier agents in their linear terms had a significant (p < 0.05) effect in this response (Table 4). These high values are attributed to the fact that the pitaya juice was obtained from raw material composed of a significant proportion of orange pitaya (46 %), which is related to high BX content. High WPC proportions produced resuspended encapsulates with high b* values (Figure 2c) as is shown in Table 4. In comparison with other studies, the b* values reported by Ruiz-Gutiérrez et al. (2014) and Robert et al. (2015) in cactus pear juice encapsulation are negative, leading to bluish tones, while in this study b* values were positive, and the encapsulates resuspended tended to yellowish tones, due to the high orange pitaya proportions. Additionally, the total color difference (∆E) was significantly affected (p < 0.05) by the linear terms of each carrier agent and also by the interaction of FRU, WPC, and OSA starch (β 123 ) (Table 4). ∆E values ranged from 1.59 to 8.37, where the lowest values corresponded to the mixtures with high OSA starch proportions (Figure 2d). These low ∆E values are considered acceptable, representing minimal differences between the sample and the control (Nkhata, 2020), in this case, before and after spray-drying.
Morphological properties
The SEM results for the pitaya encapsulates are shown in Figure 3. In general, the micrographs showed spherical shapes for all mixtures with collapsed or compressed structures and agglomeration between particles. The particle size varied between 55 and 67 µm, and most of the microcapsules showed porous surfaces. To describe the individual effect of each carrier agent on the encapsulates, a comparison of the carrier agent’s micrographs as controls was made. The control of fructans (Figure 3a), resulted in a complete structure and smoother surfaces. This agrees with do Carmo et al. (2018), who reported that inulin showed more regular surfaces in beetroot microcapsules due to its hygroscopic characteristics. In contrast, encapsulates with decreasing FRU proportions and increasing WPC resulted in capsules with cracks and collapsed or compressed structures (Figures 3b, c). This can be corroborated in the encapsulates with high protein proportions (Figures 3b, 3d, and 3e) and with the WPC control (Figure 3f) where compressed and irregular microcapsules with cavities on the surface are observed. Similar results were reported by Mahdi et al. (2020) and Premi and Sharma (2017), who related these results with the viscoelastic properties and the film-forming capacity of these materials as well as the partial denaturalization of protein molecules during the drying process. Regarding the OSA starch, the control of this carrier agent (Figure 3g) shows a complete structure with a slight contraction. Similar findings were reported by Wang et al. (2017) during the encapsulation of chili seed oil using OSA starch as a carrier agent, reporting less surface damage. However, when they mixed OSA starch with other wall materials (gelatin and soybean protein) resulted in rupture of the microcapsules surface, which agrees with the obtained results for the encapsulates with OSA starch and WPC (Figures 3h and 3d) with cracks and fissures. When the carried agents are in similar proportions the encapsulate resulted with an irregular morphology with slight contraction in its structure (Figure 3i).
Figure 3 Morphology of carrier agents (controls) and pitaya (Stenocereus stellatus) encapsulates prepared with different mixtures of fructan (FRU), whey protein concentrate (WPC), and OSA starch (OSA), as carrier agents (%). (a) FRU-Control, (b) 24.7 FRU-65.3WPC-10 OSA, (c) 50 FRU-39.7 WPC-10.3 OSA, (d) 0 FRU-50 WPC-50 OSA, (e) 0 FRU-90 WPC-10 OSA, (f) WPC-Control, (g) OSA-Control, (h) 0 FRU-24.9 WPC-75.1 OSA, (i) 27.5 FRU-37.8 WPC-34.7 OSA.
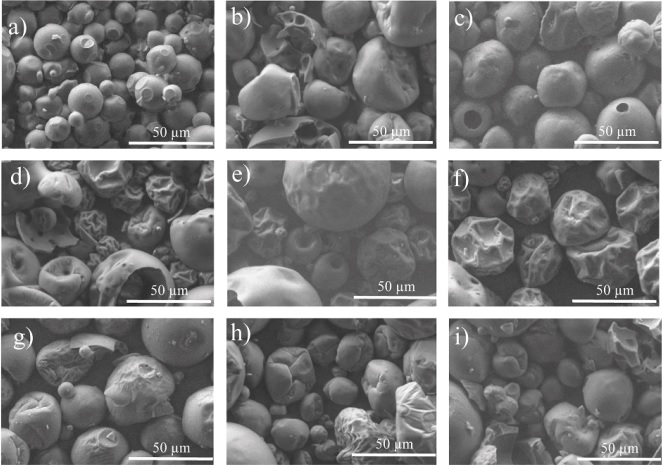
Figura 3. Morfología de los agentes acarreadores (controles) y de los encapsulados de pitaya (Stenocereus stellatus) preparados con diferentes mezclas de fructanos (FRU), concentrado de proteína de suero (WPC) y almidón OSA (OSA) como agentes acarreadores (%). (a) FRU-Control, (b) 24.7 FRU-65.3WPC-10 OSA, (c) 50 FRU-39.7 WPC-10.3 OSA, (d) 0 FRU-50 WPC-50 OSA, (e) 0 FRU-90 WPC-10 OSA, (f) WPC-Control, (g) OSA-Control, (h) 0 FRU-24.9 WPC-75.1 OSA, (i) 27.5 FRU-37.8 WPC-34.7 OSA.
Total polyphenol content
The chemical characteristics of the pitaya encapsulates are shown in Table 3. The TPC ranged from 934.33 to 2677.74 mg GAE/100 g d.b. The carrier agents significantly (p < 0.05) affected the TPC in their linear terms, and the proposed model described 96.6 % of the data variability (Table 4). The highest values corresponded to pitaya juice encapsulated with high protein mixtures, as shown in Figure 4a. This correlates with group 5 (24.7 % FRU:65.3 % WPC:10 % OSA starch) and mixture 8 (3.3 % FRU:68.4 % WPC:28.3 % OSA starch), both observed in Table 3. This can be attributed to the ability of the protein to form thermally permanent gels above 70 °C, minimizing the degradation of phenolic compounds (Bartkowiak et al., 2017). This agrees with the data reported by Bazaria and Kumar (2016) and Bhusari et al. (2014), for the encapsulation of beetroot juice and tamarind pulp, respectively. They attributed this to the formation of a glassy skin due to the surface-active properties of the protein. Similar findings were reported by Ben Sassi et al. (2020), who evaluated protein and carbohydrates as wall materials, where the protein showed better efficiency because of their stronger interaction with phenolic compounds by hydrophobic and non-covalent hydrogen bonds.
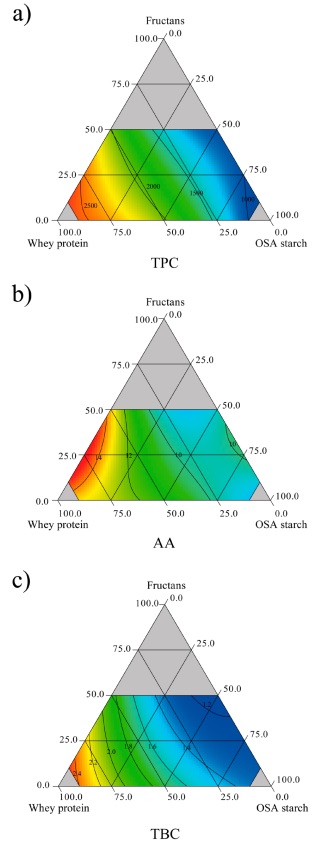
Comparing the juice phenolic content (679.26 mg GAE/100 g d.b.) and the content from the encapsulates with high protein proportions, a four-fold increase (1714.52-2726.89 mg GAE/100 g d.b.) was observed. This was also reported by Robert et al. (2015) where the cactus pear juice had 73.2 mg GAE/100 g and a three-fold increase was obtained in the encapsulates (231 mg GAE/100 g). On the other hand, the lowest TPC values were obtained for the mixtures with greater proportions of OSA starch (Figure 4a). This agrees with the results of da Silva et al. (2013) after the encapsulation of propolis with gum arabic and OSA starch, where they reported that the former achieved better preservation of phenolic compounds than OSA starch. On the other hand, it has been reported that mixtures with high fructan content decreased TPC in the encapsulation of blue corn extracts (Sánchez-Madrigal et al., 2019).
Antioxidant activity
The AA ranged from 7.27 to 15.13 µmol TE/g (Table 3). AA was significantly (p < 0.05) affected by the carrier agents, and the proposed model describes the data variability at 84.5 % (Table 4). WPC exhibited the greatest positive effect, whereas FRU had a negative effect, indicating less AA with an increase in this material (Figure 4b). This can be related to protein denaturation during the drying process, which releases bioactive peptides and the formation of complexes by protein-sugar interactions. Similar results were reported for the encapsulation of beetroot juice, where higher antioxidant activity was obtained by whey protein alone and in combination with either maltodextrin or inulin (do Carmo et al., 2018). This was attributed to the products of the Maillard reaction due to the possible interaction of the protein with the sugars from the juice at high temperatures during the spray drying, resulting in the formation of compounds like nitrogenated heterocycles and melanoidins, which have been associated with antioxidant activity (Ke and Li, 2023). Comparing the polyphenol content and the antioxidant activity in this study, both were higher as the protein proportion increased (Table 3). The same occurred in the study by Bazaria and Kumar (2016), where a gradual increase in the concentration of whey protein promoted the content of polyphenols and, therefore, increased the antioxidant activity in beet encapsulates due to the emulsifying and gelling properties of protein.
Flavonoid content
The individual flavonoid content was not significantly (p > 0.05) affected by any of the carrier agents (Table 4). The contents of isorhamnetin, quercetin, and kaempferol in the encapsulates are shown in Table 3. These values showed an evident decrease in contrast to pitaya juice, resulting in an average retention percentage of 32.51 % for isorhamnetin, 24.77 % for quercetin, and 13.78 % for kaempferol. These retentions were lower than those reported in red cactus pear encapsulates (Ruiz-Gutiérrez et al., 2014).
Total betalain content
One of the main properties of encapsulates is their pigment content. TBC was significantly (p < 0.05) affected by the carrier agents in their linear effect, and the proposed model was adjusted successfully to describe the data variability by 96.8 % (Table 4). Values for TBC ranged from 1.18 to 2.56 mg/g (Table 3). TBC increased as the WPC proportion increased in the mixtures, as shown in Figure 4c. For most mixtures, TBC was close to TBC in pitaya juice, obtaining a minimum retention of 71 %. However, the increase of protein in the mixtures could increase TBC of some encapsulates. This same trend has been reported for the encapsulation of cactus pear juice, with soybean protein isolates alone and blended with maltodextrin or inulin (Robert et al., 2015). They attributed this behavior to the cationic features of betalains promoting betalain-polymer interactions because of electrostatic interactions or hydrogen bonding. In addition, Adhikari et al. (2009) reported that whey protein isolate forms a film around the particles immediately after contacting the drying air, even faster than other carrier agents. Low betalain content was exhibited by encapsulates with high FRU and OSA starch proportions; however, in comparison with the results of Vergara et al. (2014) and Vargas-Campos et al. (2018), who used OSA starch as a carrier agent, the TBC values were higher. This suggests that the combined use of WPC, FRU, and OSA starch, as is observed in group 5 (24.7 % FRU:65.3 % WPC:10 % OSA starch) could enhance betalain contents (Table 3). Additionally, the betalain and polyphenol content, and the antioxidant activity of the pitaya encapsulates showed the same behavior. According to the Pearson´s analysis these results showed a strong correlation between TBC (R = 0.828; p = 0.0001) and TPC (R = 0.829; p = 0.0001) with AA.
Optimization of carrier agents for pitaya encapsulates
The optimization was based in obtaining pitaya encapsulates with appropriate physicochemical characteristics. Only responses with a significant fit (p < 0.05) to the proposed model and without a lack of fit were considered. A maximum of TBC, TPC, AA, YE, and b* parameter values, keeping the other properties in range, was the criterion to find the optimum proportions of carrier agents. According to the response optimizer, the optimal mixture consisted of 7.1 % FRU, 82.9 % WPC, and 10 % OSA starch, with a desirability score of 0.865. The resulting encapsulates showed values of 2.28 mg/g for TBC, 2481.72 mg GAE/100 g for AA, 13.8 µmol TE/g for TPC, 61.42 % for YE and 21.12 for the b* parameter.
Conclusions
The D-optimal mixture design was adequate to optimize the proportions of FRU, WPC, and OSA starch as carrier agents, on the physicochemical properties of encapsulated pitaya juice by spray drying. The combination of carbohydrates and proteins resulted in acceptable physicochemical properties of the encapsulates. Moreover, mixtures with high proportions of WPC improved the yield of encapsulation, betalain content and antioxidant activity. Similarly, the TPC showed a four-fold increase in comparison with pitaya juice. However, the color of the resuspended powders was affected by the whitening effect of the WPC, but increased the b* parameter of color related to the higher BX content of the pitaya juice used. The optimized mixture of carrier agents for pitaya juice encapsulation (7.1 % FRU, 82.9 % WPC, and 10 % OSA starch) revealed acceptable physicochemical characteristics. These results suggest that the materials evaluated in this study present a good alternative to improve the pigment preservation of pitaya juice with a possible application in the development of food products with antioxidant properties.

