


 nueva página del texto (beta)
 Inglés (pdf)
 Artículo en XML
 Referencias del artículo
 Enviar artículo por email
 Citado por SciELO
  Similares en
SciELO
Similares en
SciELO 
 Permalink
Introduction
Plant pigments, also known as natural dyes, are the chemical substances that provide color to plants, mainly fruits and vegetables. They are produced by plants as secondary metabolites with a particular purpose such as; attracting pollinators, promoting light capture during photosynthesis, protecting against oxidative damage, repelling insects or any other organism that could cause damage to the plant, in addition to participating in its development and metabolism (Fernández-López et al., 2020).
In recent years, the use of these pigments has increased in various areas such as cosmetics, pharmaceuticals, textiles, and food mainly (Rodríguez-Mena et al., 2023; Nambela, 2023; Pasdaran et al., 2023). Color is one of the most important parameters of foods since it can make them more attractive and appetizing, therefore, favor consumer acceptance (Juric et al., 2022). Recently, interest in plant pigments and their application in foods has increased, because they are considered natural and healthy, compared to synthetic dyes to which health problems have been attributed, such as asthma, allergies, and tumor development (Mota et al., 2023). It is worth mentioning that most plant pigments have additional characteristics to color, including activities such as antioxidant, anticancer, antimutagenic, and antithrombotic, among others, which makes them bioactive pigments and as a consequence, they can be used as ingredients in the production of functional foods (Hui et al., 2018). These properties depend on the chemical compounds that make up these pigments. According to Ghosh et al. (2022), plant pigments are classified as a) pyrrole derivatives (chlorophyll), b) isoprenoid derivatives (carotenoids), c) flavonoid derivatives (anthocyanins), and d) heterocyclic nitrogen derivatives (betalains).
Currently, some pigments obtained from vegetable sources such as beet (Beta bulgaris), carrot (Daucus carota), jamaica (Hibiscus sabdariffa), annatto (Bixa orellana), spinach (Spinacia oleracea), purple cabbage (Brassica oleracea), etc., are already on the market (Rodríguez-Mena et al., 2023), however, due to the high industrial demand for pigments and the wide range of shades necessary to cover the needs of the industry, alternative sources continue to be sought to obtain these pigments. Many plants could be potential sources of bioactive pigments, such as the case of C. bipinnatus, a plant rich in anthocyanins (Ninama et al., 2024), to which antioxidant, anti-inflammatory and antimicrobial properties have been attributed (Kulichenco et al., 2022; Bhuiyan et al., 2023). Gutierrez et al. (2023) used it to make rabbit chorizo to evaluate its influence on texture, color, and water activity, finding that there are no differences (p > 0.05) in texture and color, except for the internal value and for water activity (p < 0.05). However, despite previous studies, more research is needed to consider it as a potential source of bioactive pigments for industrial use.
Vegetable pigments have very attractive properties for the industry, however, they also have a disadvantage and that is that once they are extracted from the plant matrix they are generally unstable to factors such as light, pH, temperature, oxygen, or during food processing (Jurić et al., 2022). This is why once they are extracted they must be protected from degradation. For this, various methods have been proposed, the most used is encapsulation using various wall materials, mainly biopolymers such as chitosans, alginates, rubbers, etc. Currently, spray drying is one of the most used encapsulation methods in the industry, which consists of atomizing the solution or emulsion composed of the bioactive pigment and the wall materials, forming a cloud of droplets that come into contact with hot steam causing the water to evaporate and a dry product is obtained (Piñón-Balderrama et al., 2020). However, this method is not the most appropriate when it comes to thermolabile pigments, since contact with hot steam produces a certain degree of degradation of the compounds. A relatively recent alternative is encapsulation by lyophilization, which consists of preparing a solution containing plant pigments and wall materials. Subsequently, it is ultra-frozen, subjected to a vacuum to eliminate water, and finally, the encapsulated pigment is obtained (Menegazzi et al., 2020). This technique is a very good option for encapsulating thermolabile chemical compounds since, as it does not involve high temperatures, the compounds are better protected. It is worth mentioning that with this encapsulation method, microencapsulates in the form of flakes are obtained that have an encapsulation and release efficiency similar to that obtained by the spray drying method (Ballesteros et al., 2017).
Based on the above, in this work plant extracts were obtained from C. bipinnatus, which were encapsulated by the freeze-drying method. The microencapsules were characterized and the release and protection of the main chemical compounds (phenols and anthocyanins) present were evaluated. This is to evaluate their potential use as bioactive pigments in the food industry.
Material and methods
Materials
Free radical 1,1-diphenyl-2-picrylhydrazyl (DPPH), 6-hydroxy-2,5,7, 8-tetramethychroman-2carboxylic acid (TROLOX), quercitin 3-O-glucoside (isoquercitrin), folin ciocalteu reagent 1N, and gallic acid were purchased from Sigma-Aldrich (St Louis, MO). Sodium carbonate (Na₂CO₃), aluminum trichloride (AlCl₃), potassium chloride buffer, sodium acetate buffer, and potassium persulfate (K2S2O8), were obtained from J.T. Baker. S.A. de C.V. The solvents used were ethanol (EtOH), and methanol (MeOH) (J.T. Baker, Mexico City, Mexico). Distilled water was used in all the experiments.
Plant sample preparation
The purple sunflower flowers (C. bipinnatus) were collected at the El Cerrillo Campus of the Autonomous University of the State of Mexico, during September and October of 2022, coordinates 19° 24’ north latitude and 99° 41’ west longitude, at an altitude of 2,610 m above sea level. The flowers were stripped of their petals, these being the raw material to work. Petals were selected, discarding the damaged or discolored ones, they were subsequently deep-frozen at -85 °C, and freeze-dried until obtaining a fine powder. This was stored in amber glass bottles, in darkness, and at room temperature until later use.
Obtaining plant pigments
The pigments were obtained following the Baite et al. (2021) methodology with some modifications. The maceration extraction method was used, assisted by ultrasound, using ethanol-water (80:20) as a solvent. The fine powder obtained in the previous step was dissolved in the solvent at a concentration of 6 mg/mL, subsequently placed under stirring for 5 minutes, then subjected to sonication in an ultrasonic bath at 40°C for 40 min. Subsequently, the sample was subjected to stirring for one hour (120 rpm and 40°C), then filtered under vacuum. This last step was carried out twice to ensure the elimination of solids. Ethanol was removed using a rotary evaporator. The resulting sample was deep frozen (-80 °C) and subjected to freeze-drying for 24 hours, thus obtaining a solid which was called dry extract. For subsequent tests, the dry extract was resuspended in water at a concentration of 6 mg/mL.
Measurement color
The color of the samples was measured based on the CIELab color space system, following the methodology reported by Nguyen and Bechtold (2021). A colorimeter (Konica Minolta® Chroma Meter CR 400, Japan) was used. A 10 mL aliquot of the sample was taken and the colorimeter was used to determine the L*, a*, and b* values.
Phytochemical characterization of PPCb Quantification of total phenols
The total phenolic content was determined by the Folin-Ciocalteu method according to the methodology reported by Ladeska et al. (2022) with slight modifications. Two-hundred µL of the sample were placed in a test tube and 100 µL of Folin’s reagent were added; it was homogenized and left to rest for 8 min in the dark, then 200 µL of sodium carbonate (14 g/100 mL) and 1.5 mL of distilled water were added, it was homogenized again, leaving it to rest for 60 minutes. Finally, the absorbance was measured at a wavelength of 765 nm in a UV-VIS spectrophotometer. A standard curve was carried out with gallic acid (0.05 - 0.8 mg/mL), and the results obtained were reported as equivalents of gallic acid (EAG) in mg/g dry basis.
Quantification of flavonoids
The quantification of flavonoid content was carried out following the method reported by da Silva et al. (2022), with slight modifications. To an aliquot of 1000 µL of sample, 500 µL of 2 % aluminum chloride and 500 µL of distilled water were added, the mixture was homogenized and incubated for 10 min in the dark. Subsequently, absorbance was measured at 425 nm using a UV-VIS spectrophotometer. A standard curve was performed with quercetin (0.005 - 0.85 mg/mL). The results were reported as quercetin equivalents (EQ) in mg/g dry basis.
Quantification of total anthocyanin
The determination of anthocyanin content was carried out using the method reported by Sethi et al. (2020), with some modifications. Two buffers were prepared, one of 0.025 M potassium chloride (KCl) with a pH value of 1.0, and another of 0.4 M sodium acetate (CH3CO2Na) at pH of 4.5. Two 2 mL aliquots of the sample were taken, one aliquot was diluted with the pH 1.0 buffer and the second with the pH 4.5 buffer, subsequently a scan from 400 to 700 nm was performed in a UV-VIS spectrophotometer and the maximum absorbance peak was determined.
The amount of anthocyanins was calculated using the following equation:
Where:
A is (Absmax -Abs700) pH=1.0 - (Absmax - Abs700) pH=4.5
MW is the molecular weight of anthocyanin (449.02 g/mol)
DF: Dilution factor
ε: Molar extinction coefficient (26,900 L/cm mol)
Determination of antioxidant capacity
The determination of antioxidant capacity was carried out using the ABTS method reported by Cheng et al. (2016), with some modifications. For the preparation of the ABTS solution, 5 mL of 7 mM ABTS were mixed with 88 µL of 2.45 mM potassium persulfate, leaving this solution to stand for 12 hours in the dark. The previous solution was diluted with methanol until obtaining an absorbance of 0.740 at 734 nm. A reaction was carried out by combining 50 µL of the extract sample with 1.5 mL of ABTS solution, homogenized, and incubated for 10 min in the dark. Subsequently, the absorbance was measured against a blank at 734 nm in a spectrophotometer.
The percentage of inhibition of antioxidant capacity was calculated using the following equation:
Where A0 is the absorbance of the control and A1 is the absorbance of the extract. A standard curve was performed with Trolox (0.1 - 0.75 mM). The results obtained were reported as milligrams of trolox equivalent (mgTEAC).
Microencapsulation of PPCb
The method of Stoll et al. (2016), with slight modifications, was used for pigment encapsulation. Three formulations were prepared, one using M as wall material (30 %), another using GA (30 %), and the third forming a combination of both materials (15 % M and 15 % GA), all using the pigment aqueous as material to be encapsulated (70 %).
The aqueous pigment was mixed with the solution of wall material dissolved in water in a fixed proportion (30 - 70 respectively). The mixture obtained was homogenized in an IKA T50 digital ULTRA TURAX, for three periods of two minutes with a minute of rest between each one, until the complete homogenization of the materials was achieved. The resulting mixture was subjected to two freeze-drying periods, each lasting 24 h, thus obtaining a microencapsulated material that was pulverized in a mortar and sieved through a 100 mm sieve. The microencapsulate obtained was used for subsequent tests.
Determination of encapsulation yield
The calculation of the encapsulation yield (Y) was carried out following the methodology reported by Sharayei et al. (2020) with slight modifications. The calculation was obtained using equation 3, based on dry matter measurement:
Determination of moisture content
Moisture content was carried out using the method described by Thakur and Thakur (2020). A sample of 1 g of each formulation was taken and placed in an oven at 65 °C for 48 h until a constant weight was obtained. To determine the percentage of moisture in the microencapsulation, the final weight (PF) was divided by the initial weight (PI) according to the following equation:
Apparent density ()
To determine the density of the microcapsules, the method described by Kaderides et al. (2015) was used. 500 mg of
microencapsulated sample of each formulation were placed in a test tube and
shaken to eliminate air, this was done until a constant volume was obtained. The
apparent density (
Microencapsulation efficiency
To determine the microencapsulation efficiency, the method described by Stoll et al. (2016) with slight modifications, was used. For this calculation, the total phenol content in the sample was used as a reference. Three data were included, the total amount of phenols introduced into the microencapsulate (FT), the number of phenols on the surface of the microencapsulate (FS), and the amount of phenols quantified in the microencapsulate at the final moment of the release kinetics (FL) (this data was obtained from the release kinetics described previousy). To obtain the surface phenols, a 100 mg sample of the microencapsulate was taken, suspended in 1 mL of ethanol-methanol (1:1), vortexed for one minute, and centrifuged at 3500 rpm for 10 min. The phytochemical analysis for total phenols previously described previously was carried out on the supernatant. These surface phenols were subtracted from the phenols quantified in the release kinetics, and the result was divided between the phenols introduced in the microencapsulation and then it was multiplied by 100, according to the following equation:
Scanning electron microscopy
To observe the morphological structure of the microencapsules, scanning electron microscopy was used following the methodology of da Silva et al. (2023) with some modifications. The samples were placed on the sample holder and fixed with double-sided adhesive tape and covered with a thin layer of gold. A Thermo ScientificTM PrismaTM E (Waltham, MA, USA) SEM was used under an accelerating voltage of 15 kV at a speed of 80 s and a current of 40 mA. The samples were examined at 55x magnifications.
PPCb release kinetics
The release kinetics of the microencapsulation were carried out based on the method described by Orozco-Villafuerte et al. (2018) with slight modifications. The microencapsulate was placed in distilled water at a concentration of 100 mg/mL, at room temperature (25°C ± 1), and shaken gently. A 2 mL aliquot was taken every 5 min for one hour. The aliquots obtained were analyzed for phenols, anthocyanins, antioxidant capacity and color, following the phytochemical and colorimetric methodologies mentioned above. This procedure was carried out on the encapsulations obtained with the two wall materials and their mixture. Based on the release percentage of the phytochemical compounds, the formulation containing the mixture of the two wall materials was chosen to evaluate the release of the extract at different temperatures. Two release kinetics similar to the one described above were carried out, but now using two temperatures (4 °C and 65 °C). Phytochemical and color analyzes were also carried out on the aliquots obtained.
Results and discussion
Obtaining the plant pigment from the petals of C. bipinnatus
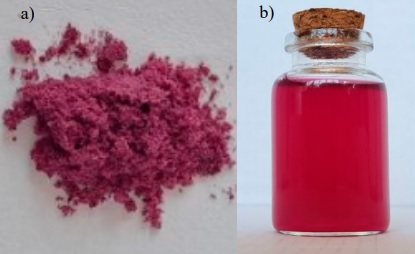
As a result of the plant pigments extraction, a purple powder was obtained (Figure 1a), which was suspended in distilled water at a concentration of 6 mg/mL to observe its dyeing power. A purple-reddish solution was obtained with a pH value of 4.55 ± 0.05. The solution presented minimum amount of solids that precipitated after it was stirred, this small insoluble portion may be due to the presence of some non-polar compounds contained in the extract. It has been reported that within the content of C. bipinnatus flowers, chalcones, and some aromatic ketones can be found (Iwashina et al., 2015) that form part of the central nucleus of many important biological compounds, within which contain some hydrophobic residues (Arzola, 2021). The solution obtained was filtered with Whatman No. 1 filter paper using a vacuum pump to eliminate non-soluble molecules, obtaining a homogeneous solution, as shown in Figure 1b. It is worth mentioning that homogeneity in colorful solutions is highly desirable.
Color analysis of plant pigment
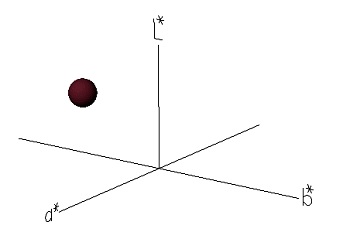
The color of the extract is reported in CIELab system coordinates (L*, a*, b*) (Table 1). It can be seen that, based on the a* and b* values, the pigment obtained has a red color with little tendency to yellow, the b* coordinate being close to 0 is not visually notable, so the shade of the pigment is mostly purple-reddish (Figure 1b). Regarding luminosity (L*), let us remember that L can take values ranging from 0 to 100, where L=0 is indicative of the absence of luminosity and L=100 is indicative of the maximum luminosity of the color (Konica Minolta, 2023). In the pigment studied, a value of L= 17.94 ± 0.59 was obtained, which is closer to zero, and therefore, plotting the three coordinates (L*, a*, and b*) in CIELab space results in a dark reddish-purple color, as shown in Table 1.
Phytochemical characterization of the plant pigment
The antioxidant capacity of a plant extract is directly related to its chemical composition, mainly to the phenol content (Bijanji et al., 2021). Particularly in the C. bipinnatus species, it has been reported that its main bioactive chemical components are flavonoids, within which a large proportion are anthocyanins (Iwashina et al., 2015). For this reason, in the chemical characterization of the plant pigment, phenols, flavonoids, anthocyanins, and antioxidant capacity were quantified.
The results are expressed in mg of the phytochemical compound per g (dry basis) of the plant pigment (Table 2). C. bipinnatus, not being a species currently used as a source of pigments for industry, has a limited number of phytochemical studies in this regard, so there is no standardized extraction method, the concentrations of solvents used are diverse and, as a consequence, the yields obtained are also variable.
Table 2: Results of phytochemical analysis of PPCb.
| Chemical compound | Concentration |
| Total phenols (mg EAG/g) | 95.05 ± 0.51 |
| Total flavonoids (mg EQ/g) | 52.40 ± 3.20 |
| Anthocyanins (mgCyn-3glu/g) | 3.96 ± 0.22 |
| Antioxidant capacity by ABTS (inhibition %) | 89.0 ± 1.55 |
Results are expressed as mean ± standard deviation of triplicate measurements.
The main compounds that gives the petals of C. bipinnatus the purple hue are anthocyanins. This purple flower variety has been reported with the highest amount of phenols in its species, having concentrations even more than double compared to white, pink, and orange varieties (Jang et al., 2008). This difference in phenols is possibly caused by its higher content of anthocyanins, of which cyanidin-3-glucoside has been reported in the greatest proportion in this plant (Iwashina et al., 2015), giving it its characteristic color. The amount of flavonoids and anthocyanins obtained is similar to that reported by Fernandes et al. (2019), who used a similar extraction method, maceration, and ultrasonication, with the difference that these authors used water-acetone as solvent. From the petals, they obtained values of 44.5 mg EQ/g dry extract and 4.18 mg Cyn-3-glu / g dry extract, values close to those shown in Table 2, maintaining a similar ratio of anthocyanins - flavonoids. On the other hand, Jang et al. (2008) used an extraction method that only involved immersion of the petals in methanol as a solvent and obtained a lower amount of phenols (34.46 mg EAG/g dry extract) than that obtained in the present study (95.05 ± 0.51 mg/g), which suggests that the solvent and the extraction method are key factors to obtain a greater amount of compounds, so we can say that the combination of maceration and ultrasonication is more efficient for the extraction of chemical compounds compared to the use of maceration by itself.
Once anthocyanins are extracted from the plant matrix, they easily undergo degradation reactions, having a very variable stability depending on their structure and the conditions that surround them. These degradation reactions are mainly determined by pH, temperature, light, or oxygen. Thus, the presence of light can promote its degradation, and the absence of water can improve this stability (Wrolstad et al., 2005). Regarding the results of the antioxidant capacity, an 89.0 ± 1.55 % inhibition was obtained. This value is comparable with that obtained by Woo et al. (2010), who reported values of around 95% inhibition in C. bipinnatus extracts obtained by ultrasound using the DPPH method. These authors reported high instability of the extracts after 12 d. The extracts lost approximately 50 % of their antioxidant capacity. The data are also comparable with those reported by Cheng et al. (2016), who reported values of 80 and 89 % inhibition in Cosmos caudata extracts obtained with methanol and ethanol respectively, determined by the ABTS method. It is worth mentioning that, although cyanidins are reported as the main anthocyanins responsible for the biological activities of the C. bipinnatus violet variety, including the antioxidant and antimutagenic capacity (Oh et al., 2008), a relationship cannot be established with a direct relationship between the amount of cyanidins and the antioxidant capacity due to the large amount of additional compounds found in this flower (Jang et al., 2008).
Due to the instability that anthocyanins present in the face of various factors, mainly light, pH, and temperature, it is essential to use a protection method, being encapsulation a very good option. There are many encapsulation techniques for plant pigments, but due to the thermosensitivity of anthocyanins, in this work, the use of encapsulation by lyophilization was chosen.
Microencapsulation of plant pigment
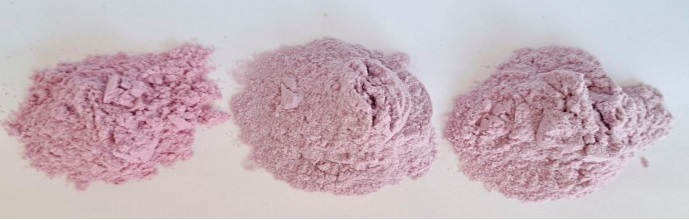
In microencapsulation by lyophilization, two wall materials were tested: M and GA, and their mixture at a 1:1 ratio. In all three cases, the encapsulation of the pigment was achieved, obtaining three powders with light purple tones. At first glance, the tone obtained by using M alone as wall material seemed a little more intense, as shown in Figure 2.
Analysis of the microencapsules
Several determinations were carried out on the microencapsules obtained to find out if the wall material used had any effect on the encapsulation process (Table 3).
Table 3. Analysis of microencapsulates.
| Parameters | Wall material | ||
| M | GA | M-GA | |
| Encapsulation performance (% w/w) | 89.27 ± 0.17a | 87.14 ± 1.71a | 88.36 1.03a |
| Apparent density (g/mL) | 0.323 ± 0.015a | 0.276 ± 0.018a | 0.174 0.026b |
| Humidity (%) | 0.92 ± 0.15a | 2.50 ± 0.35b | 1.13 0.21a |
| Microencapsulation efficiency (%) | 81.51 ± 3.74a | 82.64 0.99a | 80.62 ± 5.09a |
Results are expressed as mean ± standard deviation of triplicate measurements. Values in the same row with different letters are significantly different (p<0.05).
Encapsulation performance
Although the encapsulation performance values using different wall materials were slightly different (89.27 ± 0.17, 87.14 ± 1.71, and 88.36 ± 1.03 for M, GA, and M-GA respectively), no significant differences were found between any of the values obtained. This indicates that the amount of solids encapsulated during freeze-drying is similar regardless of the wall material used. It is worth mentioning that the values obtained (close to 90 %) are comparable with other encapsulation performance values reported using this same method (Kaderides, 2015; Sharayei et al., 2020).
Determination of moisture content
In the determinations of the moisture content, it was found that the microencapsulate that retained the most moisture was the one that used GA, with a value of 2.50 ± 0.35, being significantly higher than the humidity of the encapsulates where GA and M-GA were used as wall materials, this is consistent with what was reported by Stoll et al. (2016), who, using the same formulations in the same proportions, obtained the highest humidity percentages in the formulation with GA, followed by the mixture between both wall materials and M alone. However, the humidity percentages obtained by these authors were higher, being 12.54 % for GA, 11.61 % for the M-GA formulation, and 10.65 % for M; this is because, in their study, the lyophilization of the material to be encapsulated was carried out only once, while in this study two lyophilization sessions were carried out, leaving the capsules with a lower percentage of humidity. This low moisture content is somewhat beneficial, since a high moisture content promotes molecular movement, increasing chemical reactions and degradation, and decreasing the stability of the molecules (Jafari et al., 2016).
Apparent density
The density results obtained for the microencapsulates are similar to those reported by Kaderides et al. (2015), who used GA, M, and two other wall materials, alone and in combinations, obtaining values of 0.13 to 0.74 g/mL. The microencapsulation obtained using M-GA was the one that presented the lowest value compared to the other wall materials. This decrease in apparent density may be due to the interaction between the materials when mixed, as reported by Rowe et al. (2009). The polysaccharides when processed together, can modify their structures resulting in a less dense component compared to when they are alone. It is worth mentioning that the density of the microencapsulates is provided by the wall materials, which could give them greater or lesser volume. Furthermore, at the time of release, they could modify the characteristics of the encapsulated pigment, potentially making it more or less viscous or with different colors than desired.
Microencapsulation efficiency
The efficiency of microencapsulation is directly related to the lifetime of anthocyanins in the powder (Idham et al., 2012), which refers to the potential of the wall material to encapsulate or maintain a material within the microcapsule. The efficiency of the three encapsulations obtained remained close to 80% and there was no significant difference between them, indicating that most of the components are found within the microcapsules. Various authors have compared the use of M y GA as wall materials for the production of microcapsules (Stoll et al., 2016; Idham et al., 2012; Silva et al., 2013; Souza et al., 2015), without definitive conclusions as to which is better as an encapsulant. In this work, similar results to those reported were obtained, since no significant differences were found in the encapsulation efficiency between the wall materials used or in their combination, this is because the two materials used have similar characteristics. It has been reported that it is the encapsulant material-encapsulated material ratio that affects the encapsulation characteristics, as well as the microencapsulation efficiency (Mahdavi et al., 2016), in this study when used the same proportions with no variation in the encapsulation efficiency.
Scanning electron microscopy
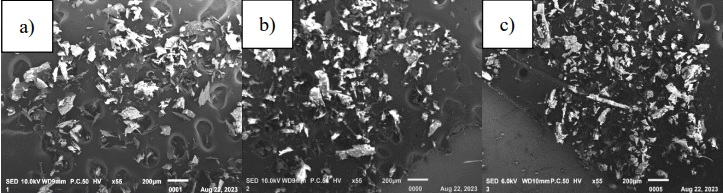
According to Cam et al. (2014), the surface morphology of microencapsulates is an indicator of the quality of the encapsulation and in turn, is related to the physicochemical properties of the capsules such as fluidity and dispersibility. Figure 3 shows the micrographs of the encapsulations with the two wall materials and their combination, showing that they all have an irregular shape similar to broken glass, which reflects the presence of the wall materials on the surface of the encapsulation, indicating that the pigments are trapped; similar results were reported by several authors who used the same encapsulation method (Pudziuvelyte et al., 2020; Thakur et al., 2020; Sun et al., 2022). This morphology is considered typical of the lyophilization encapsulation process (Khazaei et al., 2014). All microencapsules have smooth surfaces and similar particle sizes. No obvious difference is observed when using the wall materials separately or their combination.
Release kinetics
The release kinetics of the three encapsulates were determined in an aqueous system at room temperature (25 ± 1 °C), measuring the anthocyanin content, as well as the color, every 5 minutes for one hour. It was observed that the microencapsulate containing M-GA was the one that presented the best characteristics since the release of anthocyanins was carried out in a more controlled manner and the color was maintained better (data not shown). Based on the above, microencapsulation with M-GA was chosen for subsequent tests, which consisted of carrying out release kinetics at common temperatures used in the food industry. Considering the refrigeration temperature (4 °C), the ambient temperature (25 °C) and a common food process temperature (65 °C).
During the release kinetics, total phenolics, antioxidant capacity, and anthocyanins were quantified and color was measured.
Quantification of total phenols
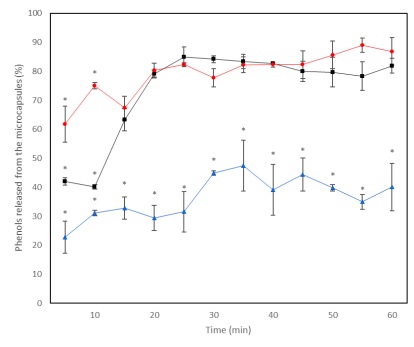
Phenols are of utmost importance in plants, they fulfill various functions within the plant as protection against stress, and they participate significantly in the regulation of the plant in the face of a large amount of light, low temperatures, infections by pathogens, herbivores, and deficiency of nutrients (Naikoo et al., 2019). In the food industry, they are desired because they provide color, and flavor and act as antioxidants (López et al., 2023). During industrial processes they are subjected to various conditions, such as abrupt changes in temperature that can cause changes in their structure, affecting their stability and availability. In the release kinetics, it was observed that the concentration and release rate of phenols to the medium is higher at 25 °C and 65 °C without significant differences between them (Figure 4), compared to the release at 4 °C. These results coincide with those reported by Acosta et al. (2014), who tested different extraction conditions of phenols from plant matter, and concluded that these compounds are obtained better by increasing the temperature; these authors obtained higher concentrations of phenols in treatments with temperatures higher than the environment. This may be because by increasing temperature there is a better disruption of the molecules that retain phenols, achieving better release rates (Wang et al., 2014).
Quantification of anthocyanins
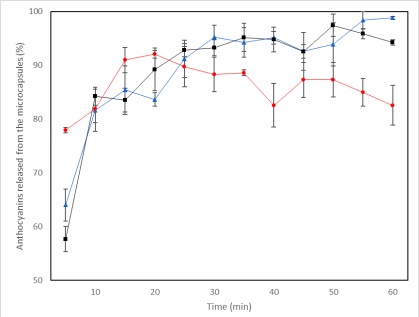
The release of anthocyanins, on the other hand, was affected at 65°C, where the percentage of release at the end of the kinetics was significantly lower compared to the other two temperatures (4 and 25 °C) (Figure 5). Something notable is that the release of anthocyanins at 65 °C is faster compared to the other two temperatures. It can be seen that there is an increase until minute 20 and from that point onwards a slight decrease in the percentages released begins. This behavior was also reported by Jiang et al. (2019) and Alburquerque et al. (2020), who tested different temperature conditions and exposure times for the extraction treatment, concluding that the longer the exposure time to high temperatures, a lower concentration of anthocyanins will be obtained, indicating possible thermal degradation. Albuquerque et al. (2020) concluded that the best temperature and exposure time conditions for the extraction of anthocyanins were 34.4°C for 9 minutes and that at higher values there was a decrease in the extracted anthocyanins.
Determination of antioxidant capacity
Compounds with antioxidant capacity are also considered of utmost importance in food products since they not only have benefits for human health, but also influence the preservation of food by inhibiting oxidative processes, which cause instability, loss of flavor, color, and other desirable characteristics (Shahidi et al., 2015). That is why they seek to preserve throughout the entire food production process, where various temperatures are generally involved.
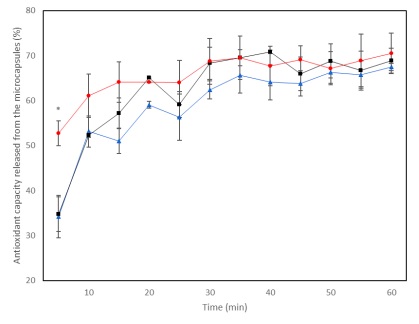
Regarding the antioxidant capacity, this was not affected by temperature (Figure 6). Except for the first point of the kinetics, the antioxidant capacity showed similar behavior in the three temperature conditions. This could be because the compounds released at the three temperatures have good antioxidant capacities, while at 4 °C and 25 °C a higher percentage of anthocyanins are being released, which are associated with the antioxidant capacity (Wu et al., 2018), at 65°C a higher percentage of phenols is being released, which are also directly related to the antioxidant capacity (Bijani et al., 2021), thus compensating for the lower percentage of anthocyanin release that occurs at high temperatures, and obtaining kinetics of release similar to the three temperatures evaluated.
Color comparison of M-GA at three temperatures
Regarding the color during the release kinetics (Table 4), the most affected values were those of luminosity (L*) and red intensity (+a*) at 65 °C. From the beginning, the release kinetics at 65 °C were the ones that presented the highest L* values and the lowest intensity values of the red hue; this may be due to the low percentage of anthocyanins released at such temperature. The behavior of the L* and a* variables is characteristic of a decrease in the amount of anthocyanins, which was reported by Jiang et al. (2019), who concluded that the increase in temperature causes anthocyanins to drastically change color, causing an increase in brown tones, and an irreversible decrease in the red tone, in addition to an increase in L*, probably due to a process of degradation.
Tabla 4 Color del pigmento liberado a diferentes temperaturas a partir de los microencapsulados, usando GA-M como material de pared.
Table 4. Color of squash fruit peel (Cucurbita pepo L.) var. ‘Grey Zucchini’s.
| Parameters | Release temperature | ||
| 4°C | 25°C | 65°C | |
| Luminosity (L*) | 20.18 ± 0.62 | 19.23 ± 0.35 | 24.82 ± 0.89 |
| Coordinate a* | 23.94 ± 0.48 | 24.87 ± 0.24 | 20.07 ± 0.63 |
| Coordinate b* | 1.08 ± 0.32 | 1.49 ± 0.24 | -0.02 ± 0.48 |
Pigment color released at different temperatures from the microencapsulated, using GA-M as wall material.
However, in this work, the time and temperature conditions were not sufficient for the red hue of the sample to be completely lost. A decrease was obtained at 65°C, but it was not completely lost. This can be explained because anthocyanins have certain heat resistance and good color stability at acidic pH (Wu et al., 2018). It is worth mentioning that the pH of the plant pigment presented values between 4 and 5, with pH being the main factor that influences the coloration of anthocyanins. The values of the variable b* presented small changes that cannot be seen with the naked eye.
Since anthocyanins are the main responsibles for the color in the plant pigment, they are the priority to preserve with microencapsulation, seeking to preserve their color and antioxidant capacity, therefore, the best temperature conditions to release the extracts are 4°C and 25°C given that it is where these attributes are best preserved.
Conclusions
Hydroalcoholic extraction allows obtaining dye extracts from C. bipinnatus flower petals with a phytochemical composition abundant mainly in phenols and anthocyanins, which provide antioxidant capacity. These properties in turn make it prone to degradation, so it is necessary to implement an encapsulation method to guarantee its protection.
Encapsulation by freeze-drying of the plant pigment presents good encapsulation performance and efficiency, so we can say that it is a suitable and efficient method to encapsulate this type of material. On the other hand, the combination of GA and M as wall materials are good options because they favor the conservation of the physicochemical properties of the plant extract.
With the encapsulation method and the wall materials used, the best temperature conditions for the conservation of anthocyanins, and as a consequence the antioxidant capacity and color of the plant pigment, are 4 and 25°C.
Based on the results obtained, we can conclude that the plant pigment extracted from the petals of C. bipinnatus and encapsulated by freeze-drying can be considered a potential source of plant pigment with application in the food industry, especially in products that do not require temperatures higher than 25 °C.
Acknowledgments
The authors acknowledge the partial financial support of the Autonomous University of the State of Mexico under Grant Agreement No. 4989/2020CIB.

