


 nueva página del texto (beta)
 Inglés (pdf)
 Artículo en XML
 Referencias del artículo
 Enviar artículo por email
 Citado por SciELO
  Similares en
SciELO
Similares en
SciELO 
 Permalink
Introduction
Globally, there has been a growing increase in public investment over the years to promote neurodevelopment in young children; this policy aligns with the United Nations (UN) 2030 Sustainable Development Goals, which includes the target: "ensure that all girls and boys have access to quality early childhood development, care, and pre-primary education so that they are ready for primary education1."
In various countries, particularly low-income ones, one of the pillars for improving child development is early inclusion in education programs, such as kindergartens (preschool education) or institutions with trained personnel for childcare2. Early age refers to the period from birth to 5 years of age; this period is critical as it establishes the foundations of brain architecture and forms the structure for developing new cognitive, social, and emotional skills3.
In the international context, numerous publications have demonstrated that the implementation of government programs to promote early childhood development (ECD) in children under 5 years of age effectively supports optimal development by improving the acquisition of cognitive skills3-5. Long-term effects observed among participants in these programs include a higher proportion of high school graduates, increased years of education, higher income levels, and reduced teenage pregnancy rates6. The benefits are not solely individual, as from a macroeconomic perspective, data indicate a return of three to seven dollars for every dollar invested in these programs6-8.
In Mexico, although preschool education has been mandatory since 2002, by 2019, it was estimated that only 7.1% of children aged 0-35 months attended some form of childcare or early education program, while 62.4% of children aged 36-59 months attended preschool education9. Despite these figures, it is important to recognize that strategies targeting vulnerable populations have been implemented over the years, which directly or indirectly benefit child development. For example, in 2006, the Mexican Child Care Facilities Program (PEI, for its Spanish acronym) was created by the Ministry of Social Development (Secretaría de Desarrollo Social, SEDESOL) to support childcare for children between one and 3 years 11 months of age, as well as children under 6 years with disabilities. The families benefiting from this program are those where mothers, fathers, or guardians worked, sought employment or studied and were also living in poverty without access to public or private childcare facilities10,11. By 2012, it was estimated that the PEI had served a total of 1.05 million children, indicating that if the program were discontinued, 34% of beneficiaries would have to leave their jobs to care for their children12.
Since its creation, the PEI has undergone modifications based on various evaluations13,14, becoming an integrated and standardized model to address children's educational and healthcare needs. In general terms, these childcare facilities operate 8 h daily, Monday through Friday, and the attending children, besides receiving two meals per day, participate in various social, motor, cognitive, and interactive activities that promote early childhood development15.
Between 2014 and 2015, our group conducted a cross-sectional study to evaluate the association between time spent in the PEI and developmental levels in children under 5 years; the results showed that longer attendance to the PEI was associated with an increased frequency of children with normal global development (assessed using the Child Development Evaluation test [EDI, for its Spanish acronym]), as well as across developmental areas, with language and social areas showing the highest scores. Specifically, in the group with ≥ 24 months of attendance at childcare facilities, the adjusted prevalence odds ratio (POR) for achieving a normal global result was 3.46 (95% CI 2.13 - 5.60)16.
To follow-up on these initial observations, the present research aimed to evaluate the effect of PEI on the developmental level of children under 4 years of age after 6 months of attendance at childcare facilities through a longitudinal study.
Methods
This was a prospective cohort study that included all children aged 12-48 months attending PEI childcare facilities in the states of Baja California and Campeche between November 2014 and June 2015. Children who were 42 months or older at the time of the first evaluation, as they would be over 48 months at the second evaluation, and children who stopped attending childcare facilities before the second evaluation were excluded from the study.
For each participant, age, sex, attendance time at the childcare facility before the start of follow-up, and the presence of any disability were recorded. The latter was defined as any person who presents one or more physical, mental, intellectual, or sensory deficiencies due to congenital or acquired reasons, whether permanent or temporary11.
Development assessment was conducted using the EDI test at the beginning of the study and 6 months later. EDI is a screening tool developed and validated in Mexico to detect developmental problems in children between 1 month and 5 years. This test has adequate sensitivity and specificity to identify developmental levels both globally and across developmental areas: fine motor, gross motor, language, social, and knowledge. The results, both overall and by developmental area, are based on a traffic light system - green, yellow, and red - classifying each child as having normal development, developmental lag, or risk of delay, respectively17,18. In the present study, results are described for motor, language, and social areas for children aged 12-48 months, while the knowledge area was only evaluated in children over 36 months; thus, for this latter area, results are only shown for the 37-48 months group (n = 431).
The staff responsible for each facility included in the study administered the EDI test. For proper administration, staff previously attended a training course, reinforcing learning with brief videos about the evaluation technique for each EDI item. In addition, each childcare facility had a supervisor who verified the correct application. This supervisor collected the forms completed for each participant to proceed with electronic data capture. Information was centrally consolidated, and the final database was structured. This study was part of project HIM/2013/063, approved by the Ethics and Research Committees.
Statistical analysis
For the descriptive analysis, qualitative measurement variables are presented as absolute frequencies and percentages, while quantitative variables, which did not have a normal distribution, are expressed as median and interquartile range (IQR).
For inferential analysis, Chi-square was used for comparison between groups, and McNemar's test was used to compare proportions between developmental levels before and after 6 months in the PEI. p < 0.05 was established as statistically significant. Analyses were performed using IBM SPSS version 27.0.
Results
Figure 1 presents the flowchart of the participant selection process; as shown, the eligible population was 2395 participants. However, 561 children did not complete the second evaluation, resulting in a total analyzed population of 1834 children for this study.
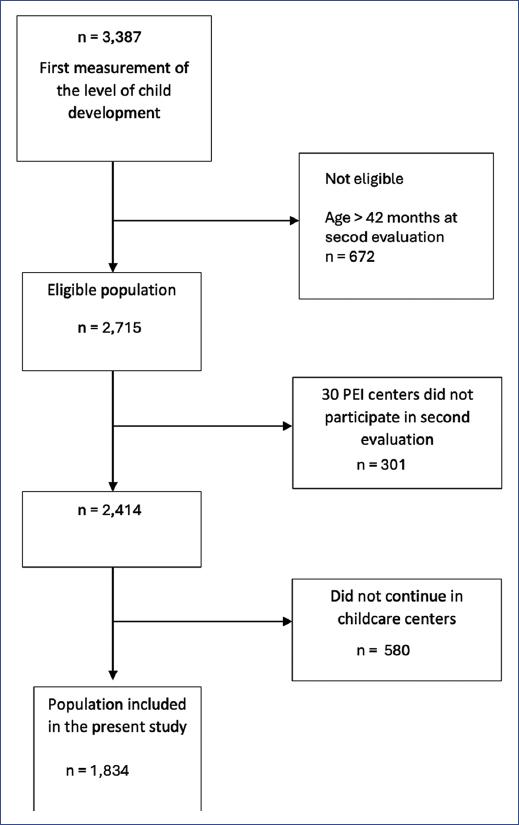
Figure 1 Flow diagram of the population included in the study, starting from the baseline measurement.
Table 1 describes the characteristics of participants at the time of the first evaluation. Of the total, slightly more than half were male (n = 948, 51.7%); while by age group, the majority corresponded to children aged 25-36 months (48.4%), followed by 12-24 months (28.1%), and the 37-42 months group (23.5%). It should be noted that 16 children had some form of disability (0.9%). As also observed, the length of stay in childcare facilities varied, with the largest proportion having < 6 months (n = 806, 43.9%), compared to the smallest proportion who had ≥ 24 months (n = 95, 5.2%). To contrast this information, table 2 presents the most relevant finding: by age group, the majority of participants were between 37 and 48 months old (48.8%).
Table 1 Characteristics of the population studied in the first evaluation (n = 1,834)
| Study variables | Total n = 1,834 | Distribution by age group (months) | ||||||
|---|---|---|---|---|---|---|---|---|
| 12-24 | 25-36 | 37-42 | ||||||
| n | (%) | n | (%) | n | (%) | n | (%) | |
| 515 | (28.1) | 888 | (48.4) | 431 | (23.5) | |||
| Sexa | ||||||||
| Male | 948 | (51.7) | 269 | (52.2) | 461 | (51.9) | 218 | (50.6) |
| Female | 886 | (48.3) | 246 | (47.8) | 427 | (48.1) | 213 | (49.4) |
| Disabilityb | ||||||||
| Yes | 16 | (0.9) | 2 | (0.4) | 4 | (0.5) | 10 | (2.3) |
| Length of time in the program at the start of the studyc | ||||||||
| < 30 days | 111 | (6.0) | 55 | (10.7) | 45 | (5.1) | 11 | (2.6) |
| 1-5 months | 695 | (37.9) | 339 | (65.8) | 276 | (31.1) | 80 | (18.6) |
| 6-11 months | 383 | (20.9) | 117 | (22.7) | 198 | (22.3) | 68 | (15.8) |
| 12-17 months | 438 | (23.9) | 4 | (0.8) | 306 | (34.5) | 128 | (29.7) |
| 18-23 months | 112 | (6.1) | 0 | - | 63 | (7.1) | 49 | (11.4) |
| ≥ 24 months | 95 | (5.2) | 0 | - | 0 | - | 95 | (22.0) |
aChi-square test for differences by sex and age p = 0.883.
bLambda test for disability and age (years) p = 0.109.
cKendall's Tau-b between program permanence and age 0.443; p < 0.001.
Table 2 Characteristics of the study population in the second evaluation, at 6 months
| Study variables | Total n = 1,834 | Distribution by age group (months) | ||||||
|---|---|---|---|---|---|---|---|---|
| 12-24 | 25-36 | 37-48 | ||||||
| n | (%) | n | (%) | n | (%) | n | (%) | |
| 187 | (10.2) | 750 | (40.9) | 897 | (48.8) | |||
| Sexa | ||||||||
| Male | 948 | (51.7) | 98 | (52.4) | 393 | (52.4) | 457 | (50.9) |
| Female | 886 | (48.3) | 89 | (47.6) | 357 | (47.6) | 440 | (49.1) |
| Disabilityb | ||||||||
| Yes | 16 | (0.9) | 0 | - | 4 | (0.5) | 12 | (1.3) |
| Length of stay in the childcare programc | ||||||||
| 6-11 months | 812 | (44.3) | 186 | (99.5) | 389 | (51.9) | 237 | (26.4) |
| 12-17 months | 364 | (19.8) | 1 | (0.5) | 209 | (27.9) | 154 | (17.2) |
| 18-23 months | 439 | (23.9) | 0 | - | 150 | (20) | 289 | (32.2) |
| ≥ 24 months | 219 | (11.9) | 0 | - | 2 | (0.3) | 217 | (24.2) |
aChi-square test for differences by sex and age p = 0.824.
bLambda test for disability and age (years) p ≤ 0.001.
cKendall's Tau-b between program permanence and age. p < 0.001.
Global development evaluation, before and after 6 months
Table 3 presents the results of the global development evaluation using the EDI test, both for the baseline measurement and at 6 months. As observed, 80.5% (n = 1,476) were classified with normal development (green), followed by developmental lag (yellow) in 16%, and risk of delay (red) in 3.5%. While in the evaluation, 6 months later, the number of children with normal development increased to 90.1% (n = 1,652), with the other two groups decreasing to 8.7% and 1.2%, respectively.
Table 3 Comparison of global developmental evaluation results, using the child development assessment test, at baseline and after 6 months of staying in childcare facilities (n = 1,834)
| Initial Result | Total, n (%) | Subsequent result | |||||
|---|---|---|---|---|---|---|---|
| Green n (%) | Yellow n (%) | Red n (%) | |||||
| 1,652 | (90.1) | 159 | (8.7) | 23 | (1.2) | ||
| Green | 1,476 (80.5%) | 1,391 | (94.2) | 84 | (5.7) | 1 | (0.1) |
| Yellow | 294 (16%) | 229 | (77.9) | 59 | (20.1) | 6 | (2) |
| Red | 64 (3.5%) | 32 | (50) | 16 | (25) | 16 | (25) |
It is worth highlighting that, when analyzing the data from table 3 by cohort, according to the first evaluation, there were changes in all three groups. Thus, from the normal development group, 84 (5.7%) children moved to lag and 23 (1.2%) to risk of delay. Meanwhile, of the 229 classified as yellow, the majority moved to green (77.9%), 20.1% maintained the same classification, and six children (2.0%) were classified as red. Finally, of the 64 children initially classified with risk of delay (red), in the second evaluation, half moved to green, 16 (25%) to yellow, and another 16 maintained the same classification. The percentage change between the first and second evaluations was statistically significant (p < 0.001).
Evaluation by developmental areas, before and after 6 months
Figure 2 graphically presents (in traffic light format) the percentage change children experienced after 6 months of follow-up across the five developmental areas. The X-axis of each graph shows the total cases for each category (green, yellow, and red), while the Y-axis corresponds to the percentage by category, according to the second evaluation. As observed, there was a percentage improvement in all areas in the second evaluation for participants initially classified with developmental lag (yellow) or risk of delay (red) after 6 months of staying in the facilities. However, it should be noted that a small percentage of children were initially classified as having normal development but moved to lag in the second evaluation.
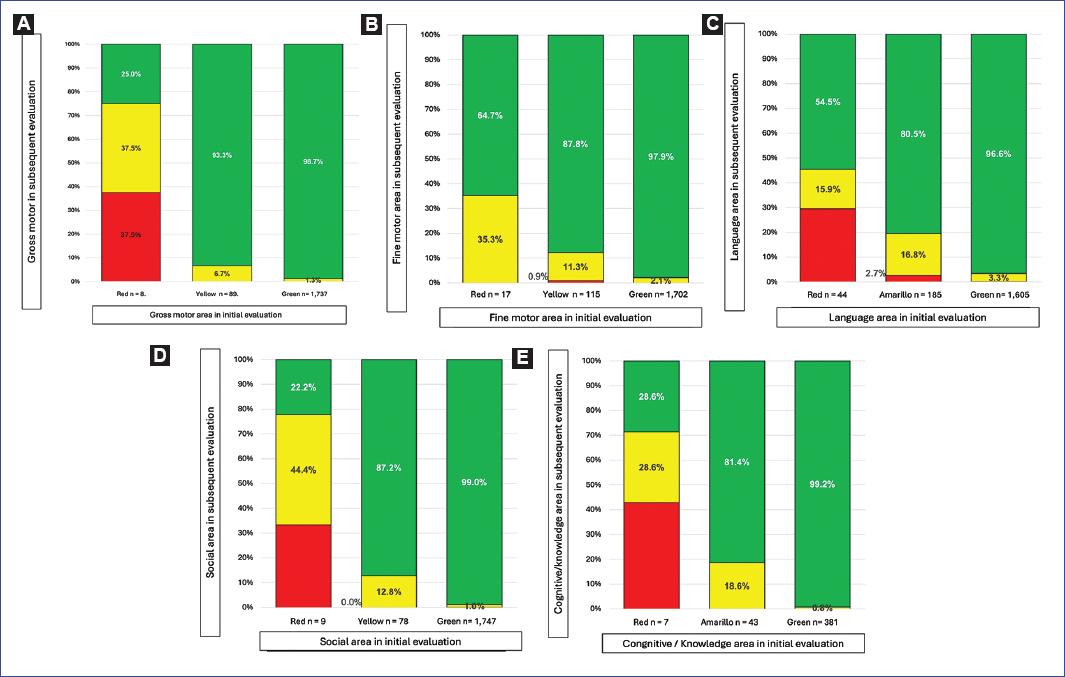
Figure 2 Comparison of baseline and subsequent results for the five evaluated developmental areas. A: gross motor. B: fine motor. C: language. D: social. E: knowledge/cognitive.
Figure 2A shows information about the gross motor area; in the first evaluation, 94.7% (n = 1,737) obtained a normal result, 4.9% (n = 89) showed developmental lag, and 0.4% (n = 8) showed risk of delay. For the second evaluation, 98.7% (n = 1714) maintained this result in the normal development group, and 1.3% (n = 23) moved to developmental lag. Of the 89 participants with lag, 93.3% (n = 83) changed to normal, and 6.7% (n = 6) remained with lag (p < 0.05). Of the children with a risk of delay result (n = 8) in the first evaluation, five improved, two changed to normal status and three to developmental lag, and the last three maintained the same result.
Improvement was most notable in the fine motor area (Fig. 2B) compared to the other four areas. As shown, in the second evaluation of the 115 initially classified with developmental lag, 101 (87.8%) changed to normal, but only one case moved to risk of delay. Meanwhile, all children with risk of delay result (n = 17) showed improvement, as 11 changed their result to normal, and six moved to developmental lag (p < 0.05).
In the language area, highly favorable percentage changes were also observed in the 6-month evaluation. As shown in figure 2C, of the 185 children with developmental lag results, 80.5% (n = 149) changed to normal results, but 5 (2.7%) changed to risk of delay. Meanwhile, of the 44 children initially classified with risk, 31 (70.4%) had a higher evaluation in the second assessment, 24 moved to normal, and seven to developmental lag (p < 0.05). However, we highlight that this area showed the highest percentage (3.3%) of children who, being normal at the start, moved to a lower classification in the second evaluation, as shown in figure 2C.
Regarding the social area, it was observed that of the total children with normal results (n = 1,747), in the second evaluation 17 (0.97%) were classified as having developmental lag and one (0.1%) moved to risk of developmental delay. In the case of the 78 with developmental lag, 87.2% (n = 68) changed to normal, and 12.8% (n = 10) remained with lag. Among the nine children at risk of developmental delay, the most significant improvement was observed, with four transitioning to developmental lag and two achieving normal development, p < 0.05 (Fig. 2D).
Finally, the knowledge area showed the smallest percentage change in improvement in the risk of delay group; of the seven children initially classified in this category, only 2 (28.6%) moved to normal, 3 (42.9%) to developmental lag, and another three maintained the same result. For the 43 children with developmental lag, in the second evaluation, 81.4% (n = 35) moved to normal, and the rest maintained the same classification, p < 0.05 (Fig. 2E).
Discussion
The findings of this study confirm the benefits of incorporating childcare facilities (in this study, belonging to the PEI program) for children from early life stages to promote optimal development. The different results presented showed a very significant favorable change in the percentage of children who initially did not have development considered normal after staying 6 months in these centers.
These results corroborate previous findings in which our group, through a cross-sectional study, reported that children who spend more time in childcare facilities show an increased prevalence of normal development16. However, it should be emphasized that, unlike the previous study regarding the association between longer stay and improved neurodevelopment, the prospective design of the present research provides greater validity from both methodological and causality perspectives.
It is interesting to highlight that studies evaluating child development in the general population using the EDI test19 have reported a 3.1% decrease in the proportion of children with normal development at age 3 when compared to 1-year-old children. According to the results of this study, it is possible to consider that attendance at childcare facilities could be a protective factor to prevent or improve developmental problems, similar to what has already been documented by other authors regarding the benefits of preschool education5,6,20.
In 2011, an evaluation of the PEI was carried out, and a positive impact was found in personal-social and communication areas13,14. The results of the present study are consistent in both developmental areas. However, it was also possible to determine that there is a positive effect on gross motor, fine motor, and cognitive areas. To understand these benefits, one should consider the different activities carried out in childcare facilities, which include interaction with children of similar ages through integration in games or during mealtimes. In addition, in these facilities, educational activities include drawing, painting, cutting, and singing, among others, together with physical activities, both individual and in group.
A notable point is what was observed in the knowledge development area, as it showed the lowest percentage of benefit; this could be due to the smaller number of children evaluated compared to other areas or because there are factors both within the facilities and external that were not evaluated in this study. For example, children spend limited time in the facilities, with more time spent at home, so it is possible that they do not continue practicing what they learned at home, or there could be a deleterious effect of malnutrition. Therefore, further studies are necessary to determine the role of these potential confounding factors.
Furthermore, the results of this study should be interpreted with some caution, as they likely cannot be extrapolated to other populations. What seems most important to note is that the studied population corresponds to a highly vulnerable group due to their low socioeconomic status. Hence, it is recommended to conduct studies that evaluate whether the positive effect of childcare facilities on neurodevelopment is observed in other population groups without social or economic disadvantages, and even by gender.

