


 nueva página del texto (beta)
 Inglés (pdf)
 Artículo en XML
 Referencias del artículo
 Enviar artículo por email
 Citado por SciELO
  Similares en
SciELO
Similares en
SciELO 
 Permalink
Introduction
Pediatric obesity (OB) is a global public health problem, with prevalence increasing from 0.7% to 5.6% in females and from 0.9% to 7.8% in males between 1975 and 20161. A similar trend has been observed in Chile, with prevalence rising from 15.9% in 2011 to 31.0% in 20212. OB is one of the primary factors contributing to the development of metabolic syndrome (MS)3, whose worldwide prevalence ranges from 10.7% to 30.2% in the pediatric population4. In Chile, the prevalence in the pediatric population is 26.5%5. Although various expert panels have defined different criteria for classifying the presence of MS, they all consistently identify metabolic disruption by the alteration of four components: glucose metabolism, blood pressure (BP), dyslipidemia, and abdominal OB6.
Interestingly, fasting glucose metabolism disruption is not common in the pediatric population7. Conversely, hyperinsulinemia and insulin resistance appear to play a more significant role in the development of MS in this population8. Therefore, due to the epidemiological relevance and the multiple comorbidities associated with MS, it is essential to conduct studies that provide a Latin American perspective on the diseases prevalence. Thus, this study aimed to determine the prevalence of MS and the association of its components, including fasting insulin and the homeostatic model assessment (HOMA) index, in the pediatric population with overweight (OW), OB, and severe OB (SOB).
Method
Participants
A retrospective study was conducted using anonymous data from the pediatric inpatients at the Sports Medicine Unit of Hospital Dr. Exequiel González Cortés from July 2020 to July 2021. The inclusion criteria were pediatric patients aged 7-17 years with OW (body mass index by z-score [BMI-z] > 1 standard deviation [SD] by sex and age), OB (BMI-z > 2 SD), and SOB (BMI-z > 3 SD). The exclusion criteria were genetic syndromes associated with OB (e.g., Prader-Willi syndrome) and diseases not related to OB but affecting metabolic parameters, such as type 1 diabetes mellitus, primary dyslipidemias, and secondary arterial hypertension.
Data from 122 participants (12.98 ± 2.53 years; 69 female and 53 male) were collected and divided into three groups: OW, OB, and SOB. Table 1 shows the baseline characteristics of the participants and the group divisions: OW versus OB versus SOB. The study was approved by the Servicio de Salud Metropolitano Sur Ethical Committee (code: 63-31082021) following the Helsinki Declaration on ethical principles.
Table 1 Clinical characteristics of the sample and comparison of the dependent variables concerning its nutritional state
| Variable | Total sample (n = 122) | Overweight (n = 34) | Obese (n = 57) | Severely obese (n = 31) | p | ||
|---|---|---|---|---|---|---|---|
| OW versus OB | OW versus SOB | OB versus SOB | |||||
| Metabolic syndrome prevalence (%) | 40.1 | 11.7 | 36.8 | 77.4 | - | - | |
| Age (years) | 12.9 ± 2.5 | 13.2 ± 2.1 | 13.1 ± 2.5 | 12.4 ± 2.9 | 0.66 | 0.20 | 0.31 |
| Body weight (kg) | 71.7 ± 22.2 | 57.5 ± 12.1 | 71.7 ± 17.3 | 87.3 ± 28.6 | 0.0011 | < 0.0001 | 0.0005 |
| Height (cm) | 154.7 ± 13.1 | 153.1 ± 11.3 | 155.8 ± 13.1 | 154.6 ± 14.8 | 0.35 | 0.65 | 0.68 |
| BMI (kg/m2) | 29.2 ± 5.8 | 24.2 ± 2.3 | 28.9 ± 3.2 | 36.1 ± 6.5 | < 0.0001 | < 0.0001 | < 0.0001 |
| BMI-z (SD) | 2.4 ± 0.7 | 1.5 ± 0.3 | 2.5 ± 0.2 | 3.4 ± 0.3 | < 0.0001 | < 0.0001 | < 0.0001 |
| Waist circumference (cm) | 81.7 ± 13.6 | 82.1 ± 6.9 | 91.1 ± 9.7 | 103.7 ± 16.3 | 0.0002 | < 0.0001 | 0.0029 |
| WHtR (points) | 0.59 ± 0.07 | 0.54 ± 0.04 | 0.58 ± 0.04 | 0.67 ± 0.06 | < 0.0001 | < 0.0001 | < 0.0001 |
| Triglycerides (mg/dL) | 121.6 ± 67.5 | 94.8 ± 45.9 | 122.7 ± 68.2 | 148.7 ± 76.3 | 0.06 | 0.001 | 0.06 |
| HDL cholesterol (mg/dL) | 43.1 ± 10.0 | 45.3 ± 11.3 | 43.8 ± 8.7 | 39.5 ± 10.3 | 0.60 | 0.0041 | 0.0073 |
| Fasting glycemia (mg/dL) | 94.5 ± 12.6 | 93.9 ± 9.8 | 96.3 ± 16.0 | 91.9 ± 6.5 | 0.45 | 0.65 | 0.22 |
| Fasting insulin (mU/L) | 29.0 ± 21.5 | 19.4 ± 7.5 | 29.7 ± 16.7 | 36.9 ± 31.8 | 0.0031 | 0.0008 | 0.46 |
| HOMA index | 6.7 ± 5.4 | 4.5 ± 1.8 | 7.0 ± 4.3 | 8.4 ± 7.9 | 0.0036 | 0.0036 | 0.64 |
| Systolic blood pressure (mm/Hg) | 116.2 ± 11.1 | 113.1 ± 8.9 | 116.4 ± 11.2 | 119.4 ± 12.4 | 0.07 | 0.0056 | 0.18 |
| Diastolic blood pressure (mm/Hg) | 68.7 ± 10.7 | 65.6 ± 9.5 | 69.2 ± 11.3 | 71.1 ± 10.6 | 0.04 | 0.02 | 0.54 |
HDL: high-density lipoprotein; HOMA: homeostatic model assessment OB: obesity group; OW: overweight group; WC: waist circumference; SD: standard deviation; SOB: severe obesity group; WHtR: waist-to-height ratio.
Measurements
METABOLIC SYNDROME DIAGNOSIS
We used Cook et al.9 to diagnose MS. These criteria include the following values: triglycerides ≥ 110 mg/dL, high-density lipoprotein (HDL) cholesterol ≤ 40 mg/dL, waist circumference (WC) ≥ 90 percentile for sex, age, and height, fasting glucose ≥ 100 mg/dL, and BP ≥ 90 percentile for sex, age, and height. Participants meeting three or more of these criteria were considered to have MS. Fasting insulin and HOMA index values ≥ 90 percentile for sex and age10 were used not as diagnostic criteria but to quantify abnormal values for these variables.
ANTHROPOMETRIC
Weight and height were determined using a SECA® beam balance and stadiometer. Based on the weight and height measurements, BMI and BMI-z scores were calculated. WC was measured using a non-stretchable measuring tape11. The values used to determine percentiles by sex and age were collected from the study by Fernandez et al.12 The waist-to-height ratio (WHtR) was calculated using the height and WC values.
LIPID PROFILE AND GLYCEMIC CONTROl
Venous blood samples were collected after a fasting period of 8-12 h at the Hospital of Dr. Exequiel González Cortés. Data from the venous samples were used to calculate the lipid profile (triglycerides and HDL cholesterol) and assess glycemic control (glycemia and insulin). The HOMA index was calculated by dividing fasting insulin (mU/L) by glycemia (mg/dL)/405.
BLOOD PRESSURE
A sports medicine professional measured BP on an outpatient basis using equipment appropriate for the patients arm length and age, following the protocol by Flynn et al.13 The obtained data were classified by sex, height, and age, according to the normative values provided in the clinical guidelines for the diagnosis and management of high BP in the pediatric population13.
Statistical analysis
The normality of the sample was assessed using the Shapiro-Wilk test. A one-way analysis of variance was conducted to determine differences in the dependent variables among the OW, OB, and SOB groups. A X2 test was used to determine the odds ratio (OR) for the MS variable in these groups. A Students t-test was performed for the bivariate analysis to identify associations between the components of MS and its development. Statistical analysis was performed using PRISM 8.0 (GraphPad®, California), with statistical significance set at p < 0.05. Data were presented as mean ± SD.
Results
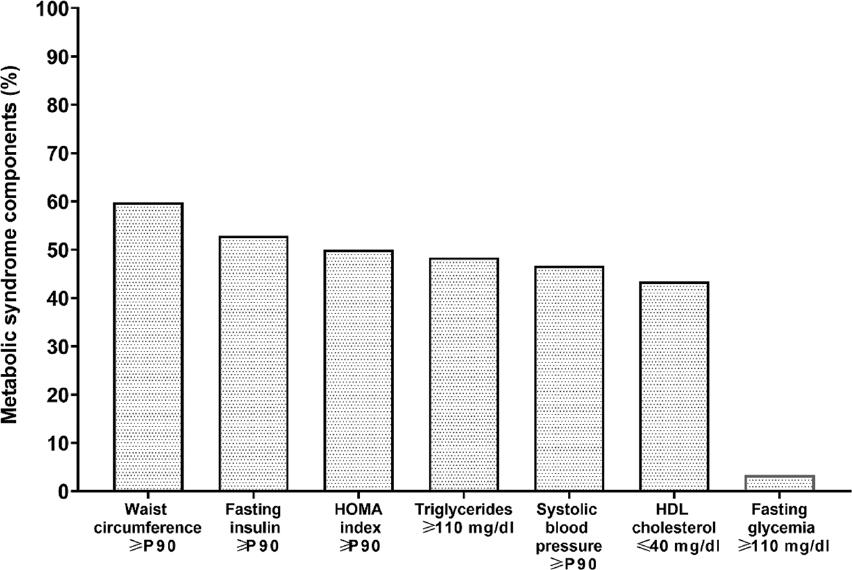
PERCENTAGE OF MS COMPONENT OCCURRENCE
The MS component with the highest prevalence (59.8%) was high WC, followed by abnormal values for fasting insulin (52.9%) and the HOMA index (50%). Triglycerides ranked fourth (48.4%), followed by HDL cholesterol (43.4%). Fasting glycemia had the lowest prevalence (3.3%). Figure 1 illustrates the occurrence of MS components.
MS prevalence
The prevalence of MS in the sample (n = 122) was 40.1%. When separating the data by nutritional status, the OW group (n = 34) had a prevalence of 11.7%, the OB group (n = 57) showed 36.6%, and the SOB group (n = 31) had a prevalence of 77.4%. No significant differences in weight, height, and fasting glycemia were found between the OW, OB, and SOB groups. However, significant differences were observed between the BMI, BMI-z, WC, and WHtR groups. Triglycerides and HDL cholesterol showed significant differences between the OW and SOB groups, whereas fasting insulin, the HOMA index, and systolic and diastolic BP showed significant differences between the OW versus OB and OW versus SOB groups. Details for each variable are presented in table 1.
MS OR
Significant differences in the OR for the development of MS were found between the OW and OB groups (OR 4.3; 95% CI 1.3-12.6; p = 0.014), OW and SOB groups (OR 25.71; 95% CI 6.7-80.2; p < 0.0001), and OB and SOB groups (OR 5.7; 95% CI 2.1-14.5; p = 0.0003).
Association between MS components and MS developing
The bivariate analysis showed an association between WC (p < 0.001), WHtR (p < 0.001), triglycerides (p < 0.001), HDL cholesterol (p < 0.001), systolic BP (p = 0.0012), fasting insulin (p = 0.004), and the HOMA index (p = 0.0007) and the development of MS. Fasting glycemia alone did not show an association (p = 0.13) with the development of MS. Details of the values for each variable are presented in table 2.
Table 2 Association between the metabolic syndrome components and the metabolic syndrome development in the pediatric population
| Variable | Bivariate analysis | |||
|---|---|---|---|---|
| Mean ± SD. Metabolic syndrome absence | Mean ± SD. Metabolic syndrome presence | 95% CI | p | |
| Waist circumference (cm) | 86.6 ± 10.1 | 98.4 ± 14.8 | 16.5-−7.1 | < 0.0001 |
| WHtR (points) | 0.56 ± 0.05 | 0.62 ± 0.06 | −0.08-−0.04 | < 0.0001 |
| Triglycerides (mg/dL) | 90.9 ± 46.0 | 161.5 ± 67.5 | −92.8-48.4 | < 0.0001 |
| HDL cholesterol (mg/dL) | 47.0 ± 10.4 | 38.0 ± 6.7 | 5.9-12.1 | < 0.0001 |
| Fasting glycemia (mg/dL) | 93.3 ± 7.6 | 96.1 ± 17.0 | −7.9-2.2 | 0.13 |
| Fasting insulin (mU/L) | 21.9 ± 12.2 | 37.0 ± 26.2 | −23.6-−6.4 | 0.0004 |
| HOMA index | 5.0 ± 3.0 | 8.6 ± 6.7 | −5.7-−1.4 | 0.0007 |
| Systolic blood pressure (mm/Hg) | 113.6 ± 10.2 | 119.7 ± 11.3 | −9.9-2.2 | 0.0012 |
95% CI: confidence interval 95%; HDL: high-density lipoprotein; HOMA: homeostatic model assessment; SD: standard deviation; WHtR: waist-to-height ratio.
Discussion
The study results showed an MS prevalence of 40.1% among all participants. The prevalence differed according to nutritional status, with 11.7% in the pediatric population with OW, 36.3% in those with OB, and 77.4% in those with SOB. These prevalence rates in the Chilean population are significantly higher than the reported international range (10.7-30.2%)4. We hypothesize that the higher overall prevalence may be due to two factors. The first factor is the sustained increase in OB prevalence within the study sample (Chilean pediatric population), which doubled from 15.9% to 31% between 2011 and 20212. OB is one of the primary causes of MS in the pediatric population3. Second, the sample was collected during the COVID-19 pandemic, during which several studies reported a global decrease in physical activity levels and an increase in sedentary time among the pediatric population14. Specifically, physical activity levels decreased by 21.6% (46.8 min), 32.4% (56.6 min), and 24.1% (39.5 min) in Chilean15, Mexican16, and the United States Latin populations16, respectively. Similarly, sedentary time increased by 183% (83.4 min), 204% (91.8 min), and 182% (88.5 min) in Chilean15, Mexican16, and the United States Latin populations16, respectively. Thus, decreased physical activity and increased sedentary time negatively impact components of MS17. Consequently, negative changes have been reported in body composition18, including increases in WC by 4.4 cm and 0.02 points in the WHtR19. Similarly, metabolic control observed negative changes, with triglyceride increasing by 33.9 mg/dL20 and fasting glucose by 9.2 mg/dL20. In addition, systolic BP increased by 6.6 mmHg in the pediatric population with COVID-19 infection symptoms21. HDL cholesterol was the only MS component unaffected during the COVID-19 pandemic20,22. Therefore, if the COVID-19 pandemic impacts 4-5 components of MS, it could play a significant role in the higher prevalence of MS in the pediatric population.
The results regarding nutritional status and MS prevalence align with those reported by several authors5,23, showing an increased OR for developing MS in the OW versus OB (OR 4.3), OW versus SOB (OR 27.51), and OB versus SOB (OR 5.7). This increase may be explained by the transition from OW to obese to severely obese, which results in a greater accumulation of adipose tissue, particularly visceral adipose tissue24. These results support this hypothesis, as indicated by the WC values (82.1 cm vs. 91.1 cm vs. 103.7 cm) and WHtR (0.54 vs. 0.58 vs. 0.67) among the OW, OB, and SOB groups. Interestingly, both WC and WHtR were associated with the development of MS (p < 0.0001). In addition, WHtR was associated with negative values for fasting glycemia, triglycerides, HDL cholesterol, and systolic BP25. Furthermore, WHtR cutoff points of 0.45 in females and 0.47 in males are strong predictors (with high specificity and sensitivity) of MS26. Therefore, visceral adipose tissue accumulation may be a principal factor in developing and maintaining MS in the pediatric population27. According to previous reports, rapid hypertrophy of visceral adipose tissue in response to OB can lead to adipocyte dysfunction, characterized by adipocyte hypoxia, increased pro-inflammatory cell infiltration, oxidative stress, and adipocyte apoptosis28,29. As a result, a pro-inflammatory cycle known as systemic low-grade inflammation occurs28. This systemic inflammation has several consequences, including insulin resistance in adipose tissue due to decreased adiponectin secretion30 and inhibition of the glucose transporter type 4 phosphorylation cascade in skeletal muscle28. Consequently, these processes lead to systemic insulin resistance, hyperinsulinemia, dyslipidemia28,31, and high BP associated with endothelial dysfunction28,32.
Interestingly, our results did not correlate fasting glycemia and MS development. In contrast, we found an association between fasting insulin (p = 0.0004) and the HOMA index (p = 0.0007) with the development of MS. This discrepancy may be due to the infrequent disruption of fasting glycemia in the pediatric population. For instance, Shi et al.33 reported a 1.72% disruption rate, Juárez López et al.34 reported 4%, and Chen et al.35 reported a 2.5%, similar to the 3.3% disruption rate found in our study (Fig. 1). In contrast, the pediatric population with adverse fasting insulin values ranged from 35.8%36 to 56%34. Similarly, the adverse values for the HOMA index reached 51%34 and 66%36. These values were comparable to our results of 52.9% for fasting insulin and 50% for the HOMA index. Normal fasting glycemia values are initially maintained by compensatory hyperinsulinemia due to normal pancreatic β cell function37. However, chronic pro-inflammatory and pro-oxidant conditions, along with an overload of hyperinsulinism secretion, can lead to apoptosis of these β cells38. Fasting hyperglycemia will occur when pancreatic β cell function drops under 15%39. Similarly, individuals with compensatory hyperinsulinemia may experience a failure in fasting glycemic control after 3 years of follow-up40. Therefore, we suggest that this studys pediatric population with OW, OB, and SOB may be in a period of compensatory hyperinsulinemia without disruption of fasting glycemia.
One of the main strengths of this study is the valuable information provided during the COVID-19 pandemic, offering updated data on the Latin American population. This contribution enriches the existing scientific literature by addressing a relevant and timely topic. However, notable limitations include the absence of a representative normal-weight group, which may affect the generalizability of the findings to populations with different body compositions. In addition, the small sample size, which focuses exclusively on OW and obese individuals, may overestimate the prevalence of the condition compared to the general Chilean population. Furthermore, using diagnostic criteria from Cook et al.9, originally designed for adolescents aged 12-19, may not fully capture the metabolic characteristics of younger children within the studied age range.

