


 nueva página del texto (beta)
 Inglés (pdf)
 Artículo en XML
 Referencias del artículo
 Enviar artículo por email
 Citado por SciELO
  Similares en
SciELO
Similares en
SciELO 
 Permalink
Introduction
Assessing waiting times for access to hospital services is relevant for public health systems seeking to expand their coverage1-4. Lengthy waiting times influence the perception of quality of care, user satisfaction5,6, and health service planning, often perceived as inadequate7. Consequently, waiting times serve as indicators of service delivery efficiency2.
Theory suggests that waiting times increase when demand exceeds service capacity2,8,9. However, organizational factors can affect waiting times independently of demand. In hospital bed management, up to 97% of incidents that increase waiting times involve clinical or administrative causes10-14. These delays lead to the loss of useful hospitalization days and create long queues for scheduled admissions14-16.
Hospital structures focused on specialized work may impede the coordination of patient flow through multiple internal processes5,10,17. Health services commonly experience deficiencies in administrative processes, including unnecessary steps, avoidable delays, bottlenecks, and poor utilization of human and physical resources. These issues contribute to extended patient waiting times, even when care capacity is sufficient18. In addition, waiting times can induce anxiety in patients and their companions19.
Various strategies have been implemented to improve hospital management processes9. Evidence supports enhancing existing service capacity or modifying local organizational behavior at the local level7. In this context, process re-engineering may facilitate improvements in both productivity and quality of care20,21.
While waiting lists for elective surgery have been extensively studied, the hospital admission process itself is often excluded from common definitions and monitoring points1-3,8,9. Studies typically describe time to initial consultation, time to diagnosis, and time to procedure scheduling9,20,22. However, waiting times for hospital admission have not been as thoroughly investigated as those for emergency admissions1.
This study aimed to estimate and compare waiting times and delay-causing events during the hospitalization of pediatric patients undergoing elective surgery in three different modalities over a week. The investigation spans from the patient and caregivers arrival at the hospital until the patient occupies the assigned hospital bed.
Method
Study setting
The Hospital Infantil de México Federico Gómez is a tertiary care National Health Institute located in Mexico City that provides medical services to a very low-income population. The hospital also conducts research and teaching activities. It has 220 beds and nine operating theaters. Before the severe acute respiratory syndrome coronavirus 2 pandemic, the number of surgical interventions was 3,697, and the occupancy rate for surgical assistance was 64.8%, corresponding to 41.3% of hospital discharges. The Department of Surgery is divided into 11 specialties. General Surgery performs the most operations (39.2%), receiving patients from several services without surgical consultation (Endocrinology, Diabetes Clinic, Infectious Diseases, and anorectal oncological surgery). The remaining operations correspond to specialties with their own surgical consultation: Orthopedics, Oncology, Ophthalmology, Otolaryngology, Urology, Plastic Surgery, Cardiovascular Surgery, Thoracic Surgery, Stomatology, and Neurosurgery. In these specialties, 90.7% of elective surgical procedures involve a hospital stay of more than 24 h23.
Admission for elective surgery
The scheduling of elective procedures is the responsibility of the attending physicians of each surgical specialty, who are assigned to each specialty during working days and morning shifts. Hospital admission involves three general stages: medical and surgical assessment, hospital admission procedures, and transfer to the inpatient service.
Study design
A prolective comparative cohort study was designed, comprising three cohorts: (A) weekday admissions, primarily general surgery, and oncology, (B) weekday admissions of specialties with their own surgical consultation, and (C) surgical specialties with weekend admissions.
Ethical approval
This study was reviewed and approved by the Hospital Research, Biosafety, and Research Ethics Committees under protocol number HIM-2022-073. Informed consent was obtained from accompanying parents, and assent was obtained before direct non-participant observation for children older than 7 years. Patient and caregiver privacy was protected by avoiding the dissemination of sensitive and identifiable information.
Participants
The study included patients scheduled for elective surgical procedures in any surgical specialty service of the hospital during 4 months of 2022 who were ≤ 18 years of age and had provided signed informed consent and assent. Patients whose scheduled surgeries were converted to emergency procedures due to changes in their health status were not included. Exclusion criteria were voluntary withdrawal under the terms of the informed consent/assent or rescheduling of the surgical admission.
Sample design
To estimate the waiting time for admission, a sample of 14 follow-ups per cohort was calculated based on a finite population of 3,697 annual surgeries23, a variance of 0.92 h2 from an initial pilot study, and an absolute precision of 0.5 h with 95% confidence. In addition, the sample size required for a hypothesis test of mean difference among three groups was calculated as 22 follow-ups per cohort, assuming a minimum difference of 1 h between groups, with 80% power and 95% confidence.
Non-probabilistic quota sampling was employed for each specialty, as the dynamics of the scheduling lists precluded the probabilistic selection of scheduled admissions.
Variables studied
Waiting time was defined as the time between the patient's arrival at the surgical admission consultation and their placement in the assigned hospital bed.
A delay incident was defined as any circumstance that, directly or indirectly, negatively affects the sequence of the planned admission process and results in increased hospital waiting time. This variable included both the frequency and duration (hours or minutes) of observed delay incidents within the admission process.
Additional demographic variables collected were age, sex, diagnosis, comorbidities, admitting surgical specialty service, need for mobility assistance (wheelchair, stretcher, other assistive devices), communication barriers (related to health problems), and history of surgery in the hospital.
Method of observation and monitoring
A multidisciplinary group of observers (eight members) was formed, with one researcher serving as lead trainer in the non-participant direct observation method. This method involves placing the observer in contact with the hospital admission process while collecting information externally, without intervention in the social group or process under study24,25. A three-week pilot study was conducted to standardize the recording method, identify appropriate spaces for follow-up, and delineate the segments of the admission process in each surgical specialty. Three distinct groups were identified in the admission process.
Data collection
Three forms were developed to record timing during the admission process, considering the operational characteristics of surgical specialties and any observed delays. Mobile phones with synchronized clocks were used for the measurements.
Patient contact and follow-up
The list of scheduled surgical patients was obtained at least 24 h before their admission appointment. Parents were contacted by telephone to confirm their hospital appointment attendance, explain the general nature of the study, and arrange a meeting time and location with the investigators before their admission appointment. At the hospital, the studys nature was explained in detail to the patient and caregiver, and the required informed consent or assent was obtained. Follow-up began when the patient and family member reported their arrival at the outpatient consultation area. The start and end times (in hours and minutes) of each hospital admission process stage were recorded. Monitoring concluded when the nurse in charge of the service instructed the patient and caregiver to occupy the designated bed.
Process mapping
Process mapping methodology was used to represent the existing admission process, following basic principles: process identification, data collection, map generation, process analysis, and action planning. A flowchart was used as the modeling tool for mapping the programmed admission process, developed through presentation and discussion of various sketches among the researchers26,27.
Statistical analysis
Qualitative variables (gender, age group, comorbidity, mobility assistance, communication barriers, and previous surgery) were summarized as relative frequencies and percentages (%). The age group was determined by categorizing the patient's age, which was calculated using the patients date of birth and admission follow-up date. The categories were: newborn (< 29 days), infant (29 days-23 months), pre-school (24 months-71 months), school (72 months-143 months), and adolescent (≥ 144 months). The percentage of admissions per hour was also determined for each cohort.
Continuous quantitative variables (age [years], waiting time [h], cumulative delay time [h], and delay-free waiting time [h]) were summarized using estimates of central tendency and dispersion appropriate to the type of distribution.
The point estimate and 95% confidence interval (95% CI) were calculated for waiting time in the whole sample, in the cohorts, and for each surgical specialty service. Using the estimated waiting times, we calculated the percentage of follow-ups that adhered to the World Health Organization (WHO) recommendations of ≤ 4 h for hospital admission28.
The delay-free waiting time was calculated for each follow-up by subtracting the time spent on delay incidents from the total waiting time. This calculation was performed for each stage of the admission process: medical and surgical assessment, admission procedure, and transfer to the inpatient ward.
The distribution of variables (sex, age group, comorbidity, mobility aid, communication barrier, and previous surgery) was compared among cohorts A, B, and C. χ2 test was used, or Fisher's exact test when sample sizes were small.
When distribution and homoscedasticity criteria between groups were met, waiting times between cohorts and their segments were compared using Kruskal-Wallis tests or one-way analysis of variance with Tukey's post hoc test. For independent pairs with normal distribution, Student's t-test was used; for non-normally distributed independent pairs, the Mann-Whitney U test was applied.
The paired t-test was used to compare the delay-free waiting time with the original waiting time for the entire group. Comparisons between each cohort's waiting time and its adjusted counterpart were performed according to the parametric distribution type of the pairs: Wilcoxon test for cohort A and paired t-test for cohorts B and C. All statistical analyses were performed using SPSS software version 25, with statistical significance set at 95% (α = 0.05).
Results
The study included sixty-seven follow-ups across 11 surgical specialties. Sampling quotas were balanced, except for neurosurgery and otolaryngology. General surgery represented the highest scheduling volume (35.8%), followed by orthopedics (10.4%) (Table 1).
Table 1 Composition of the sample by surgical specialty
| Surgical specialty | Follow-ups carried out, n (%) | Expected sample, n (%) | Admission group* |
|---|---|---|---|
| General surgery | 24 (35.8) | 21 (32.5) | A, C |
| Oncology | 5 (7.7) | 5 (7.2) | A |
| Orthopedics | 7 (10.4) | 5 (7.7) | B |
| Ophthalmology | 6 (9.0) | 4 (5.5) | B |
| Otorhinolaryngology | 6 (9.0) | 3 (4.9) | B |
| Urology | 5 (7.5) | 5 (8.1) | B, C |
| Plastic surgery | 5 (7.5) | 4 (6.7) | B, C |
| Cardiovascular surgery | 3 (4.5) | 4 (6.5) | B, C |
| Thoracic surgery | 3 (4.5) | 2 (2.8) | B, C |
| Stomatology | 2 (3.0) | 5 (7.2) | B |
| Neurosurgery | 1 (1.5) | 7 (10.9) | B, C |
| Total | 67 | 66 |
*Admission group: A: general surgery admission on weekdays. B: other specialties admission on weekdays. C: weekend specialties admission.
The baseline patient characteristics are presented in table 2. Cohort B showed a higher proportion of patients requiring in-hospital mobility assistance, including wheelchairs, stretchers, oxygen tanks, and strollers, among others.
Table 2 Patient characteristics included in the study
| Characteristics | Total (n = 67) | Cohort A (n = 27) | Cohort B (n = 22) | Cohort C (n = 18) |
|---|---|---|---|---|
| Sex, n (%) | ||||
| Male | 33 (49.3) | 20 (74.1) | 11 (50.0) | 3 (16.7) |
| Female | 34 (50.7) | 7 (25.9) | 11 (50.0) | 15 (83.3) |
| Age group, n (%) | ||||
| Neonates | 1 (1.5) | 1 (3.7) | 0 | 0 |
| Infants | 10 (14.9) | 3 (11.1) | 3 (13.6) | 4 (22.2) |
| Children | 38 (56.7) | 16 (59.3) | 16 (72.7) | 6 (33.3) |
| Adolescents | 18 (26.9) | 7 (25.9) | 3 (13.6) | 8 (44.4) |
| Comorbidities, n (%) | ||||
| Yes | 22 (32.8) | 10 (37.0) | 8 (36.4) | 4 (22.2) |
| No | 45 (67.2) | 17 (63.0) | 14 (63.6) | 14 (77.8) |
| Mobility assistance, n (%) | ||||
| Yes | 13 (19.4) | 2 (7.4) | 9 (40.9) | 2 (11.1) |
| No | 54 (80.6) | 25 (92.6) | 13 (59.1) | 16 (88.9) |
| Communication barriers, n (%) | ||||
| Yes | 14 (20.9) | 4 (14.8) | 8 (36.4) | 2 (11.1) |
| No | 53 (79.1) | 23 (85.2) | 14 (63.6) | 16 (88.9) |
| Prior surgeries, n (%) | ||||
| Yes | 37 (55.2) | 16 (59.3) | 15 (68.2) | 6 (33.3) |
| No | 30 (44.8) | 11 (40.7) | 7 (31.8) | 12 (66.7) |
Admission cohort. A: general surgery admission on weekdays. B: other specialties admission on weekdays. C: weekend specialties admission.
Mapping the hospital admission process
The admission process was illustrated using a general flow chart (Fig. 1). Three main differences were identified between cohort A and cohort B.
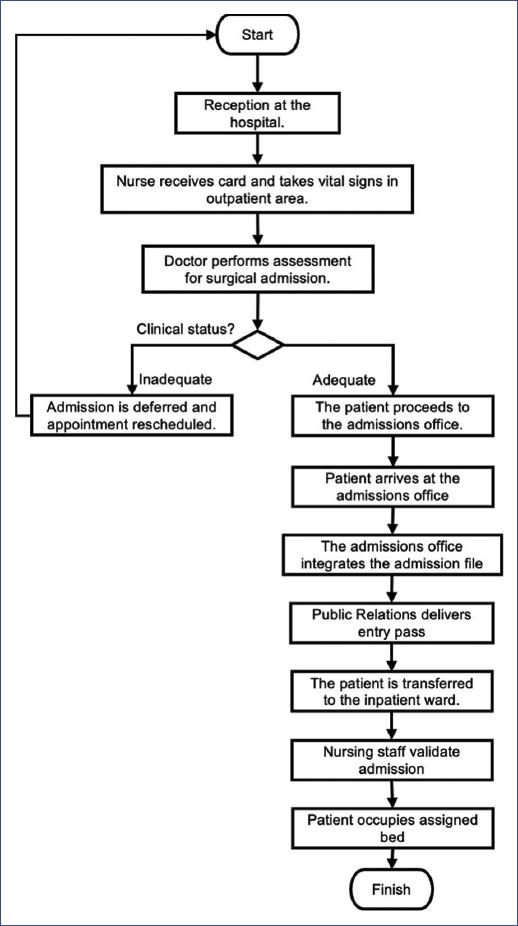
Time and order of consultation
In cohort A, 89% of consultations were scheduled between 11:00 and 12:00, followed by medical assessment between 12:00 and 15:00. In cohort B, 78% of consultations were scheduled between 09:00 and 11:00, with care provided on a first-come, first-served basis between 09:00 and 15:00.
Consultation dynamics
In cohort A, a pediatrician and surgeon performed the assessment simultaneously. In cohort B, the pediatrician and surgeon conducted assessments at different times, resulting in an additional 0.5-h wait.
Transfer to admission
Following medical and surgical assessment, the children and their companions proceeded to the admission office. In cohort A, a resident pediatrician accompanied the patient and caregiver to the admission area. In cohort B, other specialties directed patients to the admission office, typically at 15:00, resulting in extended waiting times. In cohort C, patients were discharged and completed admission procedures over the weekend.
No significant differences were observed in admission procedures. Public relations staff provided information about admission and hospital rules to all scheduled admissions gathered in the admission area between 15:00 and 17:00, regardless of arrival time.
Waiting time for hospital admission
The estimated waiting time in the elective admission process was 6.9 h (± 1.3 h). The 95% CI for this parameter was between 6.6 and 7.2 h (Table 3). Significant differences were observed among the waiting times of cohorts A, B, and C (p < 0.0001). The comparison between cohorts B and A showed a significant difference of 1.8 h (p < 0.0001), while cohorts B and C differed by 1.9 h (p < 0.0001). Direct comparison between waiting times of cohorts A and C revealed no difference (mean difference 0.08 h, p = 0.956). Only 6% of total admissions met the WHO recommendation of waiting time ≤ 4 h, while 7.5% of admissions exceeded 9 hours. Most admissions (70.1%) were completed between 16:00 and 18:00.
Table 3 Waiting times for scheduled surgical admission
| Surgical admission process | Waiting time (h) | |
|---|---|---|
| x̅ (± SD) | 95%CI | |
| Global estimate | 6.9 (± 1.3) | 6.6-7.2 |
| Cohort A | 6.4 (± 0.7) | 6.1-6.6 |
| Cohort B | 8.1 (± 0.9) | 7.7-8.5 |
| Cohort C | 6.3 (± 1.5) | 5.6-7.0 |
SD: sample standard deviation; 95%CI: confidence interval with 95% confidence; x̅: arithmetic mean. Admission cohort. A: general surgery admission on weekdays. B: other specialties admission on weekdays. C: weekend specialties admission.
Stages of the admission process
The two longest stages of the admission process were medical-surgical assessment (3.3 ± 0.9 h) and admission formalities (3.6 ± 1.3 h). No significant difference was found among the three cohorts in the first phase (p = 0.305). In the second stage, cohorts A (3.3 ± 0.9 h) and C (2.7 ± 0.9 h) differed significantly from cohort B (4.6 ± 0.9 h) (p < 0.0001).
Delay incidents
One hundred delay incidents were identified in the scheduled admission process, including 16 external to the admission process. External incidents comprised leaving care areas (n = 4), arriving hours before scheduled appointments (n = 4), and essential medical procedures during assessment (n = 8) such as cast removal, electrocardiograms, and blood sampling. The remaining 84 delay incidents occurred across 52 follow-ups, with varying distribution per follow-up. Fifteen follow-ups (22.4%) experienced no delays during the admission process.
The most significant delays in terms of duration and frequency occurred during transfer to the admission procedure area (average delay 98 min), unavailability of beds (average delay 88 min), and lack of admission staff due to shift changes (average delay 46 min). These three delay types accounted for 63.9% of total delay time (Table 4).
Table 4 Category of delay in the surgical admission process
| Category | n = 84 (%) | Cumulated delay (min) | Average delay (min)† |
|---|---|---|---|
| Delayed arrival at the admission office. | 17 (20.2) | 1658 | 98 |
| Bed unavailable due to multiple causes. | 12 (14.3) | 1050 | 88 |
| Shortage of hospital admissions staff. | 20 (23.8) | 916 | 46 |
| Downtime between consultations | 13 (15.5) | 735 | 57 |
| Delayed processing at the admissions office | 13 (15.5) | 665 | 10 |
| Communication issues between medical and administrative staff. | 3 (3.5) | 322 | 107 |
| Administrative delay before surgical assessment | 3 (3.6) | 258 | 86 |
| Delays before admission to the inpatient ward | 3 (3.5) | 60 | 20 |
†The delay average was calculated based on the total number of patients studied. This information was then used to estimate the type of delay in each cohort.
Delays resulted in three major periods of inactivity: waiting time for surgical consultation (mean 102 min, maximum 238 min), transfer to the admission area for cohort B patients (mean 51 min, maximum 242 min), and waiting time for admission to the inpatient service (mean 79 min, maximum 166 min).
Delay-free waiting time
The estimated delay-free waiting time was 5.5 h (± 1.5 h), representing a reduction of 1.4 h compared to the actual waiting time (p < 0.0001). Some cases with waiting times exceeding 9 h showed no reductions due to non-preventable delay incidents. Delay-free waiting times by cohort were: cohort A, 5.3 ± 1.5 h (p < 0.0001); cohort B, 5.9 ± 1.7 h (p < 0.0001); and cohort C, 5.3 ± 1.2 h (paired t, p = 0.004). Cohort B demonstrated the largest reduction in waiting time, averaging 2.2 h. No significant difference was found in delay-free waiting time among cohorts (p = 0.336).
Discussion
This study found that the average time for the elective surgery admission process was 6.9 h, including 1.4 h of cumulative delays. Few studies in Mexico examine the operational attributes of health services, leading to a lack of defined standards or criteria for assessing their appropriateness for users, particularly in pediatric services20.
Following the WHO recommendation for non-urgent care, only 6% of admissions were completed within the expected 4-h window28. Other national estimates indicate that the average waiting time for hospital admission is 7 h, with a maximum of 10 hours. Furthermore, up to 60% of hospital admissions require 5-8 h for completion10. This aligns with our findings (68.7% between 5 and 7 h); however, these challenges and their causes are common across international health systems8,9.
Two aspects encompass the multiple deficiencies and excessive complexity in care processes that result in increased queues and low utilization of resources (human and physical)10,29,30, even when capacity may be sufficient7,18. The first aspect is the organization's functional structure, where clinical and administrative services lack control over patient trajectory beyond their departments. This negatively impacts the adoption of coordination mechanisms between care departments11,12. One indicator of this issue is that 77.6% of patients experience delays due to operational deficiencies in the admission process. In addition, patients in the third quartile (Q3) lose an average of 2.3 h during admission. These operational failures result in extended periods of inactivity17. Improving patient flow requires adopting a patient-centered process approach11,12.
The second issue affecting waiting times relates to inefficiencies in hospital bed management. This impacts the hospitals ability to admit new patients, increases non-medical discharges, and results in significant loss of hospitalization days10,14,16. Delays in the discharge process indicate poor communication and information mechanisms within the hospital10, which become more pronounced during high-demand periods30. In our study, 14% of incidents were related to bed management, representing the second most common cause of delay and prolonged waiting. Previous studies have identified bed management delays in up to 98% of hospital admissions10. The primary issue is bed availability, either due to delayed vacating of beds or extended maintenance procedures (cleaning, disinfection, among others)10. Administrative procedures constitute another significant cause of discharge delays. Studies show that clinical causes account for only one-third of delayed discharges, while administrative causes comprise the remaining two-thirds13.
Additional research is needed to identify factors impeding smooth and timely discharge, particularly those affecting bed availability and admission start times. This includes examining the behavioral patterns of staff involved in these processes, which may be challenging to modify over time. Extended waiting times and negative interactions with staff can adversely affect the relationship between patients, healthcare institutions, and workers6.
Other relevant aspects include the economic, physical, emotional, and social discomfort experienced by patients and caregivers10,13. Long waiting times for medical care are a significant source of dissatisfaction with health services20 and show a proportional correlation with service saturation and quality of care29-31. In addition, other factors influencing hospital delays, such as health status, comorbidities, and socioeconomic factors, need to be studied20,21.
In recent decades, research has been used to enhance service capacity by redesigning systems and processes to increase service delivery3,32,33. This study applied process mapping to identify potential areas of workflow failures27. This approach identified appointment scheduling for admissions as a significant issue in the admission process design, as it caused unnecessary waiting between the completion of admission assessment and transfer to the hospital admission area. The mechanism that promotes efficient patient and caregiver flow during the consultation process is appointment scheduling at specific times, separate from outpatient consultations. Furthermore, the patient and caregiver are accompanied to the admission area with their file upon completing the admission assessment. In contrast, a first-come, first-served approach to outpatient consultations and surgical admissions lengthen waiting times and is the least efficient method. This improvement action has the potential to reduce waiting times and initiate hospital admission procedures earlier.
Finally, the central message is to simplify processes and prioritize patient care. However, this work only addressed the operational aspect, leaving strategic and tactical interventions pending4. Various options are available, including mathematical models, Markov chains, and artificial intelligence3. Another important consideration is the limitation that the quantitative rationality of process optimization in healthcare places on patient preferences and the flexibility required for equity. This paper's scope does not allow for a detailed exploration of these issues.
Conclusions
The waiting time for pediatric patients in the scheduled surgical admission process is 6.9 h (95% CI: 6.6-7.2 h), measured from arrival in the surgical consultation area until occupying the assigned hospital bed. The main issue identified in the process design is the allocation of appointments and surgical assessment schedules. Delays are primarily attributed to patient transfers to the hospital admission area, bed management, and staff availability during shift changes in the admission service. The findings suggest that simplifying the admission process and reducing delays could result in a decrease in waiting times by approximately 1.4 h.

