


 nueva página del texto (beta)
 Inglés (pdf)
 Artículo en XML
 Referencias del artículo
 Enviar artículo por email
 Citado por SciELO
  Similares en
SciELO
Similares en
SciELO 
 Permalink
Introduction
Childhood obesity has become a significant global public health concern. The World Health Organization identifies it as a critical modern challenge, notably due to obesity's role as a principal risk factor for cardiometabolic disorders. Insulin resistance (IR) and proinflammatory state are integral to obesity pathophysiology and contribute to its complexity1,2. Recent trends indicate a rise in the prevalence of overweight and obesity in Mexico, correlating with increased risks of cardiovascular and metabolic diseases3-5. Studies have also highlighted a relationship between elevated liver enzyme levels and metabolic syndrome, suggesting that high levels of enzymes such as alanine aminotransferase (ALT) might be indicative of cardiometabolic risk. Notably, individuals with dyslipidemia often exhibit higher ALT levels compared to those with normal lipid profiles, underlining ALT's potential as a diagnostic marker in pediatric assessments for high cardiometabolic risk6-8.
Furthermore, obesity and metabolic diseases contribute to liver damage, which can elevate liver enzyme levels and, in turn, exacerbate IR, leading to the development of Type 2 diabetes mellitus (T2DM) over time. Studies have independently linked increased ALT levels with T2DM, suggesting a predictive role for ALT in metabolic syndrome, regardless of body weight9-11. In addition, GGT has been associated with oxidative stress and chronic inflammation, both key factors in the pathogenesis of T2DM12.
Despite these associations, detailed insights into the relationship between elevated liver enzyme levels and IR remain sparse. This study posits that high liver enzyme levels could serve as an accessible, cost-effective biomarker for IR. Considering the high prevalence of obesity and glucose dysregulation among children and adolescents, exploring this relationship within this demographic is crucial. This research aims to delineate the association of liver enzymes with IR (wIR) in obese adolescents, a group for which patterns of liver enzyme levels relative to their IR status have yet to be thoroughly characterized.
Materials and methods
Study design
This cross-sectional study was conducted from January 2018 to May 2020 at four tertiary pediatric care centers in Mexico. We included patients aged 10-18 years diagnosed with obesity (body mass index [BMI] > 95th percentile according to the 2000 Centers for Disease Control Growth charts). Exclusion criteria encompassed: (1) conditions or medications potentially affecting weight or appetite, including genetic syndromes, steroids, fluoxetine, insulin sensitizers, anorexigenics, and intestinal fat absorption inhibitors; (2) use of hepatotoxic medications; (3) chronic liver disease; and (4) refusal to participate. Data were collected on the following variables: anthropometric measures, fasting plasma concentrations of high-density lipoprotein cholesterol (HDLc), low-density lipoprotein cholesterol, triglycerides (TGLs), glucose, insulin, and liver enzymes (aspartate aminotransferase [AST], ALT, and GGT). Sexual maturity was assessed using the Tanner scale by a pediatric endocrinologist.
Anthropometry
A certified nutritionist recorded each subject's anthropometric indicators. Height was measured using the stadiometer SECA model 769. Weight measurement was performed using the bioimpedance method (Tanita BC-568 Segmental Body Composition Monitor, Tokyo, Japan) with the patient barefoot and wearing only underwear, as described elsewhere.
Measurement of the cardiometabolic profile and hepatic enzymes
After a minimum of 12 h of fasting, blood samples were obtained from the forearm through the antecubital vein between 7:00 and 8:00 h. Serum samples were frozen at −20°C until analysis. Glucose, TGLs, HDLc, and hepatic enzyme levels were determined by colorimetric enzymatic methods (Bayer Diagnostics, Puteaux, France). Insulin was measured by chemiluminescence (Roche-Hitachi Modular P and D). Intra- and inter-assay coefficients of variation < 7% were considered acceptable. A standard curve was also generated for each assay.
Definitions
The IR index (HOMA-IR) was calculated according to the following formula: HOMA-IR = fasting glucose (mg/dL) × fasting insulin (μU/mL)/405. The HOMA-IR cutoff point for the diagnosis of IR was 2.513. Hypertriglyceridemia was assessed as follows: for children aged < 10 years, TGLs ≥ 90th percentile for age and sex; for children aged > 10 years, TGLs ≥ 150 mg/dL6,14. In addition, reduced HDLc was considered as follows: for children aged < 10 years, HDLc < 10th percentile for age and sex; for children aged > 10 years, HDLc < 40 mg/dL in males and < 50 mg/dL in females, as recommended by the international diabetes federation6,14. The thresholds used for high ALT and AST levels were > 40 U/L and > 30 U/L, respectively15. Pubertal development was classified as follows Tanner stage 1, prepubertal; Tanner stage 2-4, pubertal; and Tanner stage 5, puberty.
Statistical analysis
Kolmogorov–Smirnov test revealed a non-parametric distribution of the continuous variables. Therefore, logarithmic transformation of the continuous variables was performed to normalize their distribution. Continuous variables are presented as mean and standard error, and the between-group differences assessed using the Student's t-test. Categorical variables are presented as frequencies and percentages, and the between-group differences were assessed using the Chi-squared test.
Matching
To minimize the impact of bias induced by BMI z score, patients wIR were matched to patients without IR (woIR) using propensity scores based on BMI z score. The propensity score matching technique used was nearest-neighbor matching at a 1:1 ratio without replacement. The caliper was set at 0.01. The pymatch library for Python v3.7 was used.
Logistic regression analysis was performed to determine the relationship between IR and increased liver enzymes after adjusting for age, sex, puberty, high HDLc, and hypertriglyceridemia. p < 0.05 were considered indicative of statistical significance.
STATA v.12.0 was used for statistical analyses.
Ethical considerations
The study protocol complied with the principles of the Declaration of Helsinki and was approved by the National Research and Health Ethics Committee of the Mexican Social Security Institute (Instituto Mexicano del Seguro Social, IMSS) (registry number R-2014-785-024). The parents/caregivers provided written informed consent, and each child provided assent.
Results
Study population
Initially, 450 potential adolescent participants were identified. Exclusions included four patients with incomplete laboratory data, four patients under 9 years of age, 49 overweight patients, and 28 who declined participation. Ultimately, 365 adolescents with obesity (50.6% male) were enrolled in the study. The average age of the participants was 12.6 years, and the average BMI z-score was 2.2. Notably, 97.5% of the subjects (n = 356) were in the pubertal phase as to Tanner scale stages 2-4 (Table 1).
Table 1 Comparison of the general characteristics and liver enzyme levels of subjects with and without insulin resistance, before and after propensity score matching based on BMI z score
| Variable | All | All subjects | Matched subjects | ||||
|---|---|---|---|---|---|---|---|
| Insulin resistance | p-value | Insulin resistance | p-value | ||||
| (n = 365) | Without (n = 136) | With (n = 229) | Without (n = 122) | With (n = 122) | |||
| Media (standard error) | |||||||
| Age (years) | 12.6 ± 0.12 | 12.3 ± 0.20 | 12.7 ± 0.15 | 0.043 | 11.9 ± 0.13 | 12.7 ± 0.15 | 0.003 |
| Male sex* | 214 (58.6) | 95 (69.8) | 119 (51.9) | 0.341 | |||
| BMI z score | 2.2 ± 0.01 | 2.1 ± 0.02 | 2.2 ± 0.02 | 0.032 | 2.2 ± 0.02 | 2.2 ± 0.02 | 0.994 |
| Puberty* | 0.278 | 0.594 | |||||
| Pre-puberal | 3 (0.82) | 0 (0.0) | 3 (1.31) | 0 (0) | 0 (0) | ||
| Puberal | 356 (97.5) | 134 (98.5) | 222 (96.9) | (88.6) | (89.1) | ||
| Puberal delay | 6 (1.64) | 2 (1.47) | 4 (1.74) | (11.4) | (10.9) | ||
| Total cholesterol (mg/dL) | 162.3 ± 1.68 | 162.8 ± 2.57 | 162.0 ± 2.20 | 0.671 | 158.8 ± 1.21 | 161.9 ± 2.20 | 0.210 |
| Triglycerides (mg/dL) | 151.0 ± 3.76 | 142.2 ± 5.66 | 156.4 ± 4.93 | 0.053 | 156.4 ± 4.93 | 165.3 ± 3.46 | 0.069 |
| Cholesterol HDL (mg/dL) | 37.4 ± 0.44 | 38.2 ± 0.67 | 36.9 ± 0.58 | 0.042 | 36.9 ± 0.58 | 34.9 ± 0.38 | 0.002 |
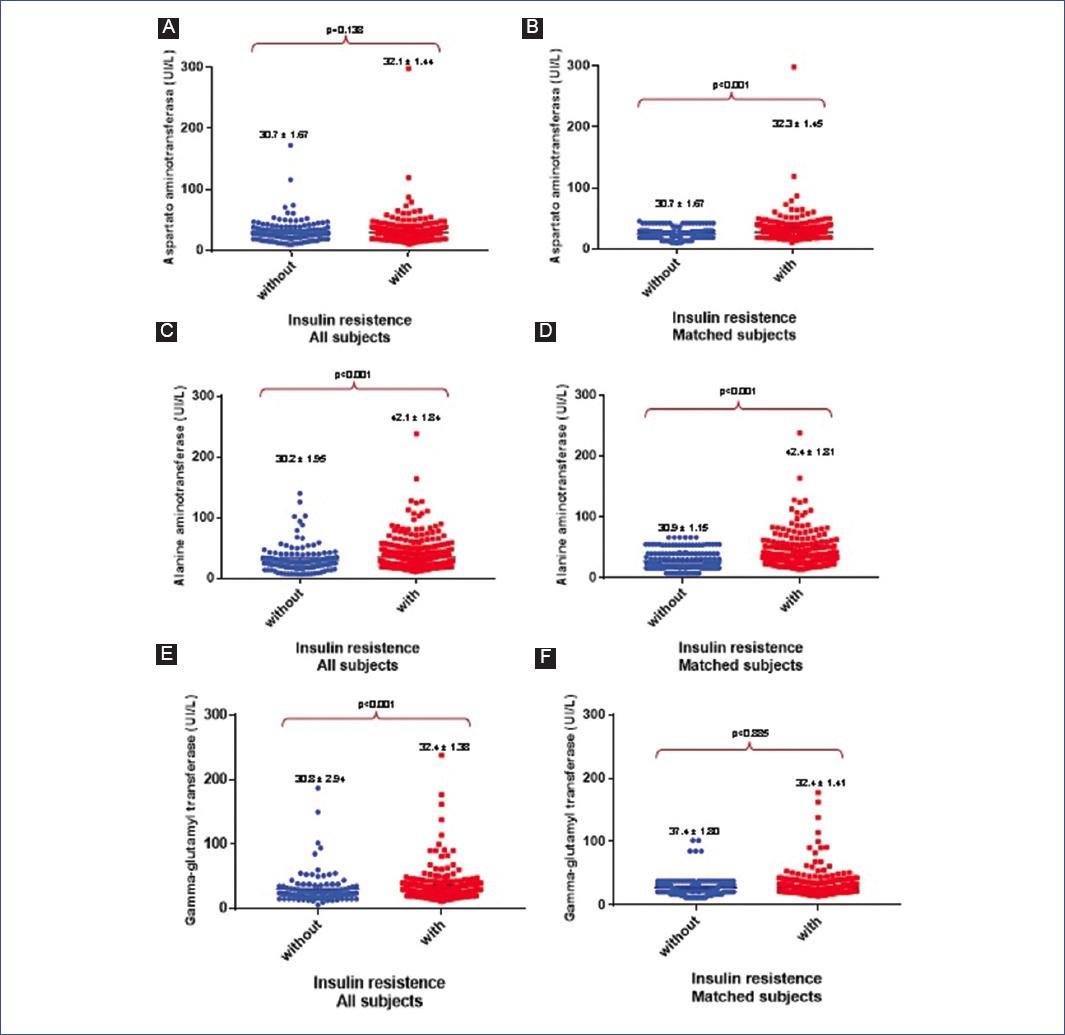
| AST (U/L) | 31.5 ± 1.10 | 30.7 ± 1.67 | 32.1 ± 1.44 | 0.138 | 24.7 ± 0.69 | 32.3 ± 1.45 | < 0.001 |
| ALT (U/L) | 37.7 ± 1.40 | 30.2 ± 1.95 | 42.1 ± 1.84 | < 0.001 | 30.9 ± 1.15 | 42.4 ± 1.81 | < 0.001 |
| GGT (U/L) | 31.8 ± 1.38 | 30.8 ± 2.94 | 32.4 ± 1.38 | < 0.001 | 37.4 ± 1.80 | 32.5 ± 1.41 | 0.855 |
| Hypertriglyceridemia | 166 (45.5) | 62 (45.6) | 102 (44.5) | 0.807 | 61 (50.0) | 54 (44.2) | 0.224 |
| Altered HDLc* | 253 (69.3) | 91 (66.9) | 163 (71.2) | 0.395 | 15 (12.3) | 43 (35.2) | < 0.001 |
| Altered AST* | 154 (42.2) | 52 (38.3) | 101 (44.1) | 0.284 | 55 (24.0) | 101 (44.1) | < 0.001 |
| Altered ALT* | 124 (34.0) | 33 (24.2) | 90 (39.3) | 0.003 | 74 (32.3) | 90 (39.3) | 0.119 |
*Frequency (%). AST: aspartate aminotransferase; ALT: alanine aminotransferase; GGT: gamma-glutamyl transferase; BMI: body mass index.
Biochemical analysis
Our cohort's average serum TGLs level exceeded 150 mg/dL, while the average HDL cholesterol (HDLc) was below 40 mg/dL (Table 1). The average levels of AST, ALT, and GGT were 31.5 U/L, 37.7 U/L, and 31.8 U/L, respectively.
Comparison between subjects with and woIR
When comparing the general characteristics, adolescent's wIR had more age, weight, height, and BMI Z-scores than those woIR (Table 1). In addition, the IR group had elevated serum TGLs (156.4 mg/dL vs. 142.2 mg/dL, p = 0.053) and lower HDLc (36.9 mg/dL vs. 38.2 mg/dL, p = 0.042) compared to their non-IR counterparts (Table 1). Serum liver enzyme levels were also higher in the IR group (AST: 32.1 U/L vs. 30.7 U/L, p = 0.138; ALT: 42.1 U/L vs. 30.2 U/L, p ≤ 0.001; GGT: 32.4 U/L vs. 30.8 U/L, p = 0.004) (Fig. 1 and Table 1).
Matched analysis based on BMI z-score
After matching for BMI Z-scores, significant differences were noted in HDLc levels between groups, with lower levels in subjects wIR. The differences in TGLs or total cholesterol levels were not statistically significant. Furthermore, liver enzymes such as AST (32.3 U/L vs. 24.7 U/L, p < 0.001) and ALT (42.4 U/L vs. 30.9 U/L, p ≤ 0.001) were significantly higher in the IR group (Table 1, Matched subjects).
Analysis of dyslipidemia and liver enzymes
The proportion of subjects with reduced HDLc was significantly higher in the IR group (35.2% vs. 12.3%, p < 0.001), as was the proportion of subjects with high ALT levels (44.1% vs. 24.0%, p < 0.001) (Table 1, Matched subjects).
Multivariate logistic regression analysis
This analysis identified high AST levels (odds ratio [OR]: 4.15, p < 0.001), reduced HDLc (OR: 3.08, p < 0.001), male sex (OR: 1.67, p = 0.020), puberty (OR: 2.93, p = 0.044), and age (OR: 1.43, p < 0.001) as independent risk factors for IR in adolescents with obesity (Table 2).
Table 2 Multiple logistic regression analysis showing risk factors for insulin resistance in obese adolescents (n = 244)
| Variable | OR | Confidence interval 95% | p-value |
|---|---|---|---|
| Male sex | 1.67 | 1.08, 2.58 | 0.020 |
| Age, years | 1.43 | 1.20, 1.49 | < 0.001 |
| Puberty | 2.93 | 1.52, 5.66 | 0.044 |
| Altered AST | 4.72 | 2.76, 8.12 | < 0.001 |
| Altered ALT | 0.64 | 0.40, 1.02 | 0.062 |
| Altered HDLc | 3.08 | 1.83, 5.10 | < 0.001 |
AST: aspartate aminotransferase; ALT: alanine aminotransferase; HDLc: high-density lipoprotein cholesterol; OR: odds ratio.
Discussion
After matching the subjects according to BMI Z-score, IR was identified as a risk factor for increased levels of liver enzymes. Specifically, associations were found between ALT and AST levels and IR, while GGT level showed no significant association wIR.
Studies from diverse populations support these findings. Korean adolescent studies demonstrated a strong correlation between metabolic syndrome and elevated ALT levels16. A study that involved 4,200 students aged 7-18 years identified ALT levels as a risk factor for metabolic syndrome (OR: 1.013; 95% CI 1.001-1.025, p = 0.033) and dyslipidemia (OR 1.051; 95% CI 1.034-1.068, p < 0.001)6. Similarly, European adolescents showed associations between ALT levels and multiple cardiometabolic risk factors14. Another study highlighted higher ALT levels in children with metabolic syndrome compared to their peers without the condition (42.1 UI/L; 95% IC 33.4-50.7 vs. 23.9 UI/L; 95% IC 21.0-26.8; p < 0.001)17. This pattern is echoed in studies linking ALT levels wIR in obese pediatric populations18.
Our findings align with previous research showing a correlation between ALT levels and IR. In our study, subjects wIR had higher AST levels, with altered AST emerging as a risk factor for IR.
According to research, non-alcoholic fatty liver disease (NAFLD) is regarded as a hepatic manifestation of metabolic syndrome; individuals who are overweight or obese and have IR are at a heightened risk for developing NAFLD19,20. Thus, IR plays a pivotal role in the pathophysiology of NAFLD. The link between IR and obesity contributes to the suppression of lipolysis in adipose tissues, which results in an increased influx of free fatty acids into the liver21-23. Excessive adipose tissue is also correlated with the production of adipokines and pro-inflammatory cytokines such as tumor necrosis factor, interleukin 6, and interleukin 8, which foster hepatic steatosis and the progression of hepatocellular damage24. Furthermore, IR, T2DM, hypertension, and other components of metabolic syndrome are associated with the severity of these conditions25,26.
Higher levels of oxidative stress can cause liver damage ranging from steatosis to fibrosis. Factors such as diet, environmental conditions, infections, and antioxidant deficiencies contribute to elevated oxidative stress27. ALT, a liver enzyme located primarily within the cytoplasm of hepatocytes, serves as a key indicator of liver health. Elevated ALT levels are associated with hepatic steatosis and can signal physiological changes predictive of T2DM development11. AST is less specific to the liver and is also released from damaged heart, skeletal muscle, kidney, brain, pancreas, and red blood cells, making it a valuable marker for identifying IR28. Conversely, GGT, a glycoprotein enzyme found in a variety of tissues, including the epididymis, fibroblasts, lymphocytes, lung, and pancreas, is particularly active in the kidney. Given its diverse cellular expression, including T lymphocytes, where its activity significantly increases in response to oxidative stress, GGT's role in liver function is less pronounced, complicating the identification of factors contributing to both elevated GGT levels and IR29,30.
These insights underscore the potential of liver enzyme levels, particularly AST, as indirect markers of IR, aiding in the evaluation of obese adolescents at risk for vascular diseases, diabetes, and metabolic syndrome when direct measures like the HOMA index are unavailable. This routine measurement in clinical practice could significantly enhance the assessment and management of metabolic risks in this population.

