


 nueva página del texto (beta)
 Inglés (pdf)
 Artículo en XML
 Referencias del artículo
 Enviar artículo por email
 Citado por SciELO
  Similares en
SciELO
Similares en
SciELO 
 Permalink
1 Introduction
Bioimpedance is the ability of biological tissues to resist the passage of electric current and can be measured by detecting how the tissue responds when an electrical excitation (current or voltage) is applied. To perform these measurements, an excitation signal is applied and its response is captured using electrodes, which convert electrical charge into ionic charge and vice versa. Electrical impedance (Z) is the opposition to AC and is defined by:
Since Z is complex, it can be expressed as magnitude (|Z|) and phase (Φ). It can be divided into a real part (Resistance, R) and an imaginary part (Reactance, X) [1]. The Cole model represents cellular behavior in bioimpedance through frequency. This model, described in [2, 3], can be visualized as a series circuit composed of Ri (intracellular fluid resistance), Cm (cell membrane capacitance), and Re (extracellular fluid resistance). Changes of behavior at different frequencies is as shown in Figure 1.
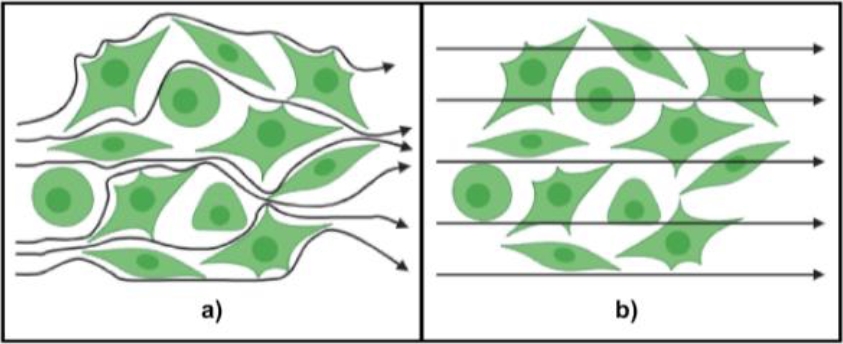
Fig. 1 Bioimpedance in living cells. Behavior of frequency through living tissue for a) low frequency flow and b) high frequency flow
At low frequencies, cell membranes act as insulating barriers, allowing minimal current flow and directing it primarily through the extracellular fluid (Re). At high frequencies, the impedance of the cell membrane (Cm) decreases, allowing current to flow through both intracellular (Ri) and the extracellular (Re) fluids. Damaged cell membranes, lose their insulation properties, thus behaving like capacitors, since the current flow goes freely through the cells exhibiting high capacitance [4, 5].
The Vibrio cholerae cytolysin (VCC toxin) is a pore-forming toxin produced by Vibrio cholerae, known for forming microscopic pores in cell membranes, making it a valuable tool for studying cellular responses due to loss of integrity. Khilwani (2015) reviews VCC-induced responses (pore formation, vacuolation and cell death), noticing that cells may survive by membrane processing of the inserted toxin [6]. Vero cells, an immortalized monkey kidney epithelial cell line, are preferred for cytotoxicity assays, due to their ample view of the nucleus and cytoplasm, offering wide visibility for observation of the phenomena occurring due to VCC cytotoxicity, such as vacuolization/ autophagy, apoptosis and necrosis.
The Coulter method, a typical impedance application, is used to count cells in a suspension and assess cell sizes. In 2007, Arum Han et al. demonstrated the use of Electrical Bioimpedance Spectroscopy (EBiS) to identify tumor cell lines by characterizing their electrical properties [10]. Similarly, the study by Seidel and co-authors demonstrated that changes in cellular impedance correlate with changes in cellular structure, providing a non-invasive and sensitive monitoring system [11]. Electrical Impedance Spectroscopy (EIS) has been recognized for monitoring physiological state of biological tissues. Robin et al. applied EIS to macroalgae samples, analyzing differences in the electrical response before and after electroporation using high-voltage pulsed electric fields (PEF) [7].
Electroporation forms pores in cell membranes, altering their permeability, which can be monitored through bioimpedance spectra to assess tissue physiology. EIS is valuable for evaluating membrane integrity. According to [8, 9], a disintegration index (Zp) was proposed (Formula 2) to quantify membrane disintegration, based on impedance at low frequencies (LF) and high frequencies (HF):
LF reveals membrane resistance and capacitance, while HF reflect internal properties, where the value of Zp varies between 0 for intact tissue and 1 for fully permeabilized tissue.
In the present study, the efficiency of bioimpedance via its parameters to determine and characterize cellular changes due to pore forming cytotoxicity was evaluated. Variations in EBiS spectra related to vacuolization effects, commonly observed after membrane perforation, were identified, then spectra examined to determine disintegration index. These experimental approach may enhance the understanding of the use of bioimpedance for monitoring and quantifying cellular damage. The VCC was used as the master inducer of cellular perforations in Vero cells performing dose/response experiments. The VCC was chosen as a biological tool, adapting nicely to our purposes, due to its mechanism of action causing concentration-dependent pore forming lesions, which can be detected by microscopy, in association with an extensive unmistakable vacuolization of the cytoplasm.
Application of Bioimpedance methodology to study tissue culture cell damage can be used conveniently, since it would be a fast, efficient and semi-quantitative method to detect cytoplasmic membrane perforation and subsequent necrosis elicited, in this case by a pore forming toxin.
More bioimpedance quantitative studies will be done to find out whether subsequent intracellular damage responses, such as apoptosis, autophagy, besides lytic cell death caused by the VCC, may also be detected by changes in bioimpedance such as the ones observed here.
2 Materials and Methods
2.1 Cell Culture
An STAT1 knockout Vero cell line was purchased from ATCC, derived from healthy kidney of an African green monkey. The one used was derived from the parental Vero cell line (ATCC CCL-81). Cell culture was manipulated using the standard procedures, as follows: DMEM supplemented with 10% fetal bovine serum (FBS). Cells were maintained at 37°C in an atmosphere of 95% humidity and 5% CO2. For storage, cells were cryopreserved in freezing liquid nitrogen as indicated by the provider.
Vero cell tissue cultures were originally used to describe the cytotoxic changes induced such as vacuolation due to VCC [13], and other resulting of this toxin exposure [19]. Vero cells were grown in 2 flasks of 5 cm2 until reaching a population of 5 x10⁶ cells as shown in figure 2. Once a confluence of at least 90% was achieved, one of the flasks (flask #1) was maintained with DMEM medium containing 2% FBS without treatment, working as the negative control, In the flask #2, cytotoxicity was induced by adding VCC toxin to the cell culture flask at a concentration of 160 ng/mL of VCC toxin (known to induce vacuolization) in DMEM supplemented by only 2% FBS.
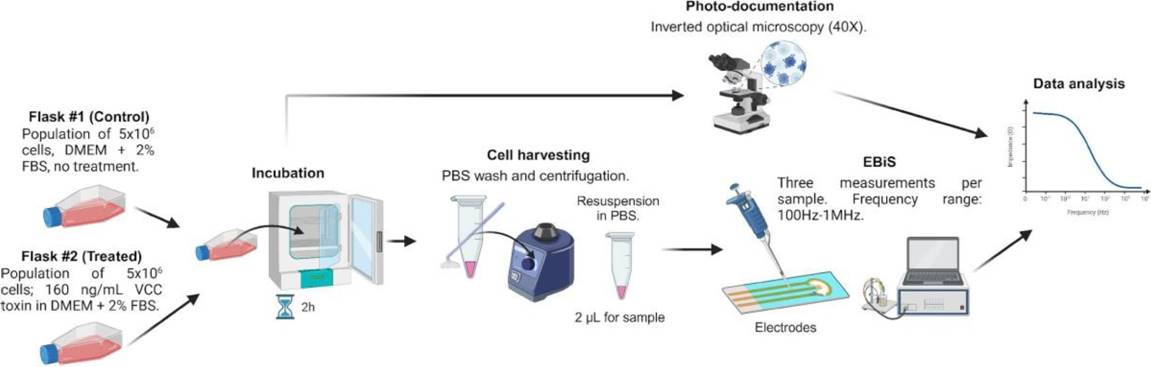
Fig. 2 Schematic representation of the experimental design. The figure illustrates the key stages involved, including sample preparation, treatment conditions, and analysis methods. Created with BioRender.com
Both flasks were incubated 2h, at the end of the incubation, photo-documentation was performed at 40X magnification (Figure 2) using a NIKON inverted Microscope Model Diaphot-TMD in search for predominance of cytoplasmic vacuolization.
2.2 Electrical Bioimpedance Spectroscopy
Vero cells were collected by harvesting with a scraper and centrifuged using a Vortex Genie 2 mixer (Scientific Industries). The cells were washed with PBS and then resuspended in it for measurements. A visual inspection was performed to confirm that the pellets contained a homogenous cell concentrate (2 µL for each sample). Samples were placed on an array of two electrodes arranged in a chamber configuration.
Multi-frequency electrical impedance was measured by applying a 100 mV peak potential difference within the 100 Hz-1 MHz frequency range and subsequently measuring the current to estimate system impedance.
The impedance meter module (ScioSpec™ ISX-3, Germany) was programmed, and data was collected using an HP mini 110-1150LA PC (HP Inc.). Three measurements were conducted for each sample of non-treated Vero cells (negative control), vacuolated Vero cells and the PBS. Consequently, the impedance of each sample was determined as the average of the three technical replicates, with each replicate representing the mean of three measurement readings.
2.3 Data Processing
Data processing and analysis were conducted using Excel (Microsoft Excel®, version LTSC MSO (16.0.14332.20734) and MATLAB (R2024a). In the data processing workflow, an initial document was created in Microsoft Word, where frequency data, real and imaginary numbers were presented horizontally. This information was then converted into a table and subsequently transferred to Excel. In the Excel file, the data were reorganized vertically, distributed across three columns.
Once the data was organized, it was used to generate plots in MATLAB. For compatibility, the data was formatted into a specific structure to be utilized as matrices. For each frequency within the used range, a complex number comprising a real component (R) and an imaginary component (X) was obtained.
The mean of the three impedance measurements was calculated for each sample to achieve a representative value and minimize the impact of potential experimental errors. Following this, the magnitude and phase of the impedance were calculated from these means.
The disintegration index for cell samples was calculated at low (20 kHz) and high (300kHz) frequencies to evaluate changes in cellular permeability.
The standard error (SE) of the measurements was estimated to assess the precision and consistency of the data.
Bode plots were developed using the processed data. These plots, as graphical representations, illustrate the magnitude and phase of the impedance as a function of frequency within a useful range of 1x10³ to 1x10⁶ Hz. Additionally, scatter plots were generated using the X and R components situated in two representative regions of the bandwidth for high (100 kHz) and low (10 kHz) frequencies.
3 Results and Discussion
From the microscopic observation of Vero cells photo-documentation of possible changes was obtained, under both conditions: untreated (negative control of untouched cells) and treated cells in the presence of VCC toxin, the images are presented in Figure 3.
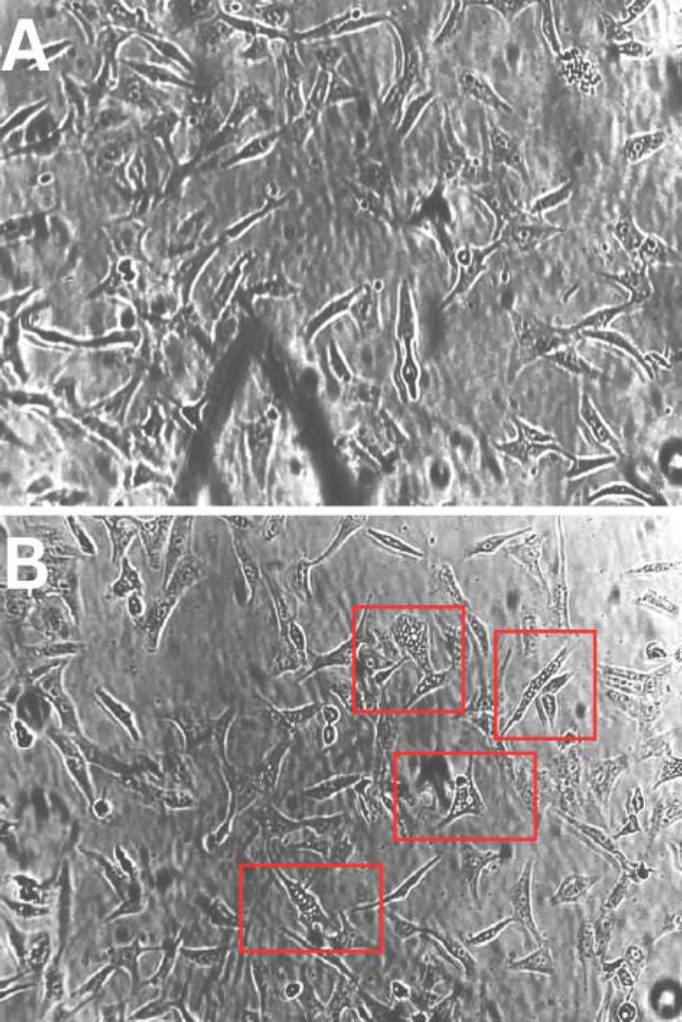
Fig 3 Microscopic morphology of Vero cells undergoing vacuolating cytotoxicity. A) Control without treatment and B) VCC treated cells developing vacuolization. Multiple vacuolated cells are inside the red squares (40X magnification)
The Figure 3, Section A, shows the morphology from the cells of the negative control, where no abnormalities were observed, that may suggest cellular damage at all. So, cells in Figure 3, Section A were in perfect condition, displaying their elongated normal shape, consistent with the images of normal Vero cells from the literature [12] and the ATCC provider.
In Figure 3, Section B, on the contrary, the morphology of the VCC-treated cells exhibits the classic vacuolating effect, consisting with cytoplasmic membrane damage, followed by autophagy then apoptosis. The cytotoxicity is evidenced by the presence of multiple vacuoles within the cytoplasmic content. This finding is evidence of the appropriate use and effective action of the pore-forming toxin [13].
The vacuoles (highlighted in red squares) are observed as refringent small, circular white intracellular structures, distinctive of VCC cytotoxic effect. Other organelles are not distinguished in the cytoplasm.
These reliable and very consistent morphological changes between normal and abnormal cellular conditions, allowed us to suggest that the total resistance to the current flow will reach a higher value in the control cells, in comparison to the damaged treated cells, due to differences diminishing the cellular integrity [7], in other words, the cells exposed to the VCC toxin exhibit important degeneration.
The values for magnitude and phase of impedance in their graphical representation are shown in Figure 4. In this case Figure 4, Section A displays a Bode plot corresponding to magnitude vs frequency. The PBS trend (background) is generally a straight line, indicating an absence of living elements. Higher impedance values compared to the cells used, could be attributed to the concentration of the PBS, given its role as a cellular background environment.
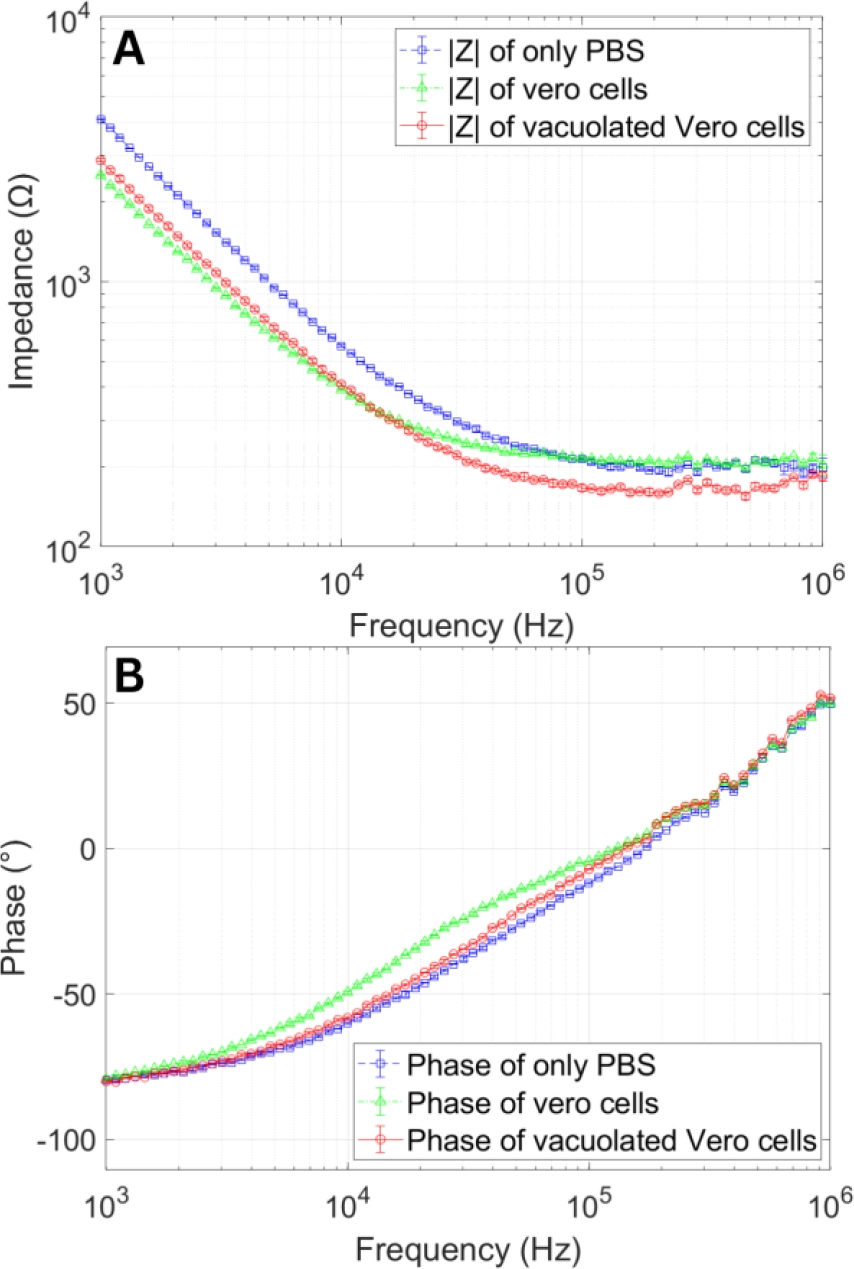
Fig 4 Analysis of Impedance in the presence and absence of VCC. EBiS measurements for untreated Vero cells (negative control) and Vero cells treated with VCC. In A) there is the graphic representation of impedance magnitude (Z) vs. frequency. B) Graphic representation of impedance phase (Z) vs. frequency.
As described in the literature [14,15] for the impedance spectrum behavior of living tissues, a characteristic curve, also known as the Beta dispersion zone, is observed in the frequency range between 1x10⁴ to 1x10⁵ Hz. The photo-documentation shows that an increase of the curve is due to cellular membrane integrity and therefore intact intracellular content, which together represent two resistive elements that, even at high frequencies, oppose free flow of electric current. When the cellular membrane undergoes permeability effects [16], such as chemical perforation due to pore formation, the intracellular content is therefore altered, as it is evident by the extensive vacuolation, which in turn results in a decline in cellular resistance, which in turn reduces the impedance data. The above observations are reflected in the curve from the vacuolated cells. It is appropriate to remember that since the cells are programmed to start a survival response (through autophagy) when the damage is still manageable, as soon as they become overwhelmed by the presence of so many pores perforating the membrane, their ability to continue to rescue the cell through autophagic vacuoles, becomes unmanageable, the cell program is switched to a leading program of cell death (apoptosis), which in turn will lead to cell lysis (necrosis) which is the process responsible to the observed decrement of the normal opposition of cells, to the current flow.
The above physiological explanation supports the observation of this study, since the impedance values for cells exposed to VCC pore-forming toxin were lower, in comparison to the negative control, and that no characteristic curve of full viability was observed. The above result does not imply that all cells are dead, but rather that the normal cell population within the sample, was sufficiently reduced to become undetectable by the impedance measurement module.
Regarding the Bode plot for phase (Figure 4, Section B), analysis of the trends, shows that its behavior is similar to an equivalent circuit for a cell, consisting of resistive and capacitive elements, as defined by the Cole model [17,18]. This model includes a resistance R1 representing the extracellular medium and a resistance R2 in parallel with a capacitor C1 representing the cell membrane. In other words, as frequency increases, the impedance of the capacitor decreases, which influences the decrement in phase.
At low frequencies, the phase behavior is similar to that of an open circuit, determined by both resistances, resulting in a smaller phase value. The cells from the negative control (untreated) exhibited huge phase values throughout the plot, which is explained by the preservation of cellular integrity, allowing for a higher resistive component. Conversely, since the cells treated with VCC underwent cellular alterations affecting their cytoplasmic membranes, and the contents of a normal cytoplasm [20], all alterations together, in fact resulting in a predominantly capacitive component or a decrement in the resistive component, leading to lower phase values.
Table 1 shows the disintegration index (Zp) for cell samples. The obtained value confirms a change in membrane integrity due to the presence of a cytotoxic agent (VCC), which induces cellular deterioration. The SE was estimated for the data used, which demonstrated consistency and low variability, thereby indicating high reliability in the measurements.
Table 1 Disintegration index for Vero cells treated with VCC
| Cytotoxic agent | Zp | Std. error |
| Vibrio cholerae cytolysin | 0.261 | 0.0505 |
For analysis and projection, feature extraction from impedance measurements was performed using a scatter plot (Figure 5). The plot contrasts values of the imaginary component (reactance) at high frequencies (100 kHz) against values of the real component (resistance) at low frequencies (10 kHz).
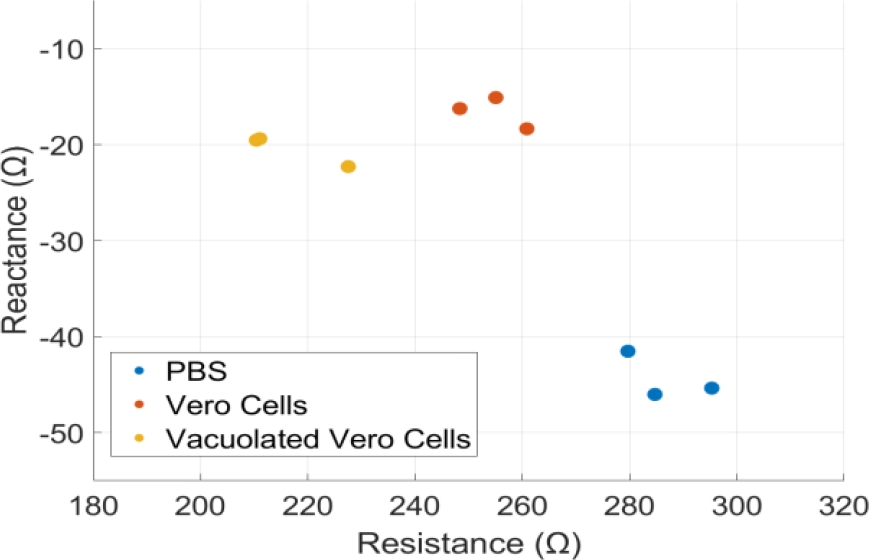
Fig. 5 Analysis of the real and imaginary components in the presence and absence of VCC. Scatter plot for the triplicate measurement of values of Resistance R (real component) at low frequencies of 10 kHz and Reactance X (imaginary component) at high frequencies of 100 kHz
For the three datasets corresponding to PBS (background), Vero cells, and vacuolated Vero cells, the Mean and Standard Deviation (SD) were calculated, allowing for the delineation of characteristic regions for the identification of these elements. Consequently, three distinct regions can be defined for each parameter (X and R ranges), as shown in Table 2.
Table 2 Extraction of impedance parameter features
| Sample | R Mean ± SD | R range | X Mean ± SD | X range |
| Vacuolated cells | 216.30 ± 9.7 | 206.6/226 | -20.38 ± 1.6 | -18.78/-21.98 |
| Negative control | 254.73 ± 6.3 | 248.43/261.03 | -16.54 ± 1.6 | -14.94/-18.14 |
| PBS | 286.56 ± 8.0 | 278.56/294.56 | -44.29 ± 2.4 | -41.89/-46.69 |
In terms of future projections, this study lays criteria for the groundwork to develop of a measurement device designed for the recognition of cellular damage triggered by cytotoxins such as VCC. An innovative proposal is the creation of a sensitive device, based on impedance parameters and related measurements, designed to provide a precise and efficient tool to determine the early detection of cellular damage due to toxic effects, elicited by toxins or other related kinds of cell damage.
To further support the results of this study, more representative and robust data could be obtained, by incorporating a larger number of samples into analysis, allowing for more detailed characterization of the effects of the VCC pore forming toxin, and incorporating the use of different cell types. This expanded approach would not only establish the enhanced accuracy of the planned device, but it also may enable the calibration of the system under various contexts and experimental conditions.
Furthermore, integrating a larger number of data would facilitate the development of more sophisticated analytical algorithms, making the planned device capable of distinguishing between different types of cellular alterations, adapting it to a range of applications, such as monitoring cell culture quality in research laboratories and perhaps even become a useful tool for evaluating treatment efficacy in clinical studies.
4 Conclusions
The present study supports that bioimpedance technology is an effective tool for assessing cellular damage induced by pore forming toxins such as VCC, an important pathogenicity trait from Vibrio cholerae. Treatments with the pore-forming toxin VCC are known to induce perforation of the cytoplasmic membrane, leading to a subsequent loss of the membrane potential, which is detectable by a drop in bioimpedance levels in the system. The above observation is apparent in contrast to what happens with untreated cells, which maintain their membrane potential and therefore their integrity, as it is detectable by bioimpedance determinations.
These findings strongly suggest that bioimpedance is a versatile technology than can be used as the fundament of a non-invasive and sensitive method for early detection of cellular damage and toxic effects, positioning the groundwork for the development of friendly measurement devices enabling the identification of cellular deleterious alterations in both research and clinical contexts.
VCC toxin treatments were capable of inducing cell damage; however, to study stages related to specific kinds of damage like apoptosis and necrosis, require more refined studies at different toxin concentrations, that may lead to the standardized conditions, tolerable for the cell. It would be necessary to establish what seems obvious—those changes in bioimpedance that would be efficient in detecting cellular alterations consistent with these cell death functions.

