




 nueva página del texto (beta)
 Inglés (pdf)
 Artículo en XML
 Referencias del artículo
 Traducción automática
 Enviar artículo por email
 Citado por SciELO
  Similares en
SciELO
Similares en
SciELO 
 Permalink
1 Introduction
Energy is a fundamental resource in modern society, and its global demand has markedly increased over the last four decades, with projections indicating a 30% increase by 2040 [21, 40]. Energy management has become a critical factor influencing our future, as much of today’s energy comes from fossil fuels. This unsustainable growth and inefficient use of energy pose significant challenges in a world with a growing population and evident effects of global warming. Therefore, improving energy efficiency is one of the most important objectives in any society. Measuring electricity consumption and visualizing every detail is the first step toward awareness and adopting appropriate measures to save electricity [34, 30, 31].
A crucial aspect of improving energy efficiency is integrating smart home energy management and control systems. These systems allow users to monitor the electricity consumption of their appliances individually, facilitating informed decisions on reducing energy consumption [25, 38, 30]. However, the lack of data standardization and the complexity of obtaining energy information in different operating states of devices pose practical challenges. Therefore, systems capable of integrating different mobile technologies are required to manipulate user energy data and potentially revolutionize how we consume and use energy in our homes [37, 42].
To effectively address these challenges, it is crucial to consider the fundamental role of advanced technologies that offer innovative tools and analytical capabilities to improve energy efficiency and reduce environmental impact [12, 27]. These technologies include the Internet of Things (IoT), which provides connectivity and communication between devices and sensors in an energy infrastructure; Machine Learning (ML) algorithms that can identify patterns and trends in energy consumption, enabling more accurate decision making; cloud computing that plays an essential role in energy data management and analysis; and mobile applications that provide an accessible and convenient interface for end users. These tools not only improve energy efficiency but also contribute to reducing the carbon footprint and moving towards a more sustainable and resilient energy future [29, 7].
In this context, this work proposes a mobile architecture for managing residential electricity consumption data through implementing smart plugs using IoT technology, machine learning algorithms, and developing a prototype mobile application. This approach aims to monitor, analyze, and predict electricity consumption in residential environments, seeking to improve energy efficiency and involve users through gamification elements, making energy saving more attractive and motivating. Additionally, this research aims to contribute to developing technological solutions that promote more sustainable energy habits, leveraging mobile technology as a tool to improve energy management at the individual level and, ultimately, globally.
The remainder of the paper is structured as follows: Section 2, Background, provides a brief review of related work, establishing a sound theoretical framework for the research. Additionally, the research questions are presented along with the theoretical context in the study area. Section 3, Materials and Methods, details the procedures used in data collection, including the instruments and techniques employed, as well as the methods of analysis. Section 4, Results and Discussion, presents the conclusions derived from the data analysis, discussing the results in relation to the research questions posed and exploring their implications. Finally, Section 5 presents the overall conclusions of the study and suggests possible directions for future research.
2 Background
2.1 Related work
In the research by Rashid et al. [32], they propose implementing the cognitive Internet of Things (CIoT) in a smart monitoring system for home appliances. This system includes a Raspberry Pi-based smart plug, a Google Colab training server to build a long-term memory model (LSTM) to predict energy consumption, and a control panel for real-time monitoring and abnormal consumption alerts, achieving 80% prediction accuracy.
In the proposed work of Veloso et al. [8], they focus on detecting appliances in residential networks using Electrical Load Signing (ELS) and smart plugs, relying on machine learning algorithms. Individual electrical parameters of each load are analyzed and stored in a Home Energy Management System. Classification algorithms, such as Decision Tree and Naive Bayes, are trained to identify appliances in each socket. A visual application in the system allows users to monitor active appliances, review consumption history, and detect anomalies in the power grid. This method integrates IoT technology and machine learning to improve control and knowledge of household energy consumption.
Paredes-Valverde et al. [26] presents IntelliHome, a smart home system that aims to reduce electricity consumption in the home. IntelliHome uses big data analysis technologies and machine learning and statistical techniques to provide users with meaningful insights into their electricity consumption habits, aiming to actively involve them in the energy-saving process through real-time information and energy-saving recommendations. The results obtained verify the effectiveness of the proposed system in terms of saving electricity, representing an intelligent solution that leverages data analytics and machine learning to help users effectively save energy at home.
In the work of Escanillan-Galera et al. [13], they present the design and development of EnerTrApp, a prototype mobile web application that allows consumers to monitor the energy consumption of household appliances using their smartphones. The main focus is to evaluate the user interface of this application through usability testing to measure its effectiveness, efficiency, and level of user satisfaction. The results of the data analysis indicate that the EnerTrApp user interface is highly effective, as evidenced by the fact that all participants completed all the proposed tasks.
Finally, the research of Machorro-Cano et al. [21] presents HEMS-IoT, a home energy management system based on big data and machine learning for home comfort, security, and energy saving. The J48 machine learning algorithm and Weka API were used to learn user behaviors and energy consumption patterns and classify homes based on their energy consumption.
2.2 Hypothesis and Research questions
The objective is to develop a mobile architecture with software and hardware elements that will enable more effective management, monitoring, and control of energy consumption. This will be achieved using low-cost IoT sensors to collect electricity consumption data and an online dataset to which machine learning algorithms will be ap-plied to analyze and predict consumption patterns. The prototype mobile application will allow users to visualize, monitor, and control their energy consumption and receive recommendations to reduce unnecessary consumption, contributing to cost reduction, environmental sustainability, and the transition to a more energy-efficient economy.
In this context, residential electricity consumption data management involves the scientific process of data collection, analysis, and utilization of information related to household electricity consumption, with the primary purpose of improving energy efficiency and promoting sustainable consumption practices [33, 19]. This management offers several benefits, providing users with detailed information about their consumption, allowing them to identify areas for improvement and take measures to reduce unnecessary energy consumption [28].
This research aims to answer the following hypothesis and research questions:
Hypothesis:
— The implementation of low-cost IoT sensors and machine learning algorithms will improve the accuracy of energy consumption prediction.
— Gamification and personalized recommendations will motivate users to reduce their energy consumption.
Research questions:
3 Materials and Methods
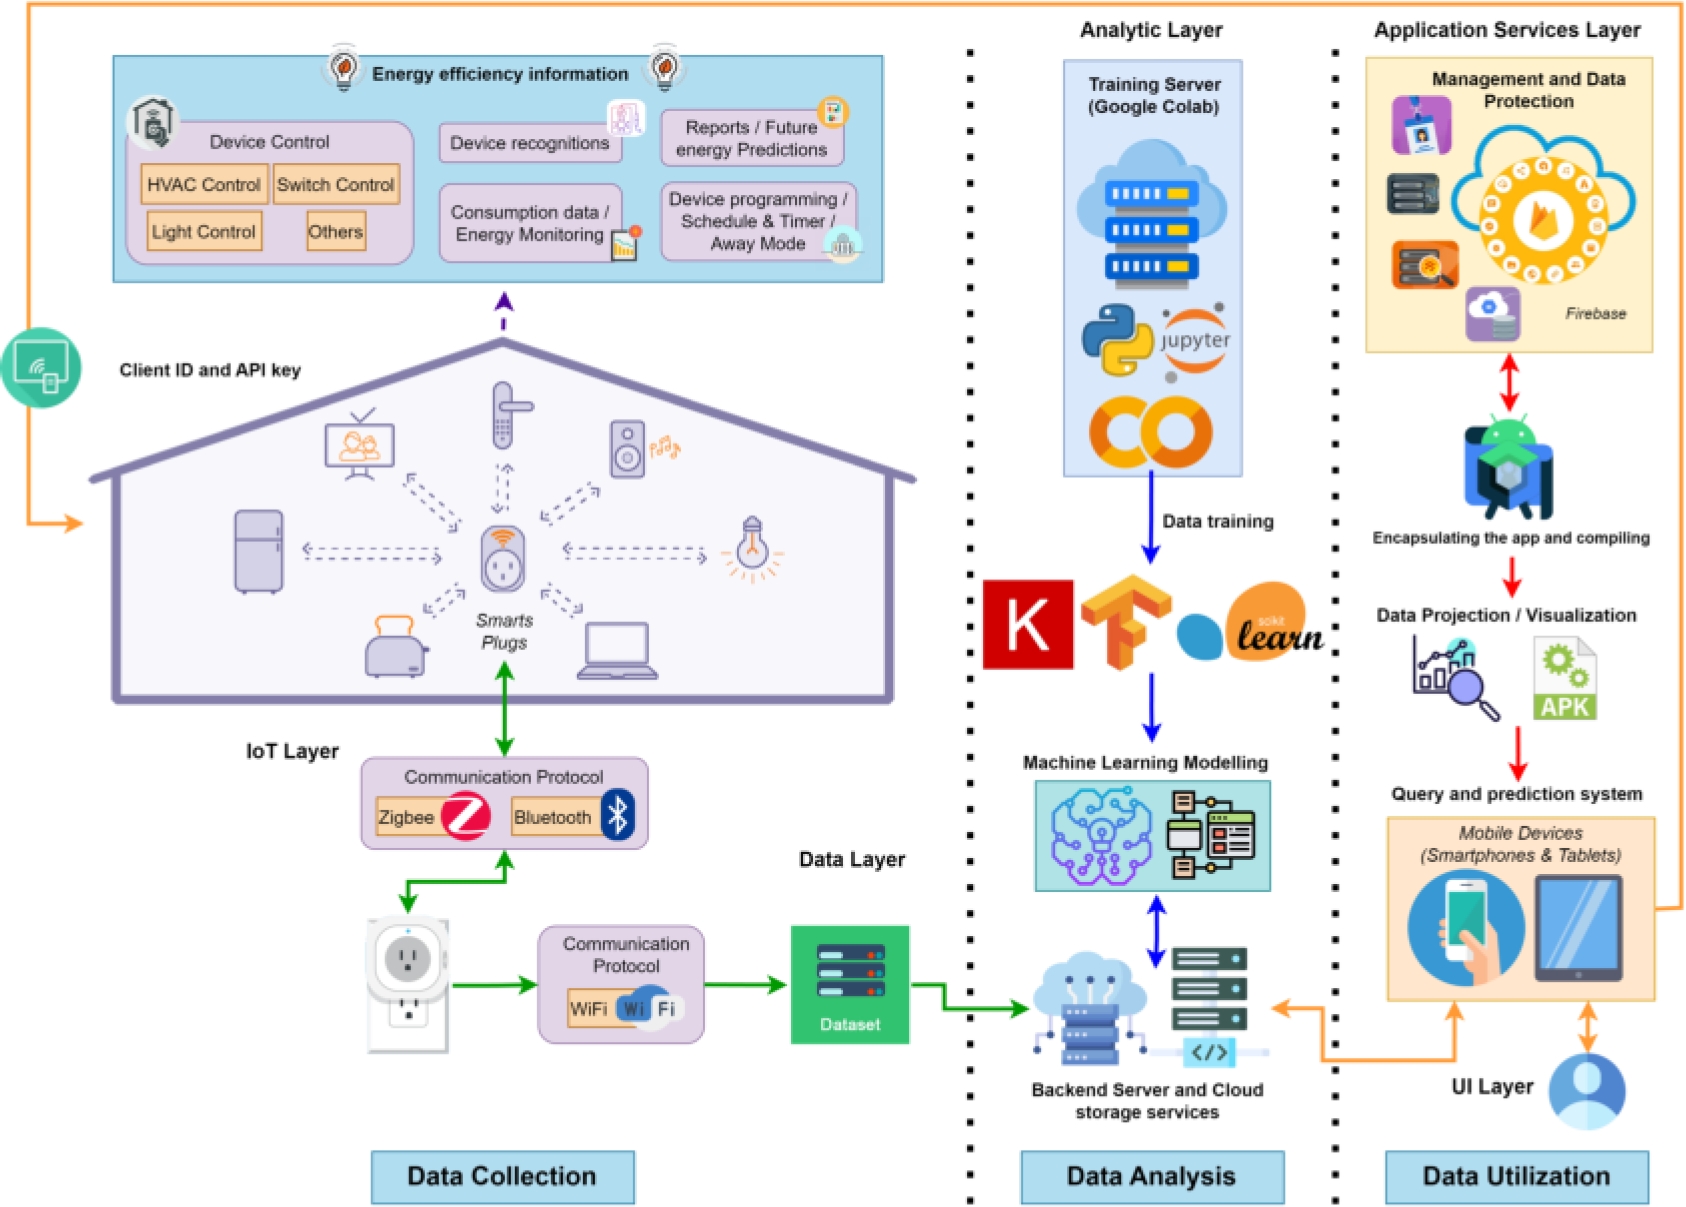
Figure 1, shows the proposed architecture for residential electricity consumption data management [25], which is organized in several stages and layers, integrating hardware and software components as follows:
— Data collection: The first stage of the system focuses on the collection of household electricity consumption data. This is accomplished through smart plugs that connect to appliances and the home Wi-Fi network. These devices periodically collect and send data to a local server, which then transfers the information to a cloud server for storage and further analysis.
— Data analysis: In the second stage, the collected data is analyzed to identify patterns and trends in energy consumption. The data stored in the cloud is processed using machine learning algorithms, implemented on platforms such as Google Colab with libraries such as Keras, TensorFlow, and Scikit-Learn. These algorithms help model and train systems that identify energy consumption patterns, such as the appliances that consume the most energy according to the time of day, days of the week, or seasons of the year.
— Data utilization: Finally, the information obtained from the analysis is used to make decisions related to electricity consumption management. Recommendations are provided to users through the mobile application, helping them identify areas where they can improve their energy efficiency.
3.1 IoT Layer
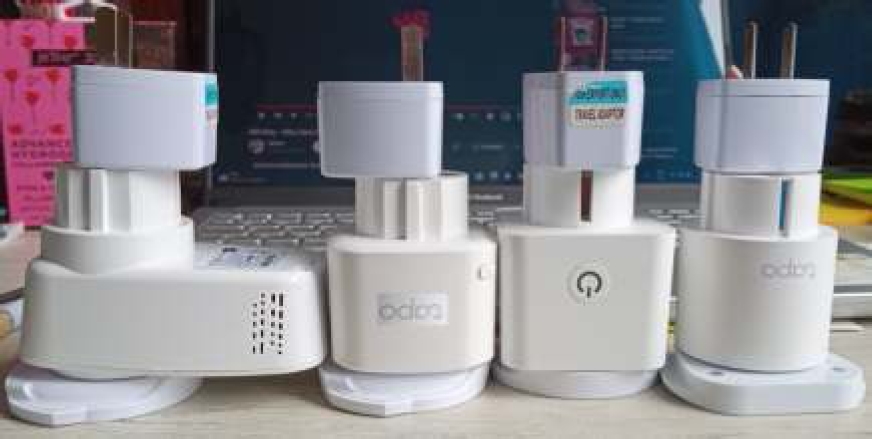
This layer includes smart plugs and appliances, enabling efficient control of energy assets and transforming conventional homes into smart homes. Figure 2 shows the current, voltage and power sensors or smart plugs, allowing energy consumption to be measured and recorded [9, 6].
To monitor and control these devices, the Python-kasa library [5], which manages smart home devices, is used. The discovery process is initiated by executing the
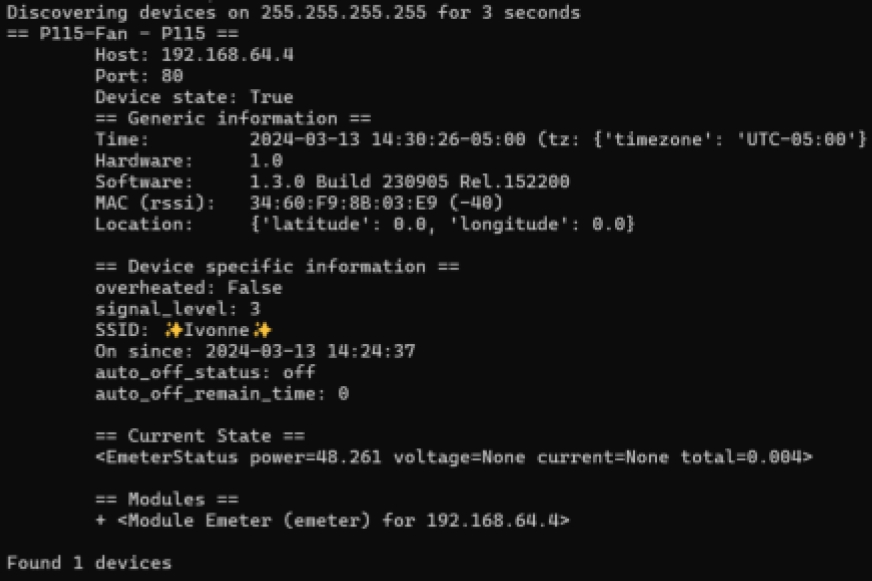
The following functions will be used:
For the implementation of the REST API, the Python programming language has been used with the Flask framework. This API is composed of a series of endpoints used to obtain the plug utility information. An endpoint is defined as one end of a communication channel, which may include the URL of a server or a service. Each endpoint is the location from which the APIs can access the resources necessary to fulfill their function:
— /turn-on: This endpoint allows the socket to be turned on when a POST request is made.
— /turn-off: This endpoint allows turning off the socket when a POST request is made.
— /get-state: This endpoint allows getting the state of the device when a GET request is made.
— /consumption: This endpoint allows obtaining the power consumption when a GET request is made.
3.2 Data Layer
This layer includes the collection of electricity consumption data and the database where all relevant data collected by the system is stored. This database is essential for data analysis and decision making based on the information collected [22, 16].
The central idea is to acquire information from datasets related to residential energy consumption, with the objective of covering a wide range of characteristics relevant to the study in question. Initially, we have the dataset from smart plugs, which consists of a limited collection of information on the electricity consumption of various appliances in specific types of dwellings. To improve the quality of the analysis and strengthen the predictive capability of the algorithms, an additional dataset provided by Eco CO2 will be incorporated, which contains energy consumption data from various appliances.
This dataset was generated using 42 smart plugs distributed in 13 different households as metering devices for one month. The inclusion of this second dataset will allow complementing, enriching, and expanding the variety and depth of information of the variables and characteristics considered in the analysis. The public dataset on energy consumption data is available online on the Kaggle platform [10].
Time series data were collected for each device at 5- to 10-minute intervals, which represent a real-life usage scenario for multiple anonymous users. The datasets contain one-second interval power measurements in watts (W), along with a corresponding timestamp in days and weeks for each device.
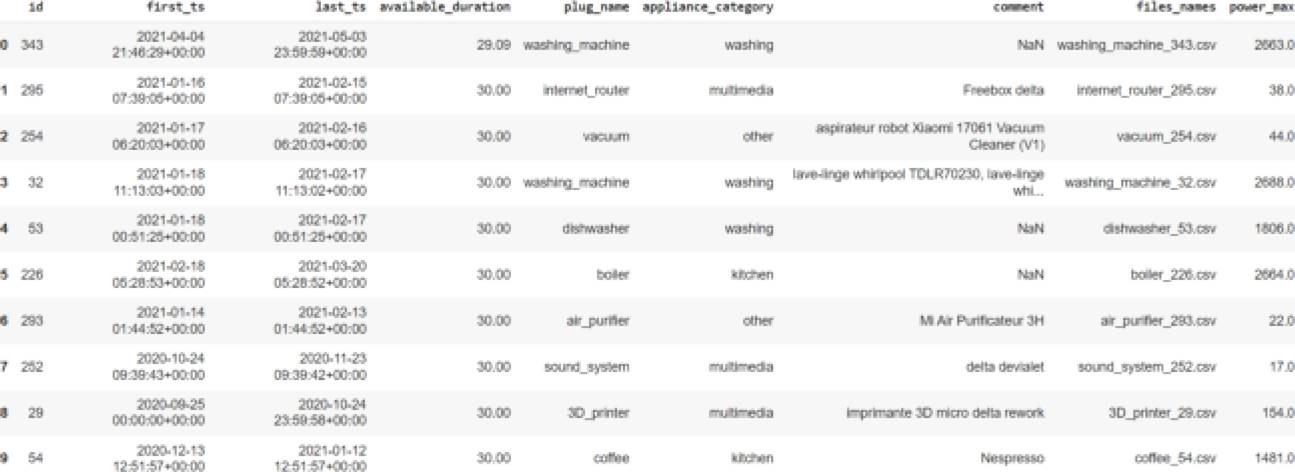
Figure 4, shows the data set which contains the following information:
— id: Unique identifier of the connected device in the dataset.
— first_ts: Represents the first timestamp (date and time) recorded for the device (connected).
— last_ts: Indicates the last timestamp (date and time) recorded for the device (disconnected).
— available_duration: Reflects the total duration of time during which measurements were performed for the device.
— plug_name: Name of the smart plug device (appliance).
— appliance_category: Category of the appliance with which the smart plug device is associated.
— comment: Additional comments or relevant information associated with the device, e.g., appliance brand.
— files_names: Names of the files containing one-second interval power measurements of the device.
— power_max: Represents the maximum power measured for the device.
Each appliance is assigned to one of the available categories according to the “plug_name” column:
— multimedia = [computer, 3D_printer, Internet_router, laptop, phone_charger, printer, screen, TV, Sound_system].
— kitchen = [boiler, coffee maker, freezer, refrigerator, microwave oven].
— washing = [dishwasher, dryer, washing machine].
— cooling = [air_conditioner, fan].
— other = [air_purifier, dehumidifier, radiator, solar_panel, vacuum cleaner].
3.3 Analytic Layer
In this layer, machine learning modeling takes place where algorithms are used to analyze the collected data and provide valuable information, such as energy consumption patterns or energy usage recommendations [15, 14]. To achieve effective prediction of residential energy behavior, it is crucial to employ methods such as time series and regression models. After a thorough analysis of various machine learning prediction algorithm models, three main approaches were decided upon:
1. Time Series Prediction with the Holt-Winter method: Time series analysis involves studying a sequence of data points collected during a specific interval, recording these data at consistent intervals over time [19, 17]. The Holt-Winters method, an exponential smoothing technique, is used to predict results in time series that show seasonality. This method assigns greater weight to more recent observations and decomposes the time series into components such as level, trend, seasonality, and error. This model adds a seasonal parameter to Holt’s model, allowing the treatment of univariate time series that show both trend and seasonality. The additive Holt-Winters model is appropriate when the fluctuations in the data do not depend on the level of the time series, implying that the fluctuations are constant in size over time [16, 11]. Therefore, in this case, the additive Holt-Winters model is applied to make predictions on residential energy consumption. The additive smoothing is based on the calculation of four components shown in the following equations (1, 2, 3, and 4). Exponentially smoothed series or estimated level:
Where:
|
is the smoothed value for the level of the series at time period |
|
is the constant smoothing parameter for the level. |
|
is the actual value of the series at time period |
|
is the trend component of the series for time period |
|
is the constant smoothing parameter for the trend. |
|
is the seasonal component of the series for time period |
|
is the seasonal component of the series calculated for time period |
|
is the constant smoothing parameter for the seasonality. |
|
is the length of time for the seasonality. |
|
is the number of future periods to predict. |
|
is the Holt-Winters prediction for time period |
-
2. Supervised Learning Model XGBoost: Based on decision trees, it improves methods such as random forest and gradient boosting and is ideal for complex data sets, making it a solid choice for our case study [29, 4]. In regression, it allows predicting quantitative variables from explanatory variables, either quantitative or qualitative. To fit a training dataset using XGBoost, an initial prediction is performed. Residuals are calculated based on the predicted value and the observed values. A decision tree is created with the residuals using a similarity score of the residuals. The similarity of the data of a leaf is calculated, as well as the similarity gain of the subsequent split. The gains are compared to determine an entity and a threshold for a node. The output value for each leaf is also calculated using the residuals [20, 18]. XGBoost uses the following parameters to optimize the algorithm and provide better results and higher performance:
— Regularization: a regularization parameter (lambda) is used when calculating similarity scores, to reduce sensitivity to individual data and avoid over-fitting.
— Trimming: A tree complexity parameter (gamma) is selected to compare the gains. The branch where the gain is less than the gamma value is pruned. Avoid over-fitting by cutting unnecessary branches and reducing tree depth.
-
3. Self-Supervised Autoencoder Neural Network LSTM: An LSTM Autoencoder is an implementation of an automatic encoder-decoder, for sequence data that uses a LSTM (Long Short-Term Memory) architecture and are especially suited for modeling temporal sequences [27, 3]. By employing an Autoencoder, we seek to learn meaningful representations of the data that help us to identify complex and subtle patterns in energy behavior [39].
— LSTM encoder-decoder: Reads the input sequence, encodes it into a lower-dimensional representation and then decodes it to recreate the original sequence.
— Performance evaluation: The model is evaluated on its ability to faithfully recreate the input sequence.
— Model tuning: The model is tuned until it reaches a desired level of performance in recreating the sequence.
— Obtaining the encoder: Once the desired performance level is reached, the decoding part of the model is removed, leaving only the encoder.
— Using the encoder: The encoder model is used to convert input sequences into fixed-length vectors.
To analyze the electrical consumption datasets of household appliances, a structured process including the following steps was carried out:
3.3.1 EDA: Exploratory Data Analysis
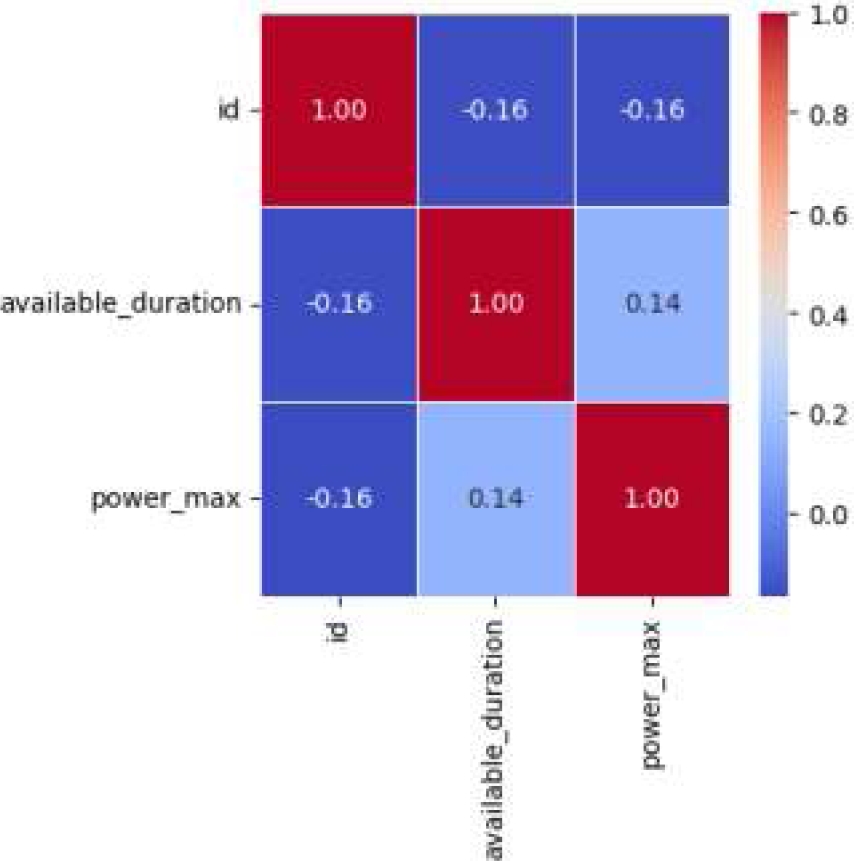
The main objective of the EDA is to obtain initial information and knowledge about the data before applying the modeling techniques [36]. After analyzing the data and observing Figure 5, a low correlation between the variables could be noticed, this indicates that changes in one variable are not strongly related to changes in the other variables.
3.3.2 Data set analysis
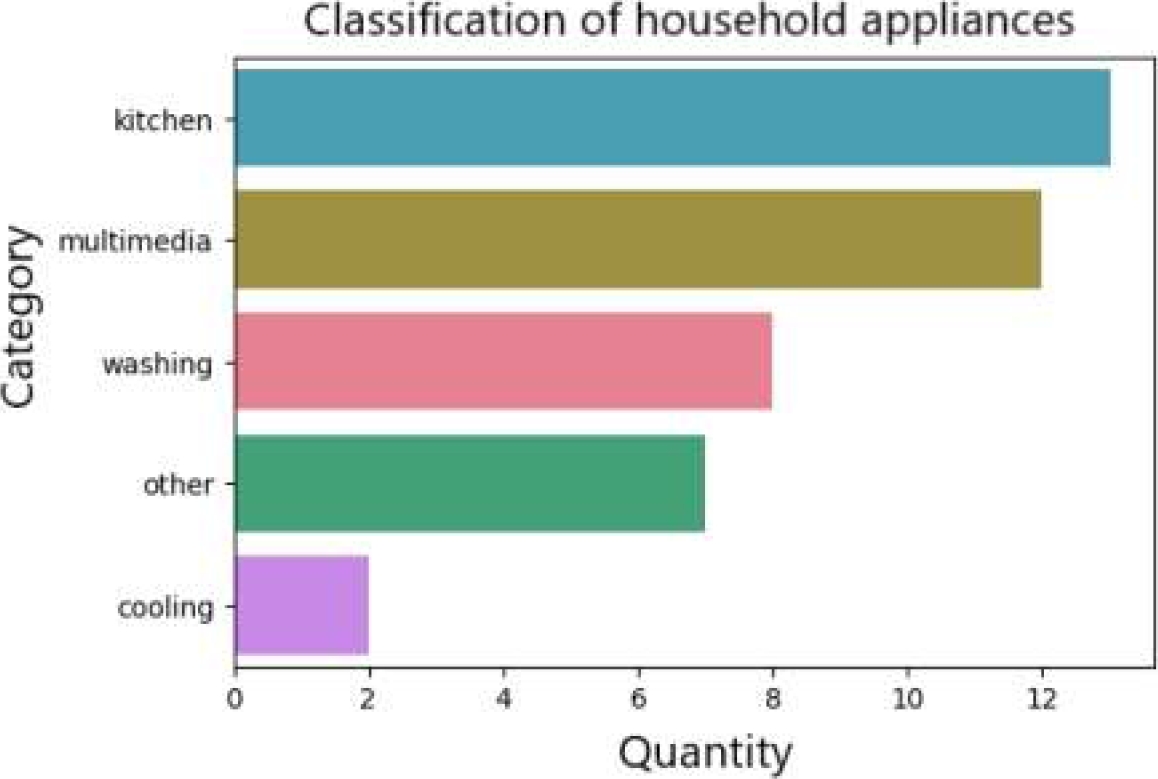
Extraction of characteristic features and classification of load curves of household appliances: A detailed analysis of the data was performed to identify distinctive features in the load curves of the appliances. Subsequently, a classification function was used to group the load curves into different categories of appliances as shown in Figure 6.
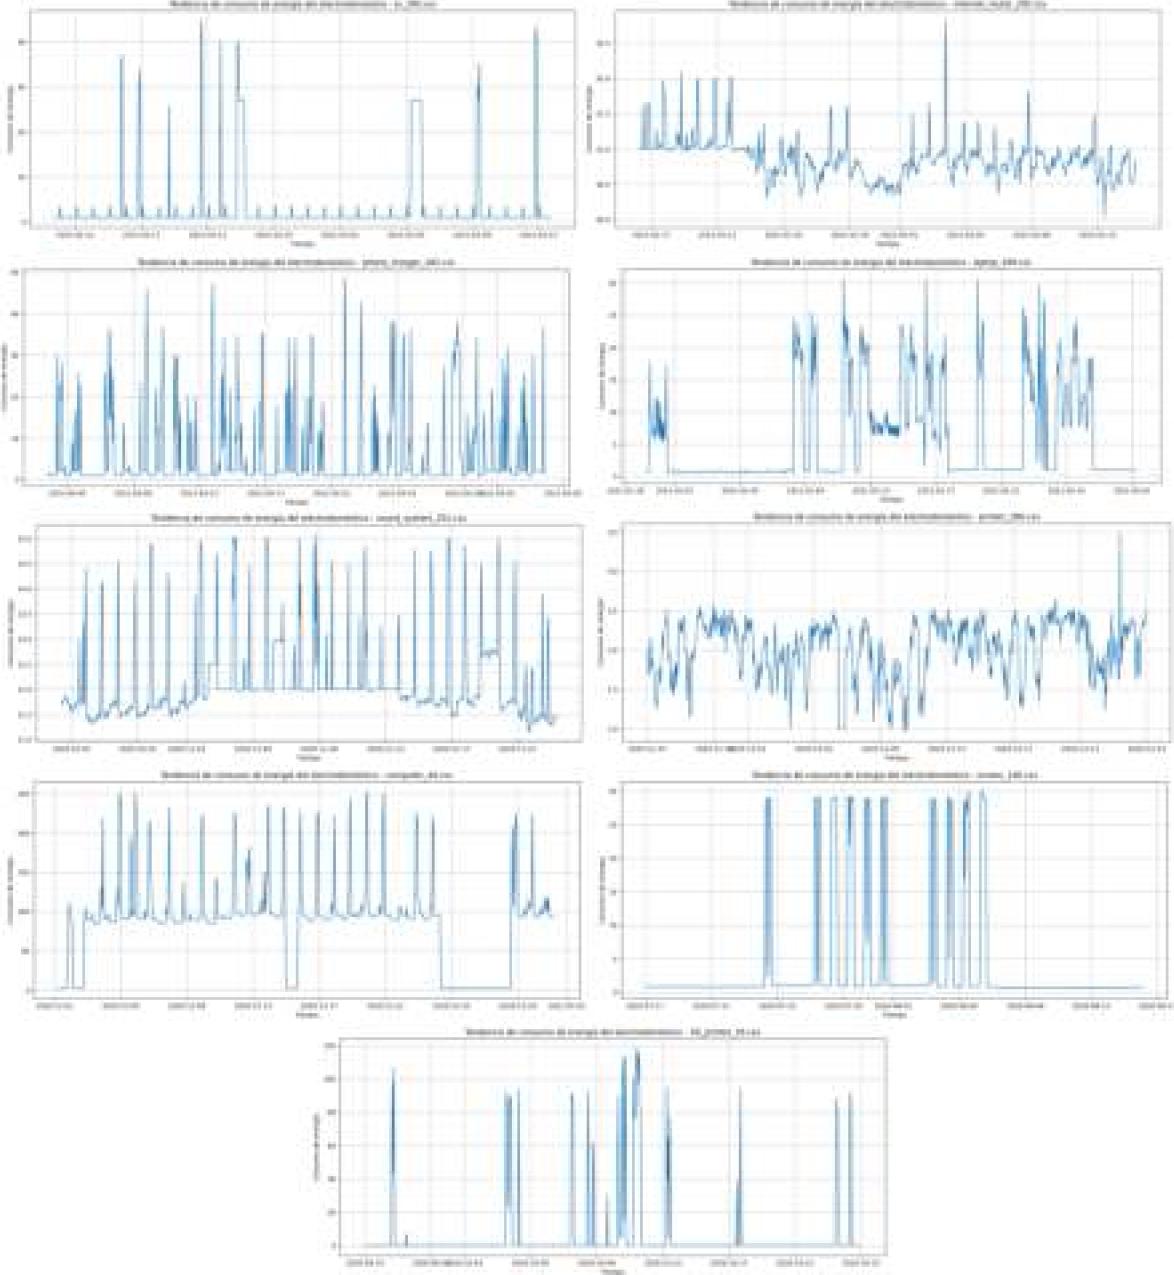
Characterization of characteristic patterns of electricity consumption in the different categories of household appliances identified in the previous stage. To carry out this characterization, the energy consumption patterns of each type of appliance are compared and analyzed. This involves examining factors such as the amount of energy consumed at different times of the day, the duration of each appliance’s activity periods, and any other relevant aspects that may influence electricity consumption. Figure 7, provides visualizations of these electricity consumption patterns for different categories of appliances. This helps to better understand how energy consumption varies by appliance type, which can be useful in making informed energy efficiency and management decisions.
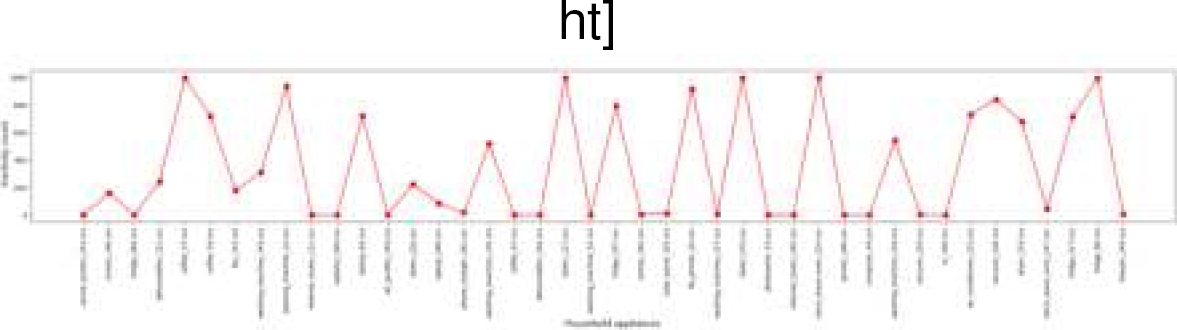
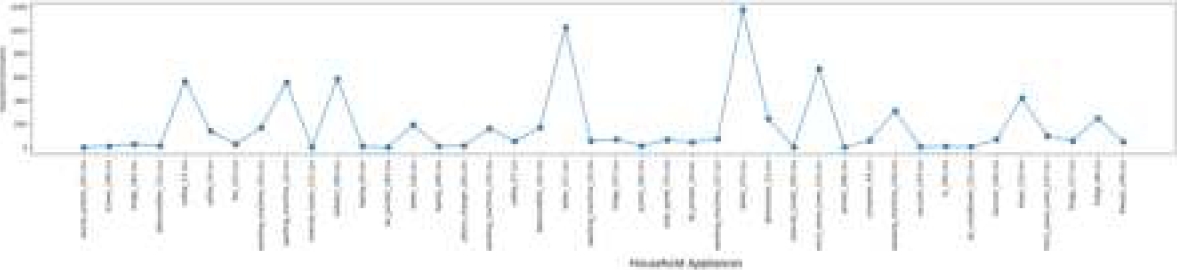
Calculation of the percentage of total standby or idle consumption of appliances: A specific analysis is carried out to determine the percentage of total consumption of an appliance when it is in standby or idle mode. This calculation will provide information on the impact of passive consumption on total household energy consumption as shown in Figure 8.
Simulation of fluctuations in total household electricity consumption: The load curves of the different selected appliances are aggregated to calculate fluctuations in total household electricity consumption. This step will include the consideration of important assumptions, such as the selection of the appliances to be included in the total household consumption profile and the manipulation of time series data, to simulate variations in the consumption patterns of the users as shown in Figure 9.
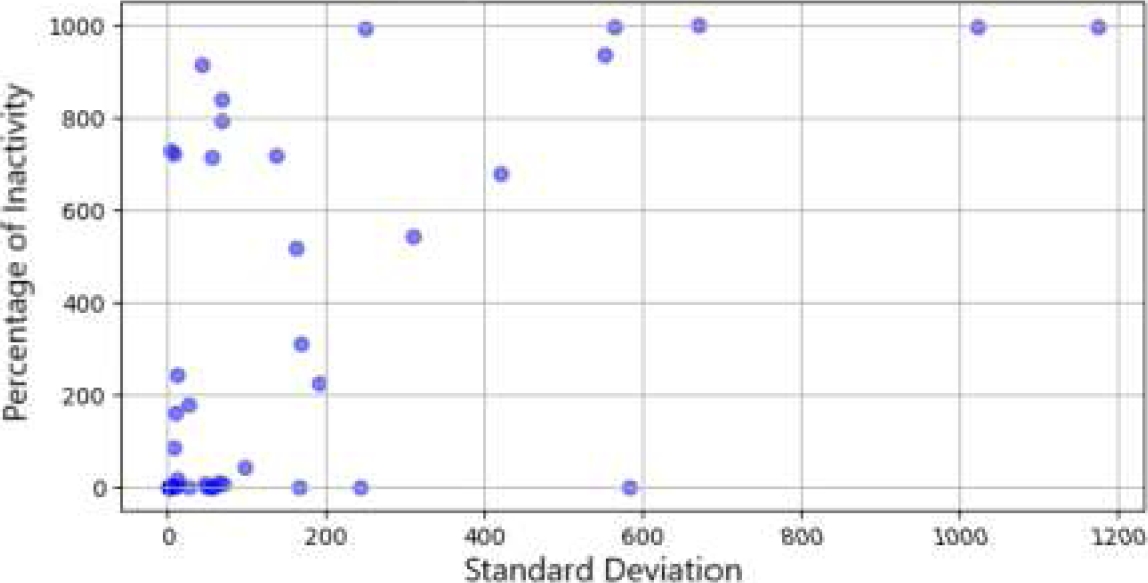
Calculation of the relationship between variability in electricity consumption patterns and device activity. The relationship between variability in power consumption patterns and device activity refers to how changes in device usage and activity affect the amount and way electrical energy is consumed. This involved analyzing how fluctuations in device activity, such as on, off, or power modulation, are reflected in electricity consumption patterns, which can have important implications for energy management and efficiency in homes (see Figure 10).
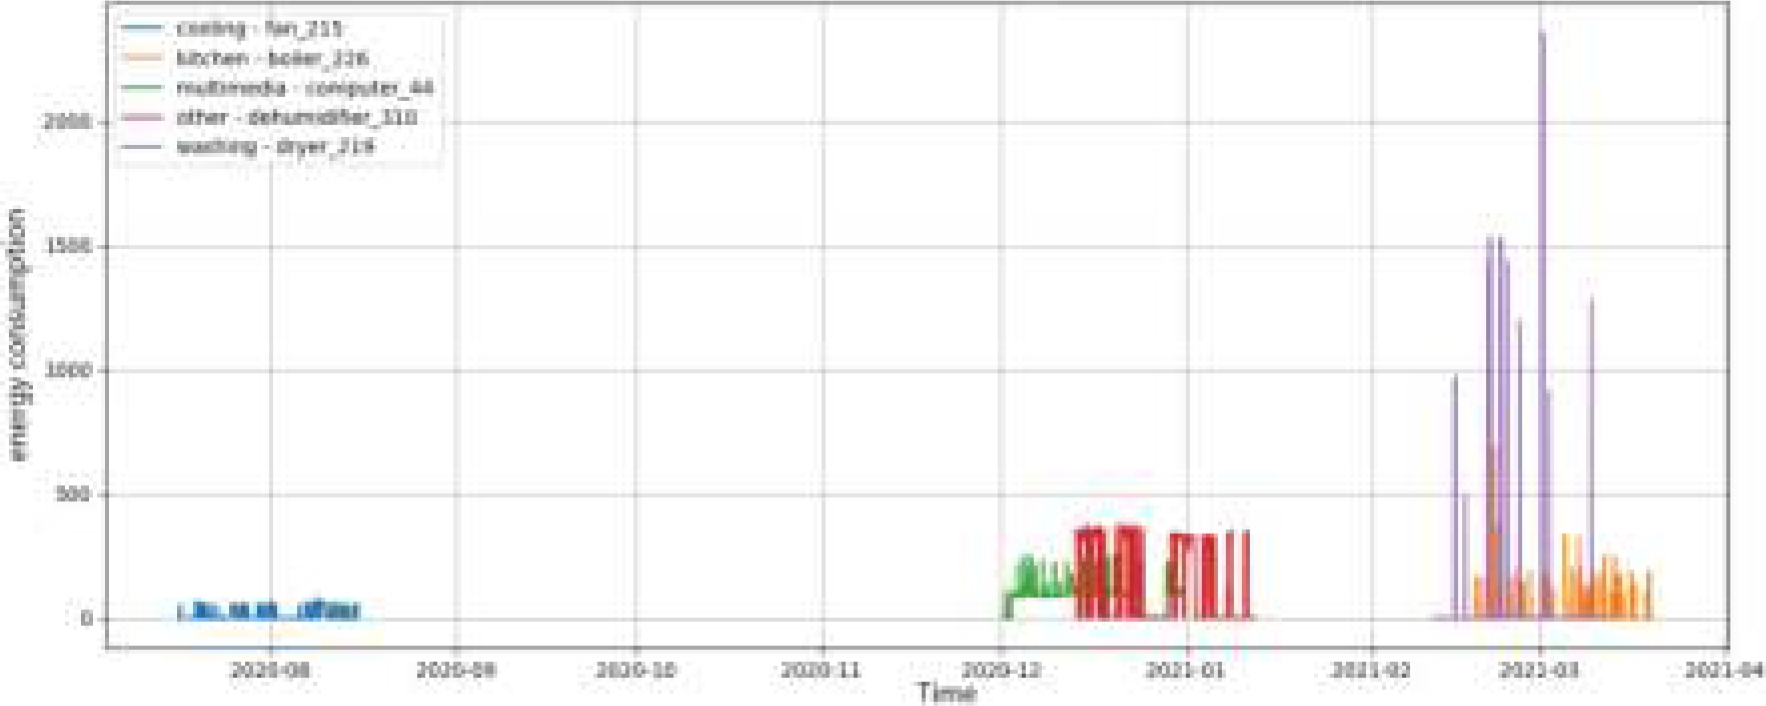
Identification of peak consumption periods and visualization of the impact of load shifting: Peak consumption periods are identified based on available appliance consumption data, by visualizing the impact on peak load if load shifting were applied, that is, redistributing electricity consumption to mitigate peak demand as shown in Figure 11.
3.3.3 Data Modeling
The aforementioned algorithms will be modeled to solve the problem at hand, selecting the relevant features to be used as inputs to the models.
-
— Data preprocessing: First, the time column (timestamp) is converted to Date Time format to effectively handle dates and times.
Then, the timestamp column is set as the index of the DataFrame to facilitate temporal analysis.
The data is resampled to have an hourly frequency. This involves averaging the energy consumption data over one-hour (’H’) intervals, which helps to smooth out short-term variations and highlight more significant trends.
-
— Data division: The data is divided into training and test sets. 80 % of the data is used to train the models, while the remaining 20 % is reserved for evaluating performance and accuracy. For the Holt-Winters and XGBoost models the training set size is calculated by multiplying the total data length and the first samples are selected up to the calculated size.
For the Autoencoder LSTM model the normalized data set is split using the
3.3.4 Model training
Once the models have been configured, they are trained using the training data set. During training, the models adjust their parameters to minimize a loss or error function so that they can make accurate predictions about future data.
-
— Holt-Winters Model: The model is instantiated using the ExponentialSmoothing class from the statsmodels.tsa.holtwinters library and the training data (train) is passed to the model, along with certain parameters. In this case, seasonal=’add’ is specified to indicate that additive seasonality is expected in the data and seasonal_periods=24 to indicate that the seasonality follows a 24-hour (daily) pattern. The model is then fit to the training data using the fit() method. During this process, the model will estimate the parameters that best fit the data and learn the relationships between past observations to make future predictions. The result of the model fit is stored in the model_fit variable, which contains the model already trained and ready to make predictions.
-
— XGBoost model: A new feature is added, in this case, the time of day (hour), which is extracted from the time index of the original data, this provides the model with additional information about the time of day at which the data was recorded.
The combined data is normalized using StandardScaler, this process ensures that all features have a similar scale, which can improve the convergence of the model and the overall performance of the algorithm.
The features (X_train, X_test) are then separated from the target variable (y_train, y_test). The features are selected as all columns except the last one, which is the energy consumption variable (power), this is done to train the model with the input features and predict the response variable. Finally, the model (XGBRegressor) is instantiated in order to minimize the performance error and then train the model using the training and test sets with additional features. During training, the model will adjust its parameters to find the relationship between the input features and the target variable so that it can make accurate predictions on new data.
-
— LSTM Autoencoder Model: The autoencoder architecture is defined as consisting of an input layer (input_layer), an encoded layer (encoded) and a decoded layer (decoded). The encoded layer has 8 neurons with a ReLU activation function, which allows the autoencoder to learn important features from the data. The decoded layer has 1 neuron with a linear activation, resulting in reconstruction of the original data. During training, the autoencoder learns to reconstruct the input data, which involves capturing and compressing important features of the original data.
The model is trained for 50 epochs with a batch size of 32, and validation on the test set (X_test) is used to monitor model performance during training.
3.3.5 Evaluation of models
After training the models, their performance is evaluated using the test dataset. Several performance metrics are calculated that provide information about the model’s ability to generalize to unseen data and its accuracy in making predictions [24, 1]. Error metrics are fundamental tools for comparing the effectiveness of different models and for estimating their performance and reliability. In this context, we seek to minimize the value of these indicators, as this represents a better fit of the model to the observed data [41]. The error metrics that will be calculated to evaluate the performance of the models are:
-
— Mean Squared Error (MSE): It is the mean of the squares of the errors. The lower the MSE, the better the performance of the model.
— Root Mean Squared Error (RMSE): It is the square root of the MSE. It provides a measure of the error in the same unit as the original data, which facilitates its interpretation (see equation 6).
— Mean Absolute Error (MAE): It is the average of the absolute values of the errors. It provides an idea of the magnitude of the average error as seen in equation 7.
Where:
|
are the actual values. |
|
are the predicted values by the model. |
|
is the number of samples (length of the test set). |
We seek to minimize the value of the error indicators (MSE, RMSE and MAE), since this indicates a better fit of the models to the observed data and, therefore, a better predictive capacity.
3.4 User Interface Layer
This layer interacts directly with users through the mobile application that is delivered in APK format [28]. The application serves as the entry point for users interacting with the system as seen in the figure 12.
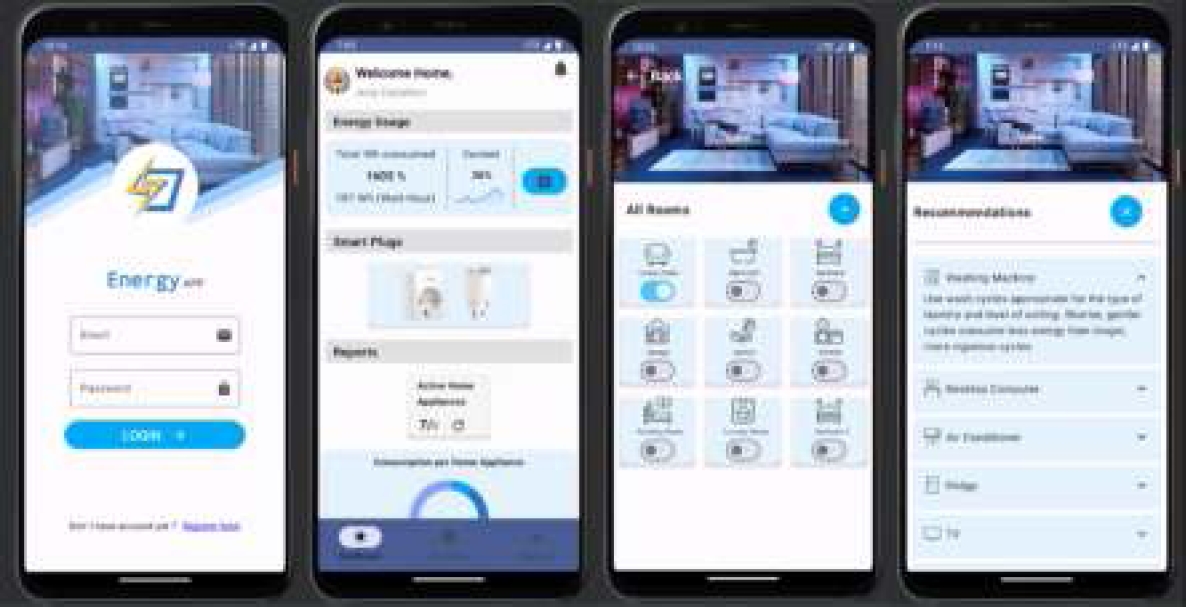
The developed application represents a high-fidelity prototype designed natively for Android devices, using the Model-View-ViewModel (MVVM) architecture to ensure an organized and modular structure [23]. High-fidelity prototypes are essential tools in the advanced stages of application development, as they closely resemble the final product in terms of design, interactivity, and functionality. This close similarity allows a thorough evaluation of crucial aspects such as usability, aesthetics, and functionality of the application design.
The user using the mobile application receives the energy efficiency information in the following way:
— The mobile application communicates with the cloud service via the internet. This communication is established using a ”Client ID and API Key,” ensuring authentication and secure communication with the cloud infrastructure or backend server.
— The mobile application makes requests to the server to obtain the power consumption data of the smart plugs associated with the user. These requests can be periodic, for example, every time the user opens the application or at set time intervals.
— Upon receiving the data request, the server retrieves the power consumption information from the corresponding smart plugs and transfers it to the mobile application through the established connection.
— Once the mobile application receives the power consumption data, it processes the information and displays it to the user in an understandable way. This can include graphs showing power consumption over time, Statistics summarizing energy usage, comparisons of current consumption with past data and Personalized energy-saving recommendations.
The user interface is designed to be intuitive and user-friendly, enabling users to easily navigate through the different features of the application. The main components of the user interface include:
— Dashboard: Provides an overview of the user’s current energy consumption, displaying key metrics and visualizations at a glance.
— Detailed View: Allows users to drill down into specific data points, view detailed consumption history, and analyze trends over time.
— Notifications: Alerts users to important events, such as abnormal consumption patterns or reminders to implement energy-saving recommendations.
— Settings: Enables users to customize their experience, manage their smart plugs, and configure notification preferences.
By offering a seamless and engaging user experience, the mobile application aims to empower users to take control of their energy consumption, making energy-saving efforts more accessible and effective.
3.5 Application Services Layer
This layer contains several essential components for the system’s operation, including user authentication and session management, which indicates that the system can manage multiple users and maintain session security and persistence. It also handles data management, enabling the system to collect and process energy usage information to prepare reports and predictions on future energy consumption [33, 35, 2].
Firebase was used here as a cloud platform to manage all the information through the following functions:
— The power of the Firebase ML API was leveraged along with the Google Colab environment to implement the developed ML algorithms in an efficient and scalable manner, providing the prototype mobile application with intelligent and enriching capabilities that enhance user interaction and offer personalized and contextual experiences.
— User Authentication: Firebase provides a complete user authentication system that allows you to manage user registration, login and identity verification in a secure way, through email and password login.
— Realtime Database: Firebase Realtime Database is a cloud database that allows you to store and synchronize data in real time between application clients. This feature is used to store application data securely in the Firebase cloud, with options to set custom security rules that control who can read and write to the database.
— Cloud Storage: Firebase Storage provides a scalable and secure cloud storage service for files. It allows secure uploading and downloading of files from within the application, with options to control access permissions and controlled file sharing.
— Cloud Firestore: Firestore is a flexible and scalable document database that allows you to organize and query data efficiently. Like Firebase Realtime Database, Firestore offers customized security rules to protect stored data and ensure secure access.
— Cloud Functions: Firebase Functions allows you to implement custom server logic in the Firebase cloud. This is useful for performing complex or sensitive server-side operations, such as data processing, input validation, push notifications, and other tasks requiring secure access to data.
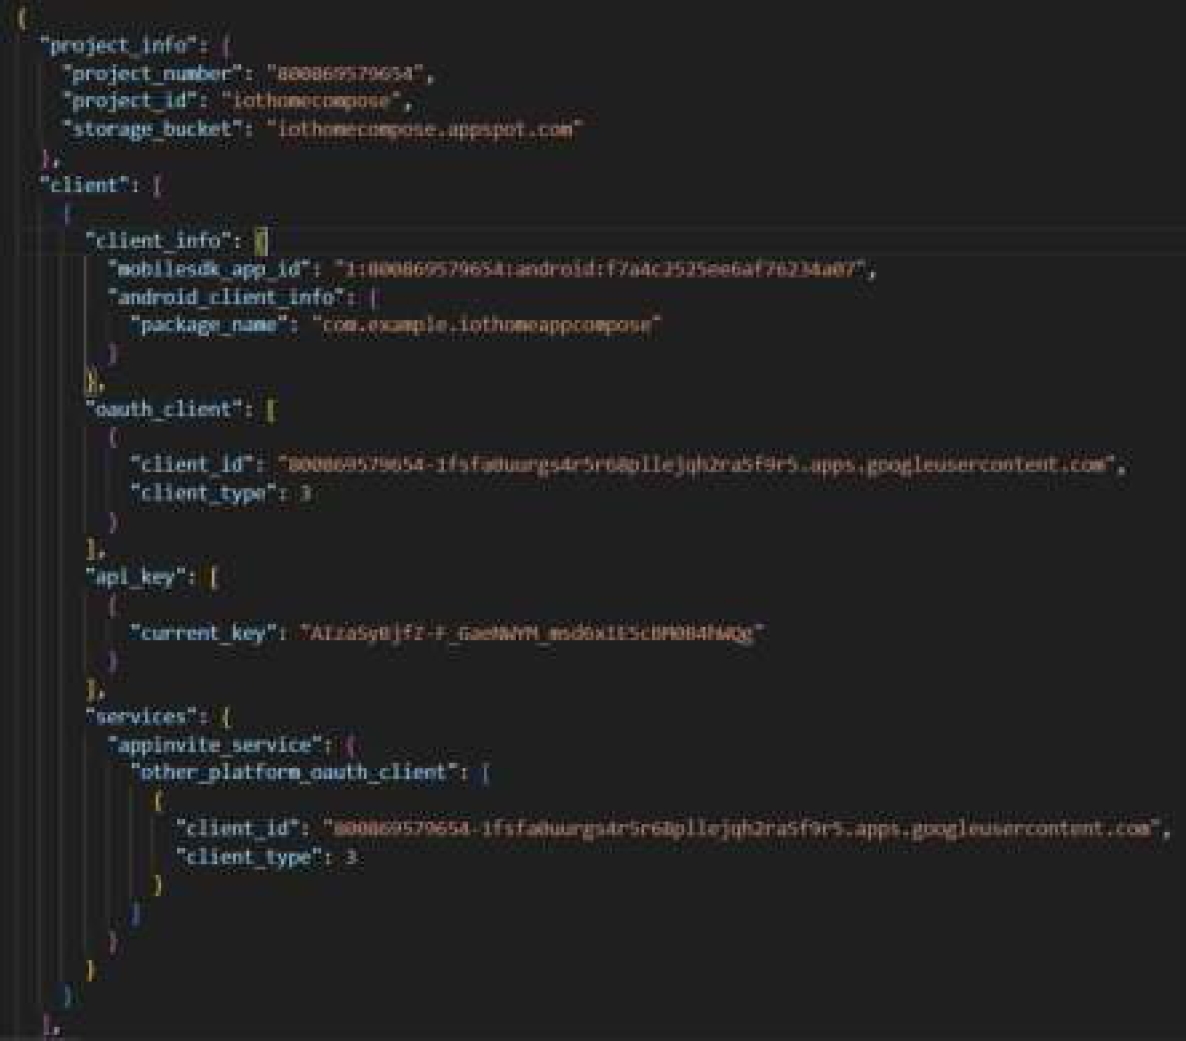
Figure 13 presents the scripts used in the initial Firebase programming phase. At this stage, APIs, JSON, client identifiers and specific variable logic were used to ensure the correct functioning of the application’s functionalities.
4 Results and Discussion
This section presents the results obtained from the research and discusses their relevance and implications for the proposed objectives. Initially, the implementation process of the system for collecting and analyzing electricity consumption data using IoT smart plugs is described. Subsequently, the results of applying machine learning algorithms to predict energy consumption patterns and the impact of personalized recommendations and gamification on user behavior are presented.
4.1 Implementation of the Data Collection System
The proposed system was successfully implemented, enabling the collection of real-time electricity consumption data from various household appliances. Smart plugs were installed in a sample of residential homes, and data were collected over three months. The smart plugs periodically sent data to a local server, which then transferred the information to a cloud server for storage and further analysis.
Figure 14 shows some visualizations of the predictions generated by the models for various appliances. In each graph, the training and test data are presented, along with the current and future predictions.
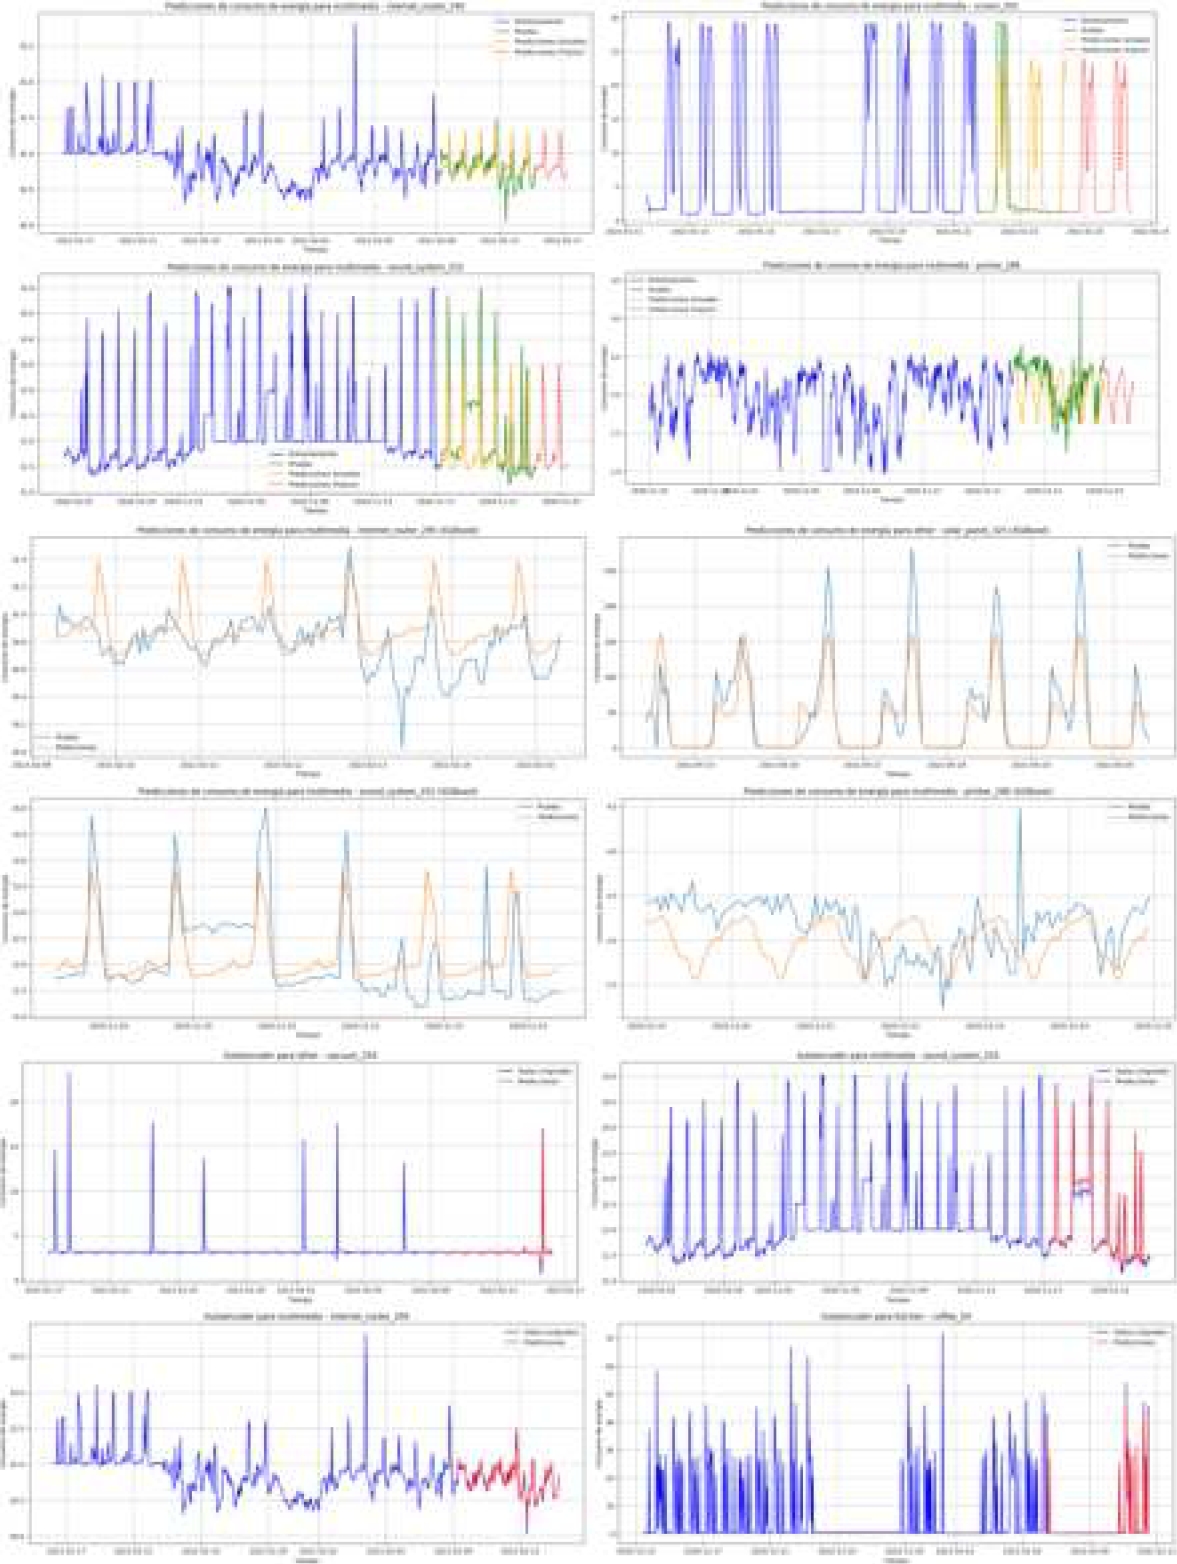
The collected data were analyzed to identify patterns and trends in energy consumption. For example, it was observed that certain appliances, such as air conditioners and refrigerators, showed distinct patterns of energy consumption, with higher usage during specific times of the day and certain seasons. This information was used to develop machine learning models to predict future energy consumption patterns.
4.2 Machine Learning Model Performance
Three machine learning models were developed and evaluated: Holt-Winters, XGBoost, and LSTM Autoencoder. The performance of these models was assessed using metrics such as Mean Squared Error (MSE), Root Mean Squared Error (RMSE), and Mean Absolute Error (MAE).
— The Holt-Winters model was applied to the time series data, and the results indicated a reasonable level of accuracy in predicting energy consumption patterns. The model was able to capture the seasonality and trends in the data, but its performance was limited by its reliance on past observations, making it less effective in predicting sudden changes in consumption patterns.
— The XGBoost model outperformed the Holt-Winters model, providing more accurate predictions of energy consumption patterns. The model’s ability to handle complex data and incorporate multiple features contributed to its improved performance. The inclusion of features such as the time of day and appliance type helped the model make more informed predictions.
— The LSTM Autoencoder model showed the highest accuracy among the three models, effectively capturing the temporal dependencies in the data. The model’s ability to learn meaningful representations of the data allowed it to predict future consumption patterns with high precision. The results demonstrated that the LSTM Autoencoder model is well-suited for applications requiring accurate predictions of energy consumption.
The results of performance metrics may vary over time, different appliance models may have different efficiency levels, some appliances may present additional challenges in terms of predictability due to their nature and variability in energy consumption, and finally, external and environmental factors may also affect the energy consumption of appliances.
The table 1, shows the effectiveness of each algorithm as a function of the performance metrics for each appliance by category.
Table 1 Results of the Performance Metrics of the different models for household appliances
| Category | Household Appliance (id) | Performance evaluation (metrics) | ||||||||
| Holt-Winters | XGBoost | Autoencoder LSTM | ||||||||
| MSE | RMSE | MAE | MSE | RMSE | MAE | MSE | RMSE | MAE | ||
| Washing | Washing_machine_343 | 6480.1 | 80.4 | 21.90 | 19.36 | 6497.7 | 36.85 | 0.005 | 0.077 | 0.066 |
| Washing_machine_32 | 4381.7 | 66.1 | 19.18 | 18.50 | 4323.6 | 36.85 | 9.07 | 3.011 | 0.838 | |
| Dishwasher_53 | 29072 | 170.5 | 82.38 | 71.65 | 28152 | 36.85 | 55.62 | 7.45 | 2.25 | |
| Washing_machine_157 | 831.8 | 28.8 | 5.13 | 5.50 | 850.43 | 36.85 | 10.47 | 3.23 | 0.89 | |
| Washing_machine_52 | 670.5 | 25.8 | 5.34 | 4.43 | 672.85 | 36.85 | 125.30 | 11.19 | 1.26 | |
| Washing_machine_135 | 33500 | 183 | 44.38 | 44.09 | 33419 | 36.85 | 11953 | 109.3 | 24.35 | |
| Dryer_219 | 11321 | 106.4 | 43.33 | 36.94 | 11604 | 36.85 | 19.32 | 4.39 | 0.78 | |
| Washing_machine_218 | 8954.3 | 94.6 | 44.1 | 36.27 | 8596.9 | 36.85 | 34.35 | 5.86 | 1.19 | |
| Multimedia | Internet_router_295 | 0.03 | 0.18 | 0.13 | 0.14 | 0.04 | 36.85 | 0.00 | 0.023 | 0.015 |
| Sound_system_252 | 0.48 | 0.69 | 0.45 | 0.48 | 0.42 | 36.85 | 0.000 | 0.06 | 0.053 | |
| 3D_printer_29 | 259.5 | 16.1 | 8.48 | 8.91 | 264.3 | 36.85 | 1.02 | 1.01 | 0.26 | |
| Pone_charger_282 | 97.7 | 9.8 | 6.9 | 6.51 | 100.7 | 36.85 | 0.25 | 0.50 | 0.34 | |
| Laptop_289 | 52.5 | 7.2 | 6.2 | 6.15 | 54.01 | 36.85 | 0.045 | 0.21 | 0.13 | |
| Tv_290 | 55.1 | 7.4 | 2.4 | 3.29 | 54.49 | 36.85 | 0.68 | 0.83 | 0.34 | |
| Screen_302 | 87.44 | 9.35 | 5.23 | 5.24 | 86.7 | 36.85 | 21.18 | 4.60 | 4.56 | |
| Screen_146 | 38.6 | 6.21 | 3.87 | 4.02 | 39.87 | 36.85 | 0.02 | 0.14 | 0.14 | |
| Laptop_64 | 20.34 | 4.51 | 2.92 | 2.92 | 20.33 | 36.85 | 0.11 | 0.34 | 0.14 | |
| Computer_44 | 5085.6 | 71.3 | 53.01 | 61.23 | 5500.8 | 36.85 | 3.66 | 1.91 | 1.50 | |
| Printer_286 | 0.14 | 0.37 | 0.28 | 0.32 | 0.16 | 36.85 | 0.002 | 0.05 | 0.03 | |
| Internet_router_131 | 0.51 | 0.71 | 0.47 | 0.74 | 0.63 | 36.85 | 0.011 | 0.10 | 0.04 | |
| Other | Vacuum_254 | 1.86 | 1.36 | 0.40 | 0.40 | 1.86 | 36.85 | 0.06 | 0.255 | 0.06 |
| Air_purifier_293 | 0.008 | 0.09 | 0.07 | 0.43 | 0.19 | 36.85 | 0.00 | 0.01 | 0.017 | |
| Radiator_309 | 487052 | 697.8 | 626.5 | 288.1 | 104911 | 36.85 | 636.59 | 25.23 | 17.04 | |
| Dehumidifier_310 | 34076 | 184.5 | 128.9 | 164.8 | 30219 | 36.85 | 2.30 | 1.51 | 0.51 | |
| Vacuum_236 | 57.5 | 7.5 | 1.9 | 1.88 | 57.06 | 36.85 | 0.077 | 0.27 | 0.27 | |
| Dehumidifier_322 | 611.4 | 24.7 | 19.07 | 13.13 | 394.4 | 36.85 | 0.42 | 0.65 | 0.18 | |
| Solar_panel_325 | 959.66 | 30.97 | 20.67 | 17.74 | 1016.5 | 36.85 | 93.59 | 9.67 | 5.47 | |
| Kitchen | Boiler_226 | 1223.3 | 34.9 | 20.75 | 17.12 | 1024.1 | 36.85 | 19.27 | 4.39 | 1.22 |
| Coffee_54 | 136.45 | 11.68 | 8.86 | 6.92 | 116.6 | 36.85 | 0.89 | 0.94 | 0.30 | |
| Fridge_317 | 3.003 | 1.73 | 1.50 | 1.46 | 2.89 | 36.85 | 0.05 | 0.22 | 0.19 | |
| Micro_wave_oven_314 | 87.64 | 9.36 | 1.84 | 1.72 | 87.85 | 36.85 | 0.001 | 0.04 | 0.006 | |
| Coffee_37 | 230.5 | 15.18 | 5.57 | 6.33 | 195.55 | 36.85 | 0.02 | 0.14 | 0.02 | |
| Boiler_233 | 640.08 | 25.29 | 12.63 | 13.19 | 661.94 | 36.85 | 5.30 | 2.30 | 0.34 | |
| Micro_wave_oven_147 | 344.20 | 18.55 | 8.30 | 8.990 | 348.87 | 36.85 | 195.00 | 13.96 | 3.01 | |
| Frige_284 | 236.48 | 15.3 | 8.69 | 8.69 | 237.3 | 36.85 | 0.34 | 0.58 | 0.46 | |
| Coffee_97 | 183.74 | 13.55 | 12.38 | 11.51 | 169.6 | 36.85 | 2.63 | 1.62 | 1.10 | |
| Fridge_98 | 243.31 | 15.59 | 8.46 | 7.43 | 241.83 | 36.85 | 4.93 | 2.22 | 0.63 | |
| Boiler_217 | 756.5 | 27.5 | 12.8 | 13.01 | 755.30 | 36.85 | 9.18 | 3.03 | 0.48 | |
| Freezer_249 | 1358.3 | 36.8 | 32.23 | 32.68 | 1351.08 | 36.85 | 10.7 | 3.27 | 2.51 | |
| Fridge_207 | 24.83 | 4.98 | 3.33 | 4.29 | 25.39 | 36.85 | 0.54 | 0.73 | 0.63 | |
| Cooling | Fan_215 | 2592.3 | 50.91 | 46.48 | 17.67 | 476.5 | 36.85 | 0.46 | 0.68 | 0.28 |
| Air_conditioner_22 | 36.44 | 6.03 | 5.24 | 2.11 | 10.61 | 36.85 | 0.018 | 0.13 | 0.06 | |
For the prediction of new consumption data, the Autoencoder LSTM model was used, which has shown great potential in this case. This model takes advantage of the ability of the LSTM layers to capture the complex temporal dependencies in the electricity consumption data, which allows accurate prediction of future consumption behavior. By using the LSTM Autoencoder as the best model, it is possible to more effectively anticipate fluctuations in residential electricity consumption and make informed decisions to improve energy use. Figure 15, shows the energy consumption for two appliances and the predictions for this new residential electricity consumption data.
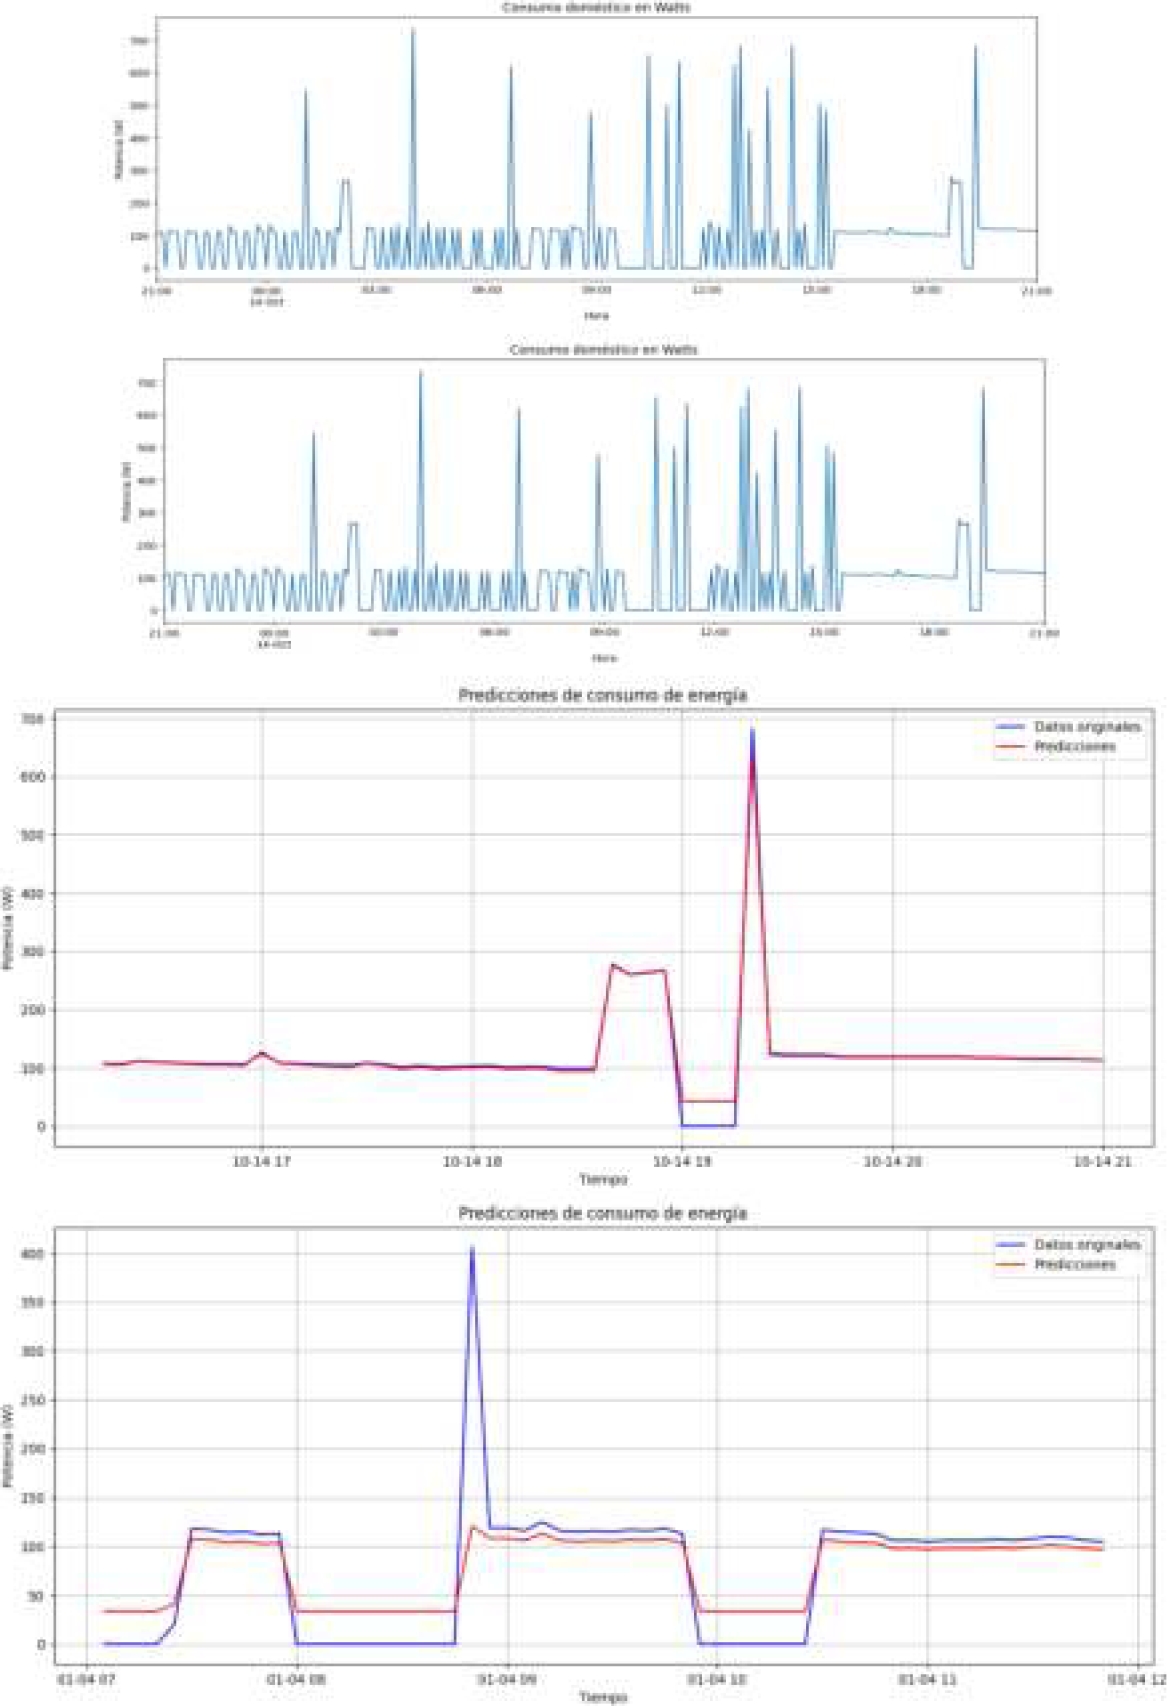
The implementation of these algorithms has demonstrated that the models are able to accurately predict energy consumption at different periods of the day and under various conditions. The combination of IoT sensor data with advanced machine learning techniques has provided detailed insight into the behavior of energy consumption.
4.3 Impact of Personalized Recommendations and Gamification
The mobile application developed as part of this research provided users with personalized energy-saving recommendations and gamification elements to motivate behavior change. Users received notifications about their energy consumption patterns, along with suggestions for reducing unnecessary consumption. The gamification elements included rewards and challenges that encouraged users to adopt energy-saving practices.
The impact of these features on user behavior was assessed through surveys and usage data analysis. The results indicated that users who received personalized recommendations and participated in gamification activities showed a significant reduction in their energy consumption compared to users who did not.
The findings suggest that personalized recommendations and gamification can effectively motivate users to adopt energy-saving behaviors, contributing to overall energy efficiency and sustainability.
The prototype represents an initial phase in the development of the mobile application for residential energy consumption, therefore, the fundamental quality of the application is evaluated through a series of criteria and tests established by the Android developer community [23]. These criteria and tests ensure a reliable and high quality user experience, as detailed in Table 2.
Table 2 Criteria and tests for Android app quality
| Criteria and test for basic app quality | Checklist |
| Visual Experience: The app follows standard Android design patterns, using Material Design components for a modern and consistent look and feel. | ✓ |
| User Interface and Graphics: The app supports different screen orientations, maintains good visual quality and adapts correctly to different screen sizes. | ✓ |
| Accessibility: The application is accessible to all users and displays adequate contrast between text and background. | ✓ |
| Functionality: The application meets the intended functions or minimum requirements. | ✓ |
| Performance and Stability: The app loads properly, has good stability and is compatible with the latest versions of Android. | ✓ |
| Privacy and Security: The app protects user data, requests only necessary permissions, stores data securely, and complies with privacy policies. | ✓ |
| Notifications: Notifications follow design guidelines and are relevant to the user. | ✓ |
| Testing and Test Environment Configuration: Extensive testing was performed on different Android devices and versions, using emulators and real devices. | ✓ |
Users who interacted with the application showed a tendency to reduce their energy consumption, influenced by the personalized recommendations and gamification incentives. This suggests that personalization and gamification elements can be effective in motivating changes in energy consumption behavior.
4.4 Discussion
The results of this research demonstrate the potential of IoT technology and machine learning algorithms to manage and reduce residential energy consumption. The successful implementation of the data collection system and the development of accurate predictive models highlight the feasibility of using these technologies to promote energy efficiency in homes. While other research has used traditional energy monitoring methods [24, 7, 18], this study is notable for the integration of IoT devices for real-time data collection, providing a more accurate and up-to-date view of energy consumption.
The research analyzed specific energy consumption patterns of various household appliances, identifying those with the greatest impact and proposing more efficient usage strategies. Unlike studies that address energy consumption in aggregate [1, 3, 19], this research provides a detailed analysis by appliance type, allowing for the identification of specific areas for improvement and optimization.
Previous studies have used simpler models such as linear regression or rule-based techniques to predict energy consumption [39, 27, 35]. The present research, by employing advanced models such as the LSTM Autoencoder, provides greater accuracy and ability to capture complex patterns, thus overcoming the limitations of traditional methods by highlighting the importance of using advanced machine learning techniques to capture complex patterns in energy consumption data.The model’s ability to predict future consumption with high accuracy provides valuable information that can serve as a basis for energy management strategies.
Much research has focused only on the technical aspect of energy consumption prediction without considering user interaction [16, 28, 42]. The combination of personalized recommendations and gamification in this research addresses the behavioral dimension, offering a more holistic and effective solution for energy management.The positive impact of personalized recommendations and gamification on user behavior further under-scores the need for user-centric approaches to energy management. By engaging users and providing them with practical information, it is possible to foster a culture of energy conservation and achieve significant reductions in household energy consumption.
Overall, this research contributes to the development of innovative solutions for energy management, leveraging the power of IoT and machine learning to create more sustainable and efficient homes.
5 Conclusion and Future Work
The development of a mobile architecture for managing residential electricity consumption data using IoT smart plugs and machine learning algorithms has demonstrated significant potential to improve energy efficiency and promote sustainable consumption practices. The implementation of the data collection system, coupled with the development of predictive models, has provided valuable insights into household energy consumption patterns.
The use of the Holt-Winters, XGBoost, and LSTM Autoencoder models has shown varying degrees of success in predicting energy consumption patterns, with the LSTM Autoencoder model demonstrating the highest accuracy. This suggests that advanced machine learning techniques can effectively capture the complexities of energy consumption data, providing accurate and reliable predictions.
Moreover, incorporating personalized recommendations and gamification elements within the mobile application has proven effective in motivating users to adopt energy-saving behaviors. Users who received personalized recommendations and participated in gamification activities showed a significant reduction in their energy consumption, highlighting the importance of user engagement in achieving energy efficiency.
This research underscores the importance of integrating IoT and machine learning technologies in residential energy management systems. By leveraging these technologies, it is possible to develop innovative solutions that not only improve energy efficiency but also actively involve users in the process. The results of this research contribute to the ongoing efforts to promote sustainability and reduce the environmental impact of energy consumption in residential settings.
Future work will focus on further refining the predictive models and expanding the dataset to include a broader range of appliances and user behaviors. Additionally, exploring the integration of renewable energy sources and smart grid technologies into the system will be a key area of future research. By continuing to develop and enhance these technologies, it will be possible to create more effective and comprehensive energy management solutions for residential environments.

