


 nueva página del texto (beta)
 Inglés (pdf)
 Artículo en XML
 Referencias del artículo
 Enviar artículo por email
 Citado por SciELO
  Similares en
SciELO
Similares en
SciELO 
 Permalink
1 Introduction
An important research question in the larger area of precision agriculture is the real-time monitoring of crop development phases [21]. Precision farming uses information and communication technology to increase agricultural production’s effectiveness and sustainability [16]. Creating precise and reliable tools for crop growth and development monitoring is one of the critical issues in precision agriculture [14]. With this knowledge, irrigation, fertilization, and pest control procedures may be even more effective, increasing crop output and quality [1]. Visual inspection and manual sampling are time-consuming and labor-intensive traditional crop growth monitoring methods. Additionally, they are susceptible to mistakes, especially in vast fields. Real-time crop growth monitoring using remote sensing and other technologies has recently gained popularity [11]. For instance, information on crop canopy cover, leaf area index, and other essential growth indicators may be gathered via satellite photography [5], drones [17], and ground-based IoT devices drones [4]. A few issues still need to be resolved before farmers extensively use real-time crop growth monitoring. Creating precise and reliable algorithms to derive crop growth information from remote sensing data is difficult. Another difficulty is developing low-cost, easy-to-use crop growth monitoring devices that can be used broadly.
Our study is focused on overcoming the enormous challenges of monitoring and evaluating Vicia faba development dynamics in modern agricultural settings. We are working on an enhanced real-time monitoring system, utilizing the cutting-edge capabilities of deep learning to solve these difficulties fully. The main goal of our study is to establish a solid framework capable of accurately and consistently tracking Vicia Faba’s various growth phases in real-time.
Given the complexity and dynamic character of current agricultural ecosystems, where variables like fluctuating climatic conditions, soil types, and insect pressures may significantly affect crop development, this endeavor has considerable relevance.
The use of deep learning techniques, an aspect of artificial intelligence that specializes in collecting complicated patterns and information from vast datasets, forms the basis of our strategy. We want to develop a highly adaptive and responsive system that can continuously evaluate and record the growth trajectories of Vicia faba plants with outstanding precision by utilizing the power of deep neural networks. Our suggested approach can quickly adapt to various agricultural contexts, addressing the difficulties of multiple farming methods and environmental factors. It will identify Vicia faba’s developmental stages and essential growth factors, including germination, flowering, and fruiting phases. This multidimensional strategy guarantees that our monitoring system offers thorough insights into the general health and performance of Vicia faba crops, going beyond only growth stage identification. Additionally, our study aims to provide the groundwork for data-driven agricultural decision-making. Our technology provides farmers, agronomists, and researchers with the knowledge to optimize cultivation techniques and resource allocation by generating high-resolution, real-time data on Vicia faba growth. This can result in higher crop yields, better resource utilization, and more environmentally friendly farming methods.
The creation of effective and precise object identification models, including RetinaNet [18], Mask Region-Based Convolutional Neural Network (Mask R-CNN) [8], Faster Region-Based Convolutional Neural Network (Faster R-CNN) [10], and You Only Look Once (YOLO) [15], has been made possible by contemporary deep learning optimization approaches. YOLO is a popular option for real-time object detection since it can maintain a high inference speed while achieving high accuracy. The YOLO model has been enhanced and improved over time, resulting in YOLOv5. YOLOv5 effectively addresses the Vicia faba crop identification issues and real-time growth monitoring. The first difficulty relates to the various Vicia faba crops that growing phases impact. YOLOv5 is proficient in detecting Vicia faba crops under multiple circumstances due to its capacity to manage geometric alterations, deformations, and lighting shifts. The second problem is the requirement for quick and resource-effective video stream processing for real-time growth monitoring. YOLOv5 shines in this area since it is a swift and resource-effective object recognition model well suited for real-time monitoring applications.
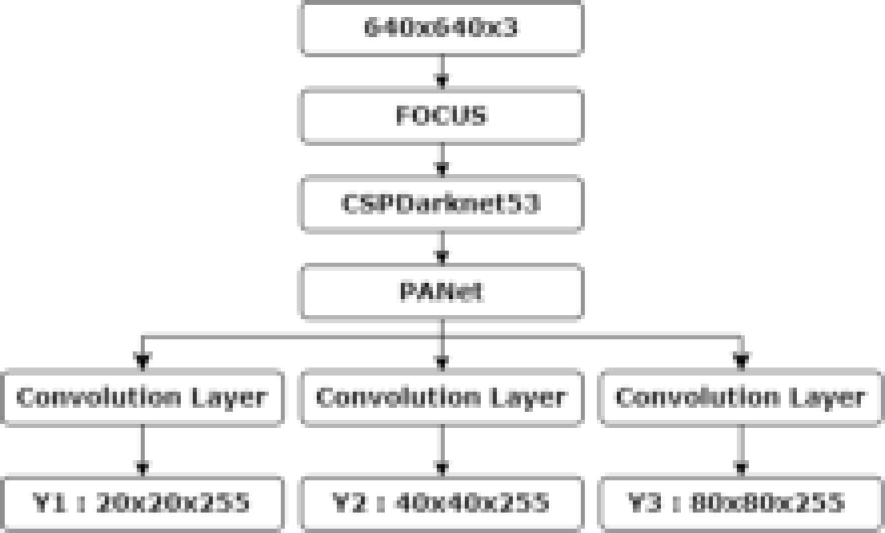
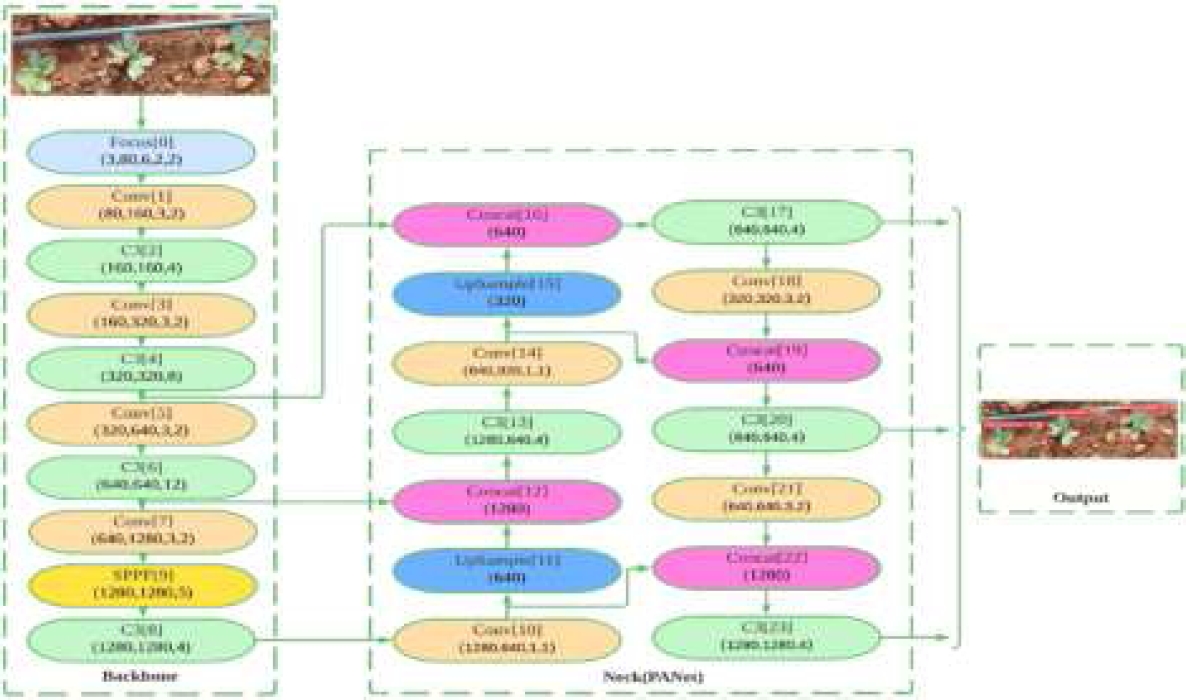
In this work, we conducted the first particular study that integrates computer vision for real-time monitoring of Vicia faba crop growth on a farm in the eastern area of Morocco. To demonstrate fava bean crop development at three different growth periods (germination, flowering, and fruiting), we compared the performances of all YOLOv5 versions. We evaluated the models’ performance on various input picture resolutions to highlight potential tradeoffs between speed and accuracy as a function of model type and image size. The models’ inference abilities were also evaluated and contrasted across various field circumstances, including light and shadow levels, fava bean development phases, and row orientations. Our findings demonstrated a very accurate and efficient monitoring of crop progress. The architectural layout of the YOLO network is shown in Figure 1. Our research used a large dataset of complex aerial images of Vicia faba fields.
2 Related Work
In recent years, there has been much discussion regarding the use of advanced deep-learning models to identify and categorize agricultural items. These deep learning configurations have evolved, with models such as VGG, YOLO, and Faster R-CNN becoming denser. It is interesting to see that these models improve in pinpoint accuracy as they become denser. However, everything is not sunshine and rainbows. The constant trade-off between these models’ accuracy and speed of detection is evident. This section will examine a few recent studies that have added something intriguing to the field of identifying and monitoring crop products. In ref [13], the authors proposed a faster R-CNN model for coconut maturity detection, using a ResNet-50 as the backbone, outperforming SSD and YOLO-V3 in detecting two crucial maturity stages, tested with real-time and Google images.
Li et al. provided a customized CM-CNN corn growth monitoring model that uses unmanned aerial vehicles (UAVs) and computer vision technologies to enhance crop production, breeding, and seed production efforts [9]. With a 99.3% accuracy rate, the model outperforms existing CNN models, including AlexNet, ZFNet, VGG, InceptionV3, Xception, and ResNet in categorizing corn development phases. To recognize and evaluate the growth of Prunus mume (plum) fruit, the authors in [6] created a deep learning-based object detection method utilizing convolutional neural networks (CNNs). They tested the Faster R-CNN, EfficientDet, Retinanet, and SSD object identification models. The results showed that SSD MobileNet was the quickest and EfficientDet was the most accurate model. In ref [20], Zhang et al. presented AI-MDSRS, an algorithm for automating the identification of multiple developmental stages of rice ears. Using an improved Faster R-CNN framework with Inception_ResNet-v2, FPN, RoI alignment, and DIoU-based NMS, the proposed model achieved an impressive average accuracy of 92.47%, outperforming the original Faster R-CNN (40.96%) and YOLOv4. An innovative method for detecting legume seeds for intelligent farming was provided in the paper [12]. The purpose of the research is to identify 11 different varieties of legume seeds, each of which has a distinct color, size, and form. The construction of the model is based on a rigorously gathered dataset of 828 images taken in a range of settings. The YOLOv4 model outperformed the Faster R-CNN model in real-time detection when the two models were compared using TensorFlow, attaining a stunning average accuracy of 98.52%. Kumar et al. proposed a novel space-layer modified CNN architecture (GL-CNN) in conjunction with IoT and drone technologies to monitor palm and seedlings [7]. The GL-CNN model, which uses specified convolutional layers and a deviation layer for result classification, is trained to predict whether seedling development will succeed or fail. A real-time dataset was used for evaluation, and the results showed an outstanding average accuracy of 95.96%, exceeding current CNN designs and demonstrating its potential for tracking and forecasting palm seedling growth. Dhal et al. developed a deep-learning model to predict the day of harvest for hydroponically grown soybeans [3]. The model uses feature extraction to determine the growth stage from annotated images. Photos were labeled using the Computer Vision Annotation Tool (CVAT), and a five-layer convolutional neural network (CNN) was trained to predict the range of growing days. The pre-trained model was integrated into a Flask backend with a graphical user interface (GUI) for real-time application, enabling users to estimate crop day from input images.
This study concentrates on developing an advanced real-time system tailored explicitly for monitoring Vicia faba L. growth. This targeted approach represents a marked departure from broader investigations and positions our research as a pioneering effort in precision agriculture. The distinctive value of our methodology lies in its immediate applicability, offering real-time insights into Vicia faba crop growth and development. Unlike prior studies that may provide general insights, our system equips farmers with precise, up-to-the-minute information. This empowers them to make informed decisions promptly, optimizing their management practices and directly influencing crop yields. Our contribution extends beyond theoretical advancements—it directly addresses practical challenges faced by farmers. By enhancing decision-making processes through real-time data, our research stands at the forefront of efforts to improve agricultural productivity. The tangible benefits extend to the resilience and sustainability of food production systems, showcasing a clear departure from abstract findings to actionable outcomes.
3 Materials and Methods
3.1 Experimental Site
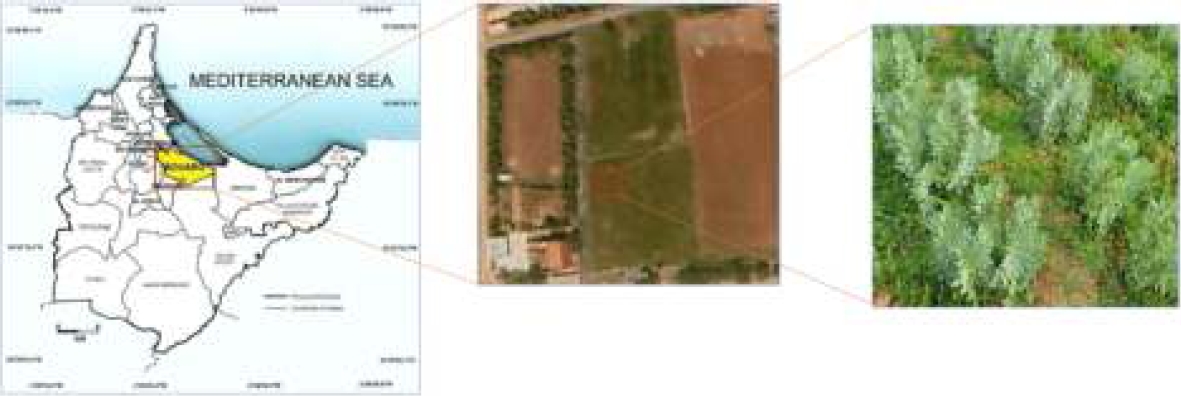
The experimental site was located at coordinates 35°04’24.9"N 2°48’58.8"W and was the site of research from mid-January to early April 2023 at an agricultural farm in the commune of Bouarg, Nador province, Oriental region of Morocco (Figure 2). With an average temperature of 18.2°C, this location had 456mm of yearly rainfall. The crop under research was the fava bean, and 63 plots were chosen randomly for the study.
3.2 Dataset Acquisition and Management
An unmanned aerial vehicle (UAV) with a 4/3 CMOS Hasselblad camera was employed to capture high-resolution RGB aerial photographs of the Vicia Faba collection on the farm. The aerial photography sessions were conducted between January and April 2023, covering the entire topography of the farm. The photographs were taken at altitudes ranging from 1.5 to 2 meters. Various lighting conditions were utilized during the image acquisition process to document the farm’s evolving landscape as Vicia Faba underwent its multiple developmental stages. The dataset also encompasses various developmental phases, comprehensively representing real-world conditions. With 2530 high-quality photos, this dataset ensures that future research will benefit from ample information and clarity in its results.
3.3 Image Annotation
In the training process of deep learning models like YOLOv5, image annotation plays a crucial and essential role. The caliber and precision of these annotations significantly influence the effectiveness and general correctness of the resulting model. To rigorously annotate a large dataset about the growth stages of Vicia faba crops, we used the Python-based graphical annotation tool "LabelImg" in the context of our research project. To minimize the presence of unnecessary background pixels inside the boundaries of these boxes, this method required the careful definition of bounding boxes enclosing regions of interest.
Additionally, object classes were carefully assigned as brief rectangular boxes. The meticulous effort put into creating accurate and detailed annotations symbolizes our dedication to improving the effectiveness and resilience of the YOLOv5 model, especially in its capacity to navigate various real-world scenarios and conditions. This meticulous annotation procedure is the cornerstone of our scientific investigation since it complies with the highest standards of research methodology and provides priceless information for improving the model’s performance.
The representation of instances for each class is shown in Figure 3. Notably, the "Germination" class displays more instances than the others. A closer look at the graph reveals a relatively evenly distributed distribution of occurrences among the other classes. This evenly distributed data shows that it is possible to train the model on a balanced dataset for accurate item detection in the photos. It’s crucial to remember that these numbers do not always represent how well or accurately each class detects objects. Various variables influence the model’s performance, such as the accuracy of the annotations and the sizes and complexity levels of the objects in the photos. Therefore, a thorough analysis of these components is necessary for a more complete evaluation of the model’s capabilities.
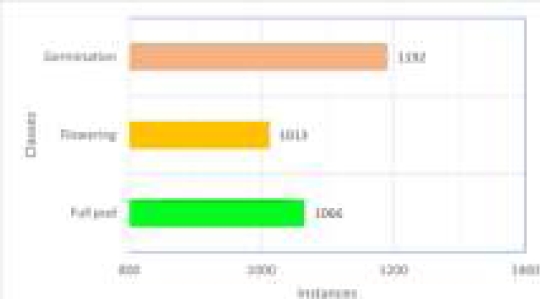
Fig. 3 The distribution of instances per class is 1192 instances for plant germination, 1013 instances for flowers, and 1066 instances for pod labels
Each image in the database features bounding boxes that may be used to identify the various plant parts. The database has 2530 photos of the Vicia faba crop at various stages of growth. Then, using this information as training data, our model algorithm can recognize these locations in new images and determine the Vicia faba crop’s growth stage. The accuracy of our model is strongly influenced by the quality of labeling, which must be carried out with considerable caution and monitoring.
3.4 Configuration of Experimental Parameters and Environment
3.4.1 Framework Selection: YOLOv5 for Object Detection
In agriculture, the YOLO algorithm networks have several uses for item detection. The YOLOv5 model, which has been extensively adopted and is recognized for its object-detecting skills, is introduced in the eighth entry of the YOLO series. This approach has improved the agricultural industry’s capacity to precisely identify distinct Vicia faba growth phases. Five network designs are included in the YOLOv5 framework: YOLOv5n, YOLOv5s, YOLOv5m, YOLOv5l, and YOLOv5x. Among them, YOLOv5x distinguishes itself because of its exceptional accuracy and speed combination. The foundational network for this study, YOLOv5x, furthers the field’s ability for object detection in Vicia faba growth phases since it has the most extensive network structure and the best accuracy, even though it performs somewhat slower than the other versions.
Even with a more extensive network, inference time is decreased by YOLOV5’s Cross Stage Partial (CSP) backbone. The CSP aims to minimize the number of network parameters by solving the fading gradient issue, enhancing feature propagation, and reusing extracted features [19]. The Feature Pyramid Network (FPN) may help resolve the minor object detection issue. A pyramid of feature maps including geographical and semantic data is used to try and address the issue [2].
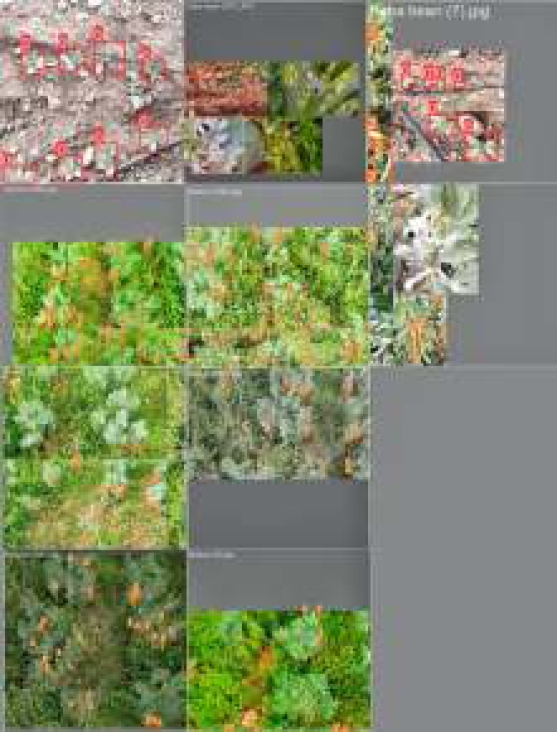
In the same way, YOLOV5 makes use of the FPN-like path aggregation network (PANet). PANet features an ascending and descending path in addition to the FPN’s two ascending and descending tracks. Adding more training data, such as scaling, color space modifications, and mosaic augmentation, is another significant new feature of YOLOV5. The YOLOV5 implementation uses Pytorch’s data loaders to augment samples at random while training and does not preserve the enhanced samples. In Table 1, the network parameters are presented. One example batch of data is shown in Figure 4 during the training period. The batch has 10 combined images made up of 4 separate photos. Figure 5 depicts the YOLOV5x architecture in detail. The Concatenation and Convolution modules in the first row of blocks show the PANet structure. The fundamental CSP structure comprises the Convolutional, Spatial Pyramid Pooling (SPP), and C3 blocks. The convolution process, batch normalization, and activation function are all contained in the YOLOV5 Convolutional blocks. SPP concatenates the pooling layers of various widths while processing the input features in parallel. The C3 blocks consist of three convolution procedures combined.
Table 1 YOLOv5 Parameters trained
| From | n | Params | Module | Arg | |
| 0 | -1 | 1 | 8800 | Conv | [3,80,6,2,2] |
| 1 | -1 | 1 | 115520 | Conv | [80,160,3,2] |
| 2 | -1 | 4 | 309120 | C3 | [160,160,4] |
| 3 | -1 | 1 | 461440 | Conv | [160,320,3,2] |
| 4 | -1 | 8 | 2259200 | C3 | [320,320,8] |
| 5 | -1 | 1 | 1844480 | Conv | [320,640,3,2] |
| 6 | -1 | 12 | 13125120 | C3 | [640,640,12] |
| 7 | -1 | 1 | 7375360 | Conv | [640,1280,3,2] |
| 8 | -1 | 4 | 19676160 | C3 | [1280,1280,4] |
| 9 | -1 | 1 | 4099840 | SPPF | [1280,1280,5] |
| 10 | -1 | 1 | 820480 | Conv | [1280,640,1,1] |
| 11 | -1 | 1 | 0 | Upsample | |
| 12 | [-1, 6] | 1 | 0 | Concat | [1] |
| 13 | -1 | 4 | 5332480 | C3 | [1280,640,4] |
| 14 | -1 | 1 | 205440 | Conv | [640,320,1,1] |
| 15 | -1 | 1 | 0 | Upsample | |
| 16 | [-1, 4] | 1 | 0 | Concat | [1] |
| 17 | -1 | 4 | 1335040 | C3 | [640,640,4] |
| 18 | -1 | 1 | 922240 | Conv | [320,320,3,2] |
| 19 | [-1, 14] | 1 | 0 | Concat | [1] |
| 20 | -1 | 4 | 4922880 | C3 | [640,640,4] |
| 21 | -1 | 1 | 3687680 | Conv | [640,640,3,2] |
| 22 | [-1, 10] | 1 | 0 | Concat | [1] |
| 23 | -1 | 4 | 19676160 | C3 | [1280,1280,4] |
| 24 | [17,20,23] | 1 | 53832 | Yolo.Detect |
3.4.2 Experiment Platform
An AMD 3700x CPU, 16 GB of RAM, and a powerful GeForce GTX 2070 Super GPU were used in the experimental setup on a Windows 10 operating system computer. A carefully chosen software stack, Torch 1.13.1 as the main framework, Cuda 11.6 for GPU acceleration, and Python 3.9.16 for scripting and data processing, was used to facilitate the deep learning tasks. Notably, pre-training weight data kindly given by the framework’s developers were generously integrated into the training process to provide the models a solid beginning basis, highlighting the thorough and well-studied quality of the experimental setup.
3.4.3 Experiment Parameter
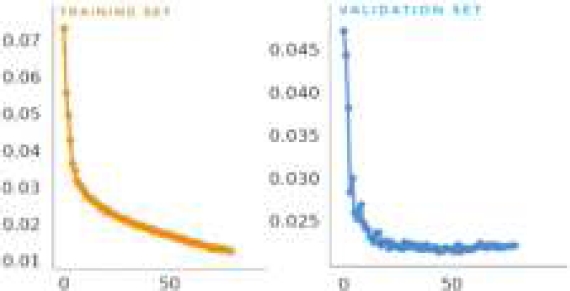
The pre-trained model was the starting point for training the numerous YOLO models, including YOLOv5n, YOLOv5s, YOLOv5m, YOLOv5l, and YOLOv5x. After the training, the resultant model was saved, and a brand-new set of test data was used for a rigorous manual examination. This assessment compares the iterative hyperparameter tweaking procedure results with those obtained using the platform’s default hyperparameters. The optimal hyperparameter values for the top-performing model in this study were obtained as a result of this analysis and are shown in Table 2. The verification metrics figure out the performance of the training procedure. Accuracy validation was executed following the training procedure, as illustrated in Figure 6.
Table 2 Hyperparameter settings
| Hyperparameter | Value | Hyperparameter | Value |
| Epochs | 80 | lr0 | 0.01 |
| Batch Size | 10 | lrf | 0.01 |
| momentum | 0.93 | anchors | - |
| weight_decay | 0.00057 | iou_t | 0.2 |
| warmup_epochs | 3.0 | anchor_t | 4.0 |
| warmup_momentum | 0.795 | box | 0.05 |
| warmup_lr | 0.1 | translate | 0.1 |
| mosaic | 1.0 | scale | 0.5 |
| cls | 0.5 | fliplr | 0.5 |
| cls_pw | 1.0 | hsv_h | 0.0034 |
3.4.4 Comprehensive Assessment of Model Performance
The model’s performance was thoroughly assessed using a variety of measures, each of which has a specific function. Precision is the percentage of accurately anticipated positive tests among all predicted positives, as determined by the equation (1).
The model’s capabilities and effectiveness were meticulously evaluated using a variety of performance metrics, including recall, F1 score, average precision (AP), and mean average precision (mAP) at both the 0.5 and 0.5-0.95 intersection over union (IoU) thresholds and processing speed measured in frames per second (FPS). Thorough model performance evaluation includes metrics that are combined across all classes. A crucial indicator, especially when there are three separate categories (N=3), is the mean Average Precision (mAP). In further detail, mAP computed at the intersection-over-union (IoU) criterion of 0.5 is called "mAP@0.5." "mAP@0.5:0.95" is the average mAP derived over IoU thresholds from 0.5 to 0.95, with a 0.05 increment.
Equations (2,3,4,5), which provide the mathematical formulas for recall, F1 score, Average Precision (AP), and mAP, respectively, offer a reliable framework for evaluating model performance in a variety of contexts:
We meticulously considered a range of evaluation indicators, including accuracy, mean Average Precision (mAP), average accuracy for single-class objects, computational efficiency, the Precision-Recall curve, model detection speed, and network weight properties.
4 Results and Discussion
4.1 Detecting Vicia Faba Growth Stages
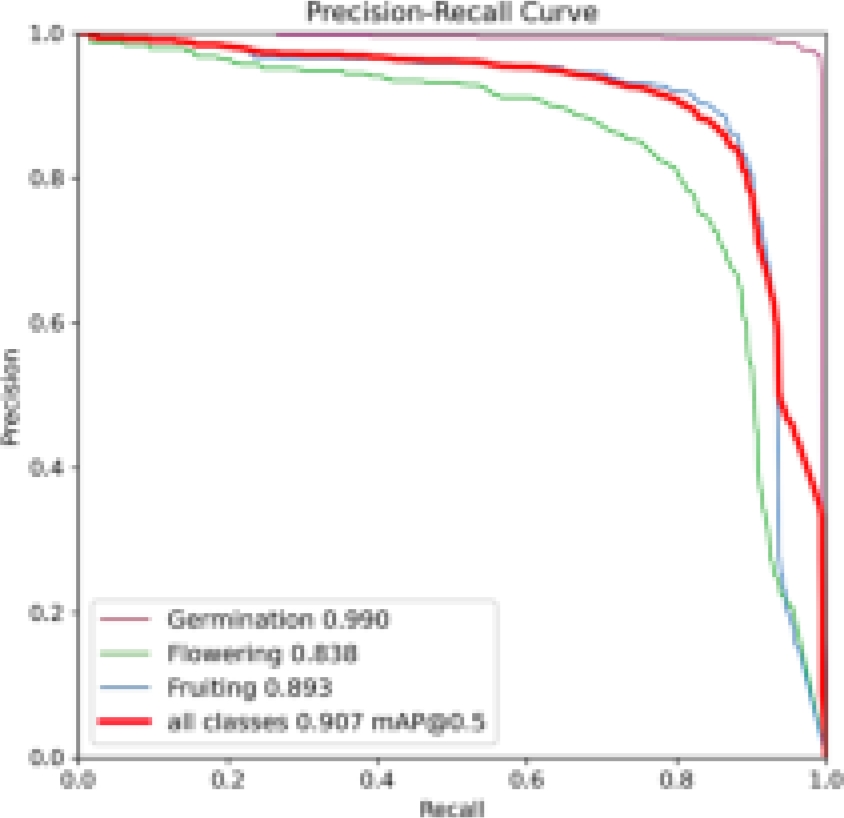
When using the transfer learning approach during the training phase, the dataset in our study demonstrated successful convergence after 80 training epochs. YOLOv5 weights already trained were used to start the training process. Mean Average Precision (mAP), precision, recall, and F1 score attained outstanding percentages, with the highest recorded values reaching 90.7%, 91.6%, 87.8%, and 89.6%, respectively. Furthermore, we achieved exceptional classification precision throughout several development stages. Specifically, 96.5% of plants in the germination phase, 88.8% of flowers, and 89.6% of fruiting (full pod) were accurately classified, with only 3.5%, 12.2%, and 11.4% misclassified as the background class, respectively. It is important to note that earlier studies have identified potential biases in classifier performance favoring classes with a majority. As a result, we examined performance using the Precision-Recall Curve, as shown in Figure 7.
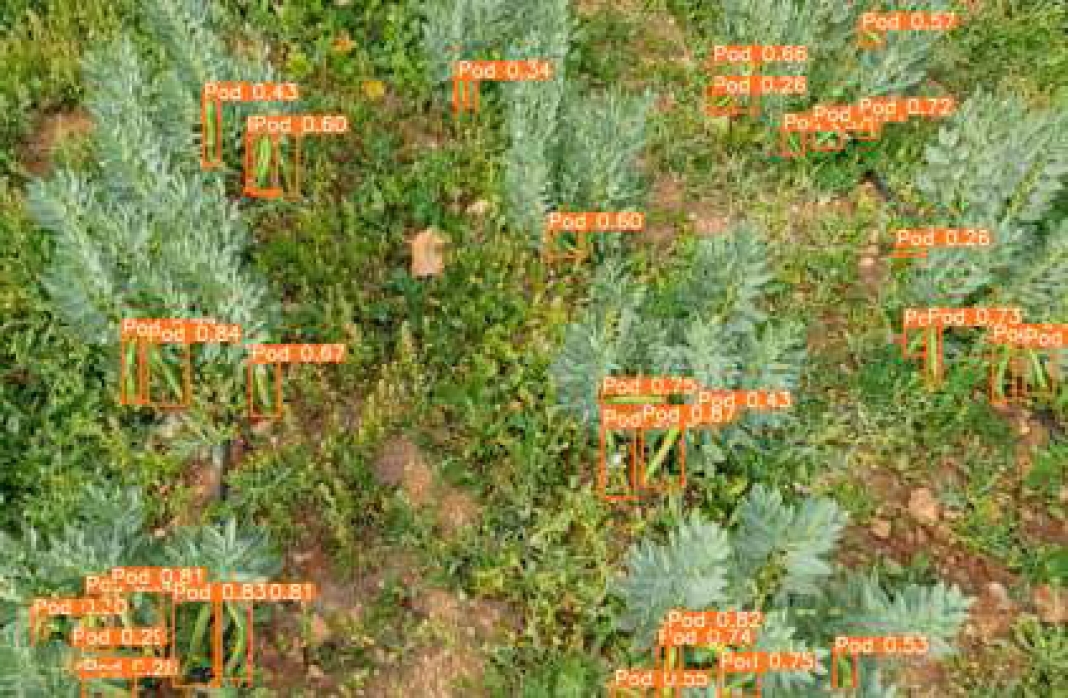
See Figure 8 for the conclusion of our Vicia faba development phase detection, when the fruiting, the last phase, reveals its secrets. The identified pods are artfully encased within orange bounding boxes in this visual reveal, each with a unique confidence score. It provides a visual demonstration of the accuracy and effectiveness of our detecting technology and provides a look into its precision and refinement.
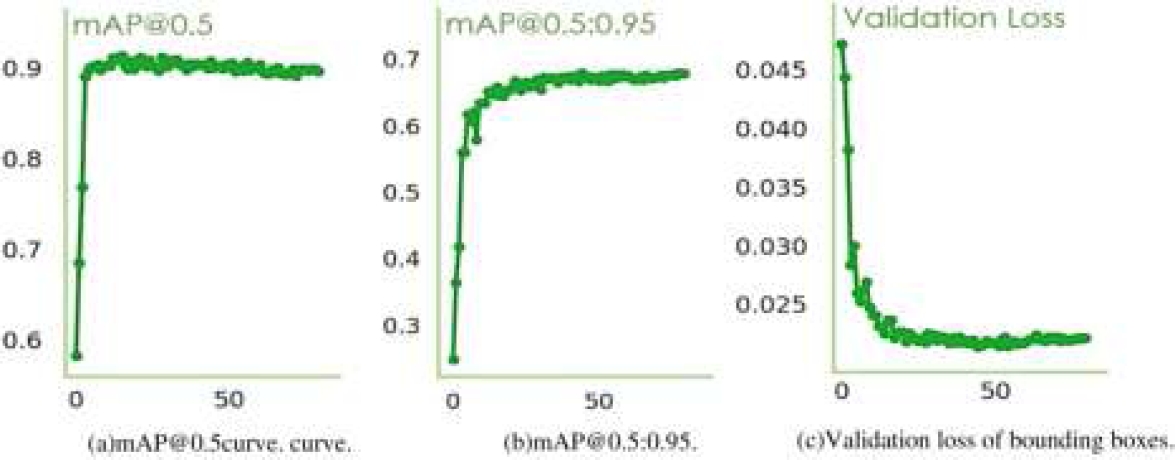
4.2 The Optimal Model: Top-Performing Trained Model
Our experiment encompassed a range of YOLOv5 architectural variants through the transfer learning method. We fine-tuned these models with a batch size of 10 and set images at a standardized size 640. The YOLOv5x version demonstrated exceptional performance among the tested models, achieving a 90.7% mAP@0.5 and a 68% mAP@0.5:0.95. Figure 9 graphically represents the progression of bounding box coordinates and the associated loss in prediction validation concerning mAP@0.5 and mAP@0.5:0.95 across training epochs. This visual depiction offers insights into the learning process of our model. For a comprehensive overview of model performance, Table 3 presents the parameter values, recall, mAP@0.5, mAP@0.5-0.95, and precision during the test phase for Vicia faba growth stage identification. Notably, the YOLOv5s version exhibited the lowest precision scores. In contrast, the other three YOLOv5 variants demonstrated better precision. YOLOv5x achieved the highest precision score at 91.6%, closely followed by YOLOv5m, YOLOv5l, and YOLOv5s, with scores of 89.9%, 88.8%, and 88.2%, respectively. Regarding recall, YOLOv5m emerged as the top performer with an 88.2% valid positive rate, while YOLOv5s had the lowest recall rate. This analysis sheds light on the distinct performance characteristics of these models in the context of our study.
The F-measure, an essential measure for evaluating classifier performance, represents the balanced harmonic mean of precision and recall and is encapsulated in the F1 score. It is an essential indicator of a classifier’s effectiveness in capturing relevant instances while minimizing false positives. In our analysis, in Figure 10, we have displayed the F1 curves for different variants of YOLOv5 that have been trained, Figure 10(d) highlights a graph with a confidence value set at 0.454. This specific confidence value was meticulously selected to achieve a delicate balance, resulting in an impressive F1 score of 0.896. This carefully chosen threshold reflects the optimal compromise between sensitivity and accuracy, a crucial consideration in many classification tasks. In practical terms, higher F1 scores and confidence values are preferred as they indicate a classifier’s ability to achieve high precision and complete recall, reducing false positives and false negatives and improving overall model robustness and reliability. These results offer valuable insights into the classifier’s capabilities and can significantly influence decision-making processes in various applications.
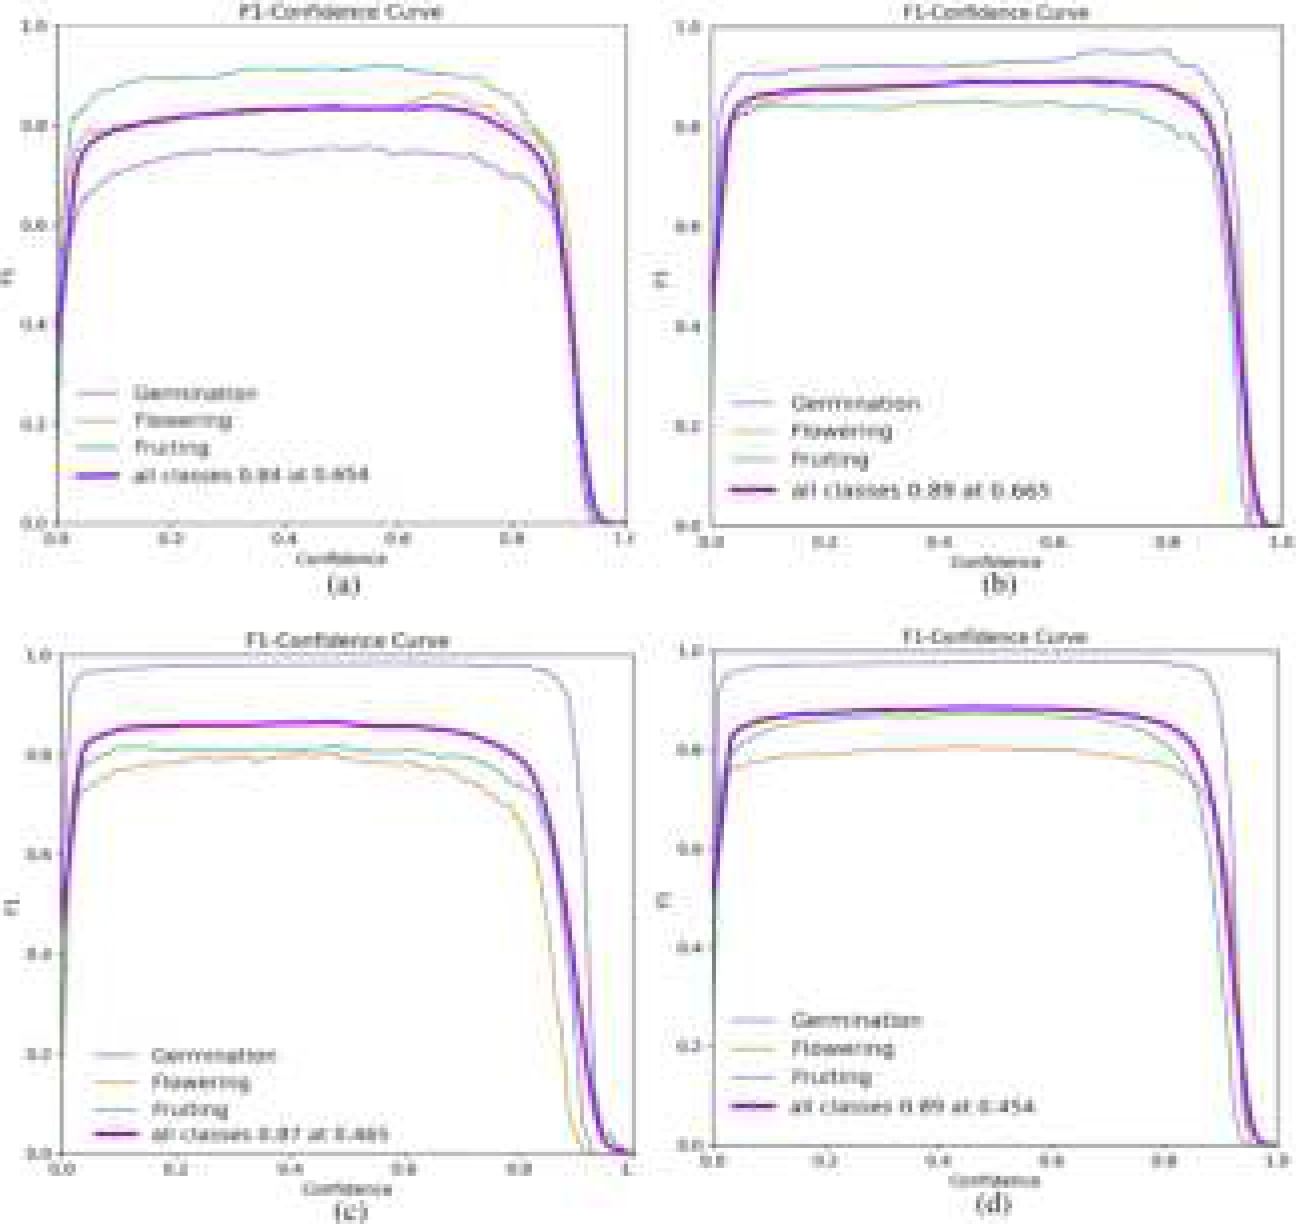
Fig. 10 Performance evaluation of models trained using F1-score: (a)YOLOv5s, (b)YOLOv5m, (c)YOLOv5l, (d)YOLOv5x
In our investigation, YOLOv5x demonstrated strong performance across all three growth stages of Vicia faba, excelling in most test images and videos. The best-trained model exhibited an impressive ability to detect even small, distant objects while effectively filtering out unwanted elements such as branches and herbs. Notably, it could also discern objects in complex, cluttered backgrounds. These encouraging outcomes are clearly illustrated in Figure 11. When assessing the performance of our trained models, we find that, in cases like these, traditional metrics such as the area under the precision-recall curve and mean Average Precision prove to be more informative. To ensure a fair comparison and mitigate the impact of class instance imbalances, we rely on mAP values. Our analysis reveals that the highest detection accuracy was achieved during the "germinating" growth stage, followed by "fruiting" and "flowering," as illustrated in Fig. 6. This hierarchy of detection accuracy aligns with our expectations. The "germinating" stage images presented fewer challenges, lacking the substantial grass cover often found in the "flowering" stage. As a result, we applied pre-processing techniques specifically to the "germinating" stage images to enhance localization accuracy. Conversely, the "flowering" stage images posed a more significant challenge due to the prominence of weeds, resulting in a comparatively lower detection accuracy.
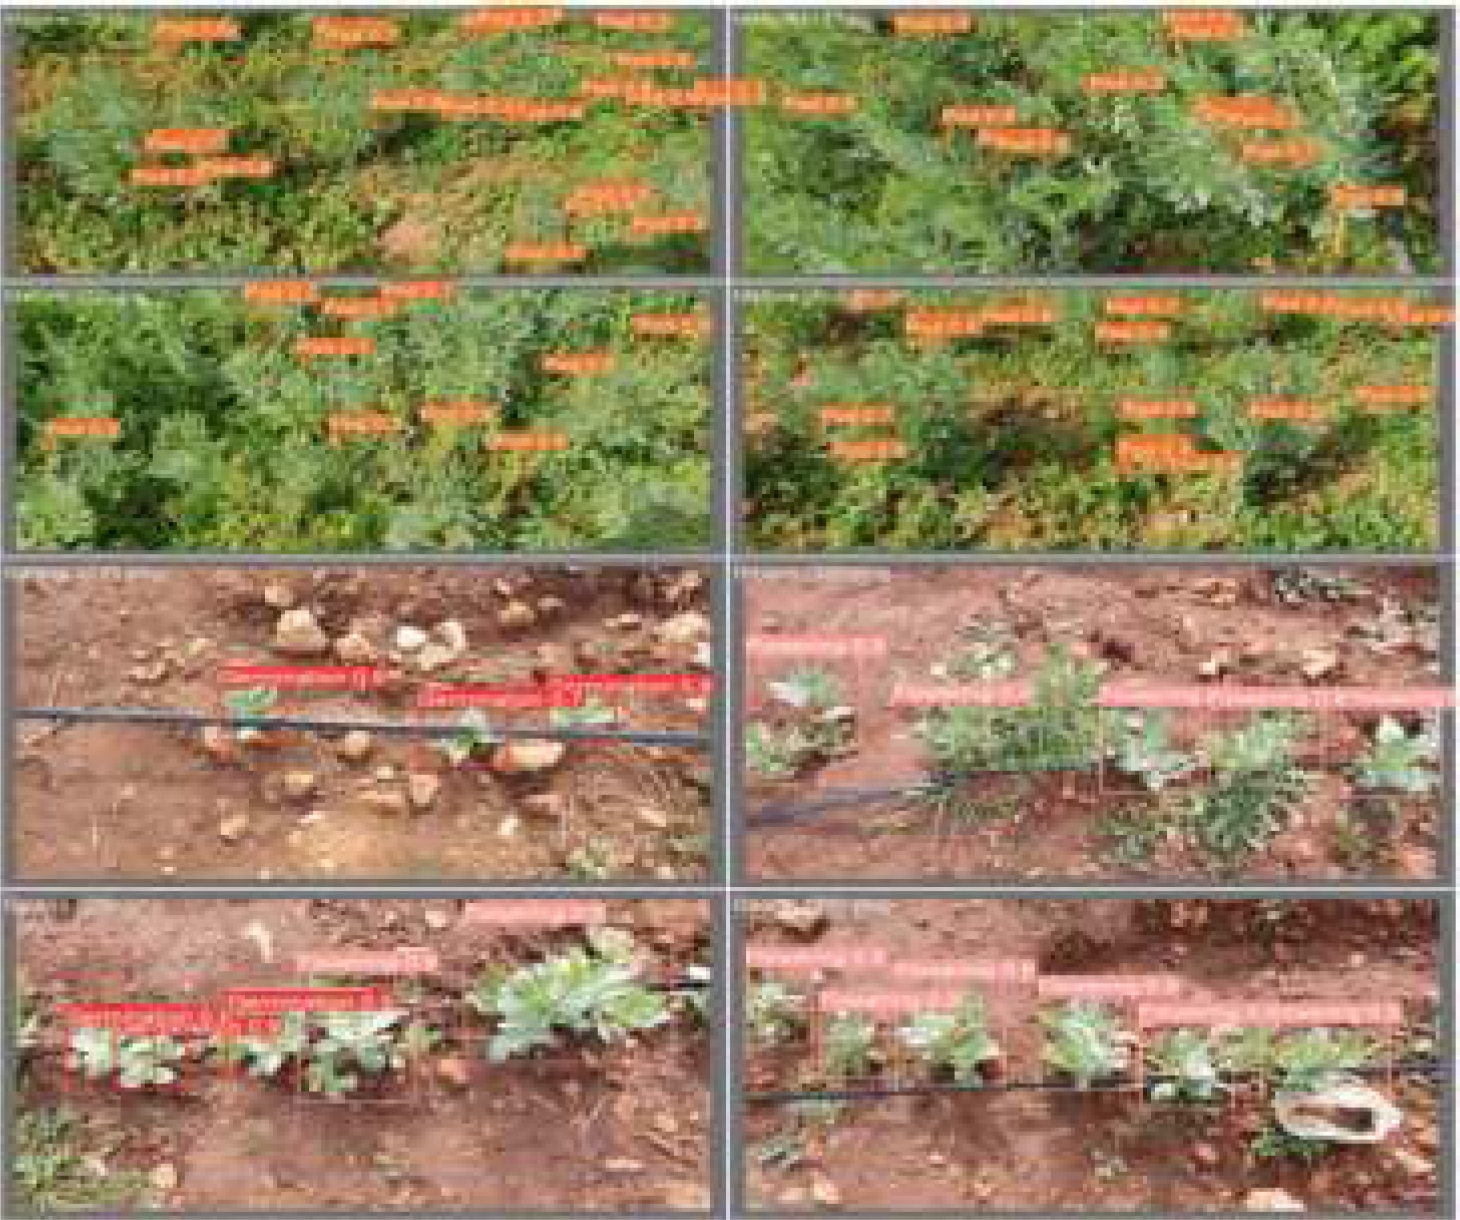
Fig. 11 Results of testing yolov5x model performance across various times of day and growth stages in Vicia faba
This discussion underscores the dynamic inter-play between growth stages, image complexity, and the efficacy of our detection model. The findings presented in this article pave the way for real-time vegetation detection in various crops using the YOLOv5x framework. This advancement holds significant promise for more precise crop management and enhanced utilization of agricultural resources, offering potential benefits to agriculture and environmental monitoring.
5 Conclusion and Future Work
In this groundbreaking research, we delve into the dynamic realm of real-time detection and classification of growth stages in Vicia faba crops, unravelling the intricacies within their natural habitat. Our study introduces a cutting-edge lightweight framework for object detection in complex agricultural settings. A comprehensive evaluation of four YOLOv5 variant models underscores the superiority of YOLOv5x, boasting an exceptional performance pinnacle with a mean Average Precision (mAP) soaring to an impressive 90.7% and a precision of 91.6%. This accomplishment spans diverse datasets, meticulously curated to represent the multifaceted tapestry of bean crop growth stages. The datasets, meticulously captured using uncrewed aerial vehicles (UAVs), testify to the model’s prowess in navigating and excelling in challenging environmental conditions. Our findings underscore the potential of YOLOv5x and herald a new era in precision agriculture, where cutting-edge technology seamlessly aligns with the intricacies of natural ecosystems. Looking ahead, our research trajectory includes fortifying the dataset by incorporating images captured under varying conditions, ensuring a more comprehensive representation of Vicia faba crop growth phases. Furthermore, we embark on the optimization journey, planning to refine the network model through the strategic pruning of the YOLOv5x architecture. This ambitious pursuit aims to elevate detection accuracy and recall rates, propelling our framework to new heights of efficiency and reliability. As we navigate the frontiers of technological innovation, this study lays the foundation for a future where the marriage of advanced frameworks and agricultural insights propels us toward sustainable and resilient food production systems.

