


 nueva página del texto (beta)
 Inglés (pdf)
 Artículo en XML
 Referencias del artículo
 Enviar artículo por email
 Citado por SciELO
  Similares en
SciELO
Similares en
SciELO 
 Permalink
1 Introduction
Freight transport currently faces several challenges that compromise its efficiency and sustainability. Among the most critical are deficiencies in decision-making processes, congestion on strategic routes, and the insufficient adoption of advanced technologies for information management and analysis. These factors not only impact the sector's operational efficiency but also limit its ability to adapt to an increasingly dynamic and competitive logistics environment.
Zerbino et al. [1] utilized Process Mining to enhance transport efficiency at a European port, identifying inefficiencies and proposing solutions to optimize information flow and reduce operational costs. Similarly, Escalante et al. [2] proposed a Business Intelligence (BI) solution with agile methodological practices to optimize decision-making in Internet banking, reducing time, personnel, and costs. Likewise, Escalante, Gamboa, and Asto [3] developed a new BI methodology to optimize decision-making in online banking, reducing time, resources, and costs in obtaining critical information.
Awan et al. [4] also demonstrated that Big Data Analytics (BDA) and Business Intelligence and Analytics (BI&A) enhance decision-making quality in Czech manufacturing companies, supporting the circular economy. Additionally, Ain et al. [5] reviewed various studies on the adoption, utilization, and success of BI systems, identifying challenges and underexplored areas while suggesting future directions to maximize the value of these systems.
Božič, K. and Dimovski, V. [6] examined how the use of Business Intelligence and Analytics (BI&A) influences innovation ambidexterity and firm performance. Their findings indicate that BI&A helps balance exploratory and exploitative innovations, thereby enhancing business performance. Similarly, Niu et al. [7] proposed the ODM-BDA framework to improve data management and decision-making using Big Data Analytics. They also introduced methods to enhance planning and risk-taking capacity, demonstrating their effectiveness through simulation analysis. In the banking sector, Bany et al. [8] investigated factors affecting the use of Business Intelligence and Analytics (BIA), emphasizing the importance of technological infrastructure, management support, and human resources, while recommending that planning should extend beyond technology. Similarly, Caseiro and Coelho [9] proposed a model that examines how Business Intelligence (BI) directly influences performance and indirectly impacts network learning (NL) and innovation (INNOV) in European startups. Moreover, Ahmad et al. [10] evaluated how Business Intelligence Systems (BIS) help address sustainability challenges in the textile and fashion industry within the Industry 4.0 revolution, revealing their crucial role in adopting advanced technologies.
Richards et al. [11] showed that the effective implementation of Business Intelligence (BI) enhances planning and analysis practices in corporate performance management, highlighting the relationship between BI and Business Analytics (BA). Likewise, Basile et al. [12] demonstrated that a decision support system based on BI significantly improves cost estimation and decision-making in oncology patient care. Combita, H., Combita, J., and Morales [13] presented a Business Intelligence Governance Framework for Universidad de la Costa, strengthening organizational culture, data management, and analysis, thereby ensuring the success of BI projects.
Cempírek et al. [14] addressed intermodal cargo control using BI in a maritime transport company, including BI fundamentals, guidelines for creating software applications, and practical applications in controlling dedicated train cargo and other types of intermodal transport.
Escalante Viteri et al. [3] implemented a BI solution in an Internet banking financial unit to optimize decision-making. The methodology used reduced response times, minimized personnel usage, and decreased operational costs. This study demonstrates the impact of BI on the efficiency of strategic processes, serving as a reference for its application in sectors such as freight transport.
Despite the advancements of BI in sectors like manufacturing and banking, its application in road freight transport in Peru remains limited. Although previous studies have demonstrated its impact on decision-making and operational optimization, evidence is still lacking regarding its use to mitigate congestion on strategic routes and improve logistical planning in this context.
The absence of research tailored to the Peruvian reality restricts the development of data-driven strategies to enhance the efficiency and competitiveness of the sector.
This research is crucial due to the growing complexity and competitiveness of the logistics sector. In an environment where freight transport is constantly expanding, companies face critical challenges in operational efficiency and cost management. Business Intelligence (BI) provides advanced tools for analyzing large volumes of data, improving real-time visibility, and optimizing routes and freight processes. This case study will evaluate the impact of BI on logistics management, demonstrating its potential to reduce operational costs and increase the competitiveness of freight companies.
Additionally, it will encourage the development of data-driven strategies tailored to the specificities of the Peruvian market, driving innovation and efficiency in a key sector for the national economy.
This study aims to analyze how BI implementation can optimize freight transport in Peruvian companies, enhancing operational efficiency, increasing customer satisfaction, and optimizing route planning. It also seeks to identify the most effective BI tools and techniques to address the sector's specific challenges, providing practical recommendations to improve logistics management and strengthen market competitiveness.
This paper is organized as follows: Section 2 presents a description of BI, establishing its foundations and relevance in the study's context. Section 3 details the architecture of the proposed solution, including the methodology used for data collection and indicator analysis. Section 4 presents the case study, which utilizes the collected data for BI solution implementation. Section 5 discusses the results obtained from the established indicators, comparing them with findings from previous studies. Finally, Section 6 presents the study's conclusions and suggests potential directions for future research.
2 Theoretical Background
2.1 Business Intelligence
Božič and Dimovski [6] state that Business Intelligence (BI) systems have evolved as platforms for managing large volumes of structured data, typically organized in data warehouses, enabling advanced functionalities such as reporting, real-time analysis, ad hoc queries, and visualization through dashboards.
Similarly, Ahmad et al. [10] highlight that Business Intelligence Systems (BIS) integrate various tools and techniques designed to provide historical information, facilitating analysis, querying, and report generation. These capabilities support strategic decision-making and enhance business process efficiency, ultimately optimizing organizational management.
2.2 Freight Transport
Ventocilla, Torres, and Salas [15] point out that in an increasingly globalized environment, the international freight transport industry plays a crucial role by generating business opportunities and significantly contributing to national economies.
Similarly, López, and Pardo [16] emphasize that road freight transport is an essential component of international trade, as it facilitates the exchange of goods between countries. Its role is vital within global logistics, supporting the efficiency of commercial transactions and establishing itself as a key factor in the economic growth of nations.
3 Research Method
This section describes the methodology used in the study, detailing the research approach adopted, the procedures employed for data collection and analysis, as well as the criteria applied to ensure the accuracy and reliability of the results.
Additionally, the selection of the method used is justified based on the study's objectives, ensuring scientific rigor throughout the research process.
3.1 Hefesto Methodology
The Hefesto methodology is based on a detailed comparative analysis of existing methodologies, complemented by rigorous study and the incorporation of the author's expectations in the context of data warehouse development.
This methodology establishes a structured approach for the integration, storage, and efficient processing of information (See Figure 1).
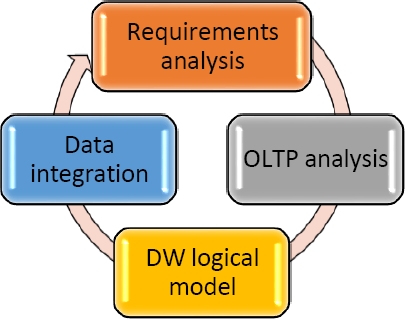
Requirements Analysis: Identifies and documents information needs and business objectives to align the BI system with the organization's strategic goals.
This process ensures that the system's design meets operational demands and facilitates data-driven decision-making.
OLTP Analysis: Examines existing Online Transaction Processing (OLTP) systems to understand the generation, storage, and structuring of operational data, allowing the identification of relevant information sources for subsequent integration into the BI environment.
Logical Data Warehouse Model: Designs the logical structure of the Data Warehouse, defining the organization of data based on its utility for analysis and decision-making. In this phase, dimensions and facts are established, optimizing data arrangement to enhance query efficiency and analytical processes.
Data Integration: Implements the ETL (Extraction, Transformation, and Loading) process, transferring data from OLTP systems and other sources to the Data Warehouse. During this stage, data cleaning, validation, and normalization procedures are applied, ensuring data consistency, integrity, and availability for subsequent analysis.
3.2 Applied Research Methodology
This subsection details the specific methodology applied in the study, justifying its selection and describing how it was adapted to the research context. The key stages of the process are presented, from data collection and analysis to result validation, ensuring scientific rigor. The advantages of this approach are also discussed in terms of accuracy and reliability, as well as its possible limitations, providing a clear framework for interpreting the findings.
3.2.1 Operationalization of the Dependent Variable
Table 1 presents the indicators of the dependent variable, which are fundamental elements for the development and analysis of this research.
Table 1 Operationalization of the Dependent Variable
| Indicator | Index | Unit of Measurement | Unit of Observation |
| Delivery Time | [1-3] | Days | Manual Review |
| On-Time Deliveries | [1-10] | On-Time Deliveries | Manual Review |
| Percentage of Poor Decision-Making | [15-50] | (%) | Manual Review |
| Percentage of Complaints | [15-50] | (%) | Manual Review |
3.2.2 Research Design
Initial data (O1) is collected from an experimental group (Ge), randomly selected (R), characterized by its participation in activities related to decision-making in freight transport, where Business Intelligence (X) is implemented. Simultaneously, data (O2) is obtained from a control group (Gc) where the same variable is not introduced, allowing a rigorous comparison to evaluate the impact of the intervention:
3.2.3 Population and Sample
The study population includes all decision-making processes in freight transport companies of minerals in Peru, with an undetermined population size (N). The sample consisted of 30 decision-making processes in a freight transport company, establishing a representative approach for analyzing the implementation of Business Intelligence (BI) in logistics optimization.
3.2.4 Data Collection Procedure
In this study, the observation sheet was used as the primary data collection tool, supplemented by direct and indirect observation techniques.
3.2.5 Hypothesis Statement
The following hypotheses were formulated to evaluate the impact of BI implementation on decision-making optimization in freight transport:
H1: The use of Business Intelligence, based on Hefesto, reduces Delivery Time.
H2: The use of Business Intelligence, based on Hefesto, increases the Number of On-Time Deliveries.
H3: The use of Business Intelligence, based on Hefesto, decreases the Percentage of Poor Decision-Making.
H4: The use of Business Intelligence, based on Hefesto, reduces the Percentage of Complaints.
To test these hypotheses, a specific solution was designed to evaluate each indicator, ensuring precise and data-driven analysis to validate its impact on decision-making in freight transport:
µ1 = Population Mean (H1, H3, H4) for Post-Test of the Control Group (Gc),
µ2 = Population Mean (H1, H3, H4) for Post-Test of the Experimental Group (Ge),
where:
A normality test was applied to verify data distribution, followed by a descriptive statistical analysis to characterize the study variables (see Tables 5 and 6). Subsequently, hypotheses were validated using the Student's t-test, conducted with the specialized software Minitab, ensuring rigor in the interpretation of the results.
Table 2 Post-Test Results of Gc and Ge for I1 and I2
| I1: Delivery Time (days) | I2: On-Time Deliveries | |||
| N° | Post-Test Gc | Post-Test Ge | Post-Test Gc | Post-Test Ge |
| 1 | 2.1 | 1.8 | 4 | 5 |
| 2 | 2.6 | 2.1 | 6 | 7 |
| 3 | 2.2 | 1.9 | 5 | 6 |
| 4 | 2.3 | 1.8 | 7 | 9 |
| 5 | 2.5 | 2.1 | 4 | 5 |
| 6 | 1.8 | 1.6 | 4 | 5 |
| 7 | 2.1 | 1.8 | 2 | 3 |
| 8 | 2.2 | 1.7 | 4 | 5 |
| 9 | 3 | 2.4 | 5 | 6 |
| 10 | 2.5 | 2.1 | 3 | 4 |
| 11 | 2.4 | 1.9 | 7 | 8 |
| 12 | 2.1 | 1.7 | 2 | 3 |
| 13 | 2.3 | 1.7 | 8 | 9 |
| 14 | 2.5 | 1.8 | 7 | 8 |
| 15 | 2.4 | 1.9 | 5 | 6 |
| 16 | 2.5 | 1.9 | 3 | 4 |
| 17 | 2.2 | 1.7 | 7 | 8 |
| 18 | 2.5 | 2 | 3 | 4 |
| 19 | 2 | 1.8 | 9 | 10 |
| 20 | 2.7 | 2 | 4 | 5 |
| 21 | 2 | 1.7 | 5 | 6 |
| 22 | 2.2 | 1.6 | 5 | 6 |
| 23 | 2.5 | 1.9 | 6 | 7 |
| 24 | 2.8 | 2 | 4 | 5 |
| 25 | 2.5 | 1.8 | 2 | 3 |
| 26 | 2.6 | 2 | 6 | 7 |
| 27 | 2.5 | 1.9 | 7 | 9 |
| 28 | 2.1 | 1.7 | 5 | 7 |
| 29 | 1.8 | 1.5 | 4 | 5 |
| 30 | 2.7 | 2.1 | 5 | 6 |
Table 3 Post-Test Results of Gc and Ge for I3 and I4
| I3: Percentage of Poor Decision-Making (%) | I4: Percentage of Complaints (%) | |||
| N° | Post-Test Gc | Post-Test Ge | Post-Test Gc | Post-Test Ge |
| 1 | 33.3 | 16.7 | 33.3 | 16.7 |
| 2 | 40.0 | 30.0 | 40.0 | 30.0 |
| 3 | 37.5 | 25.0 | 37.5 | 25.0 |
| 4 | 36.4 | 18.2 | 36.4 | 18.2 |
| 5 | 33.3 | 16.7 | 33.3 | 16.7 |
| 6 | 42.9 | 28.6 | 42.9 | 28.6 |
| 7 | 50.0 | 25.0 | 50.0 | 25.0 |
| 8 | 33.3 | 16.7 | 33.3 | 16.7 |
| 9 | 37.5 | 25.0 | 37.5 | 25.0 |
| 10 | 50.0 | 33.3 | 50.0 | 33.3 |
| 11 | 22.2 | 11.1 | 22.2 | 11.1 |
| 12 | 50.0 | 25.0 | 50.0 | 25.0 |
| 13 | 27.3 | 18.2 | 27.3 | 18.2 |
| 14 | 30.0 | 20.0 | 30.0 | 20.0 |
| 15 | 28.6 | 14.3 | 28.6 | 14.3 |
| 16 | 50.0 | 33.3 | 50.0 | 33.3 |
| 17 | 22.2 | 11.1 | 22.2 | 11.1 |
| 18 | 50.0 | 33.3 | 50.0 | 33.3 |
| 19 | 18.2 | 9.1 | 18.2 | 9.1 |
| 20 | 42.9 | 28.6 | 42.9 | 28.6 |
| 21 | 28.6 | 14.3 | 28.6 | 14.3 |
| 22 | 37.5 | 25.0 | 37.5 | 25.0 |
| 23 | 40.0 | 30.0 | 40.0 | 30.0 |
| 24 | 33.3 | 16.7 | 33.3 | 16.7 |
| 25 | 50.0 | 25.0 | 50.0 | 25.0 |
| 26 | 33.3 | 22.2 | 33.3 | 22.2 |
| 27 | 36.4 | 18.2 | 36.4 | 18.2 |
| 28 | 37.5 | 12.5 | 37.5 | 12.5 |
| 29 | 33.3 | 16.7 | 33.3 | 16.7 |
| 30 | 37.5 | 25.0 | 37.5 | 25.0 |
Table 5 Descriptive Statistics Results
| Sample | n | Mean | StDev | AD | p-value |
| I1: Post-Test (Gc) | 30 | 2.353 | 0.286 | 0.461 | 0.243 |
| I1: Post-Test (Ge) | 1.863 | 0.190 | 0.513 | 0.179 | |
| I2: Post-Test (Gc) | 30 | 4.933 | 1.799 | 0.545 | 0.147 |
| I2: Post-Test (Ge) | 6.033 | 1.903 | 0.507 | 0.185 | |
| I3: Post-Test (Gc) | 30 | 36.77 | 8.825 | 0.629 | 0.092 |
| I3: Post-Test (Ge) | 21.49 | 7.090 | 0.585 | 0.119 | |
| I4: Post-Test (Gc) | 30 | 36.77 | 8.825 | 0.629 | 0.092 |
| I4: Post-Test (Ge) | 21.49 | 7.090 | 0.585 | 0.119 |
Table 6 Summary of Results for Indicators
| Sample | N | 95% Confidence Interval for Mean | Kurtosis | Skewness | Q3 |
| I1: Post-Test (Ge) | 30 | 1.792 – 1.934 days | 0.817 | 0.568 | 2.00 |
| I2: Post-Test (Ge) | 30 | 5.322 – 6.743 deliveries | -0.612 | 0.270 | 7.25 |
| I3: Post-Test (Ge) | 30 | 18.840 - 24.135 % | -1.030 | 0.098 | 25.89 |
| I4: Post-Test (Ge) | 30 | 18.840 - 24.135 % | -1.030 | 0.098 | 25.89 |
4 Case Study
This section presents the practical application of the Hefesto methodology in a real-world setting, providing a detailed description of the study context, the analyzed company, and the implemented procedures. It outlines the strategies used for data collection and analysis, as well as the integration of Business Intelligence (BI) to optimize freight transport. The Hefesto methodology is structured into four fundamental phases:
Requirements Analysis, where business needs and objectives are identified.
OLTP Analysis, which enables an understanding of the generation and storage of operational data.
Logical Data Warehouse Model, where the Data Warehouse (DW) structure is designed to optimize queries and analysis.
Data Integration, the phase in which the ETL process is implemented to ensure the consistency and availability of information.
4.1 Requirements Analysis
This phase aims to thoroughly analyze the company's needs and the specific requirements for the design and development of the Data Warehouse (DW), ensuring that its structure and functionality align with organizational objectives and facilitate data-driven decision-making.
4.1.1 Identifying Questions
We use the following identifying questions:
− What is the average delivery time for different orders?
− How many deliveries are made within the estimated time (in days)?
− What is the percentage of complaints related to machinery for the orders?
− Which are the main districts with the highest number of deliveries?
− Which are the main provinces with the highest number of deliveries?.
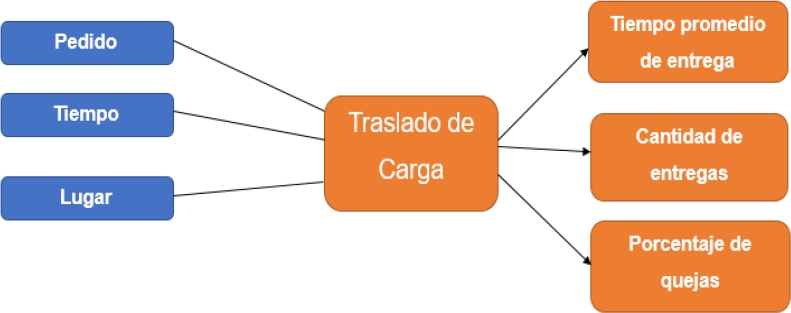
4.1.2 Identifying Indicators and Perspectives
Indicators: Average Delivery Time, Number of Deliveries, Percentage of Complaints
Perspectives: Order, Time, Location.
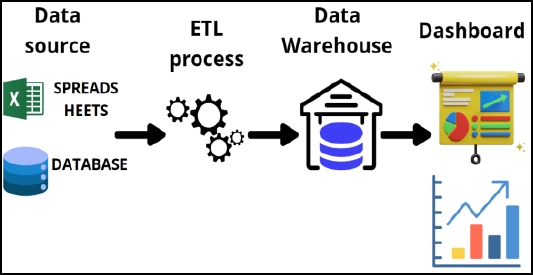
4.1.3 Solution Architecture
A specific architecture was designed for the implementation of Business Intelligence (BI), structured to optimize data processing, storage, and analysis. This architecture defines the integration of data sources, ETL processes, storage in the Data Warehouse (DW), and visualization through analytical tools (see Figure 2).
4.1.4 Solution Architecture
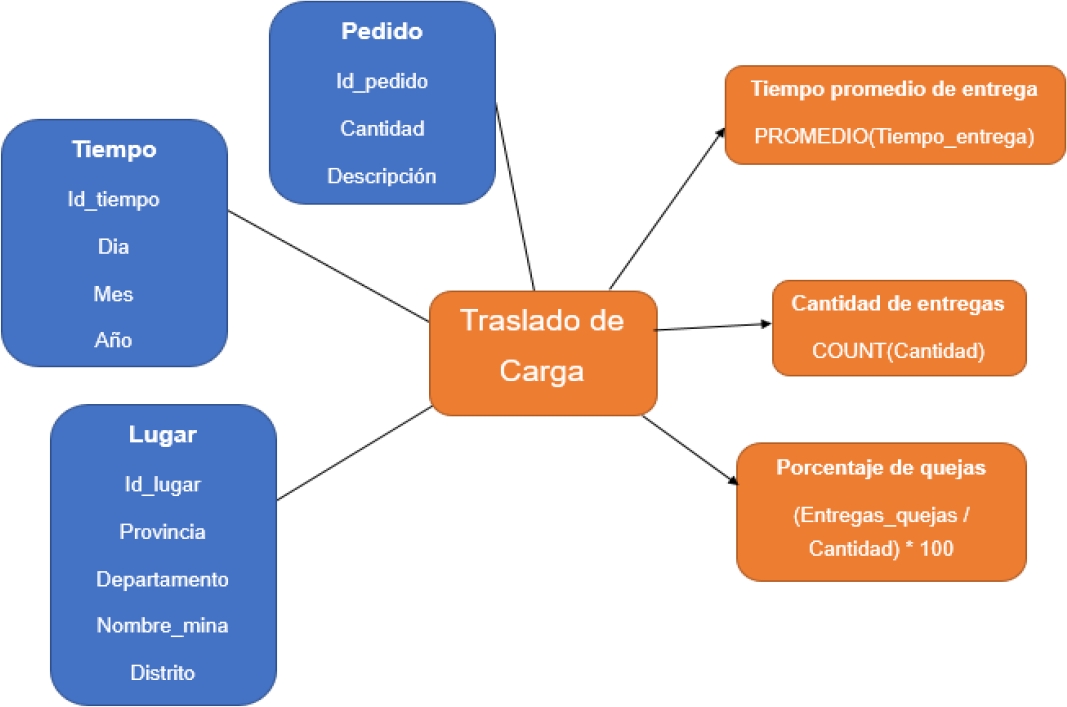
The conceptual model integrates the indicators and perspectives obtained from the requirements analysis. This model establishes the data structure and its relationship with the key factors of the study, allowing for a clear representation of the information to support decision-making (see Figure 3).
4.2 OLTP Analysis
In this phase, the previously identified requirements are analyzed, determining the data granularity and establishing the correspondences between each indicator and the available information sources. This process ensures consistency and accuracy in the structuring of operational data, facilitating its integration into the Data Warehouse (DW) and subsequent analysis in the BI system.
4.2.1 Configuring Indicators
We configure the indicators using the following parameters.
— Average Delivery Time:
Facts: Average Delivery Time,
Function: AVERAGE(Delivery_Time),
Explanation: This indicator represents the average delivery time for orders.
— Number of Deliveries:
Facts: Number of Deliveries,
Function: COUNT(Quantity),
Explanation: This indicator shows the number of deliveries made within an estimated time.
— Percentage of Complaints:
Facts: Percentage of Complaints,
Function: (Complaint_Percentage/Quantity) × 100,
Explanation: This indicator shows the percentage of complaints, calculated by dividing the number of poor decisions by the total number of decisions.
4.2.2 Establishing Correspondences
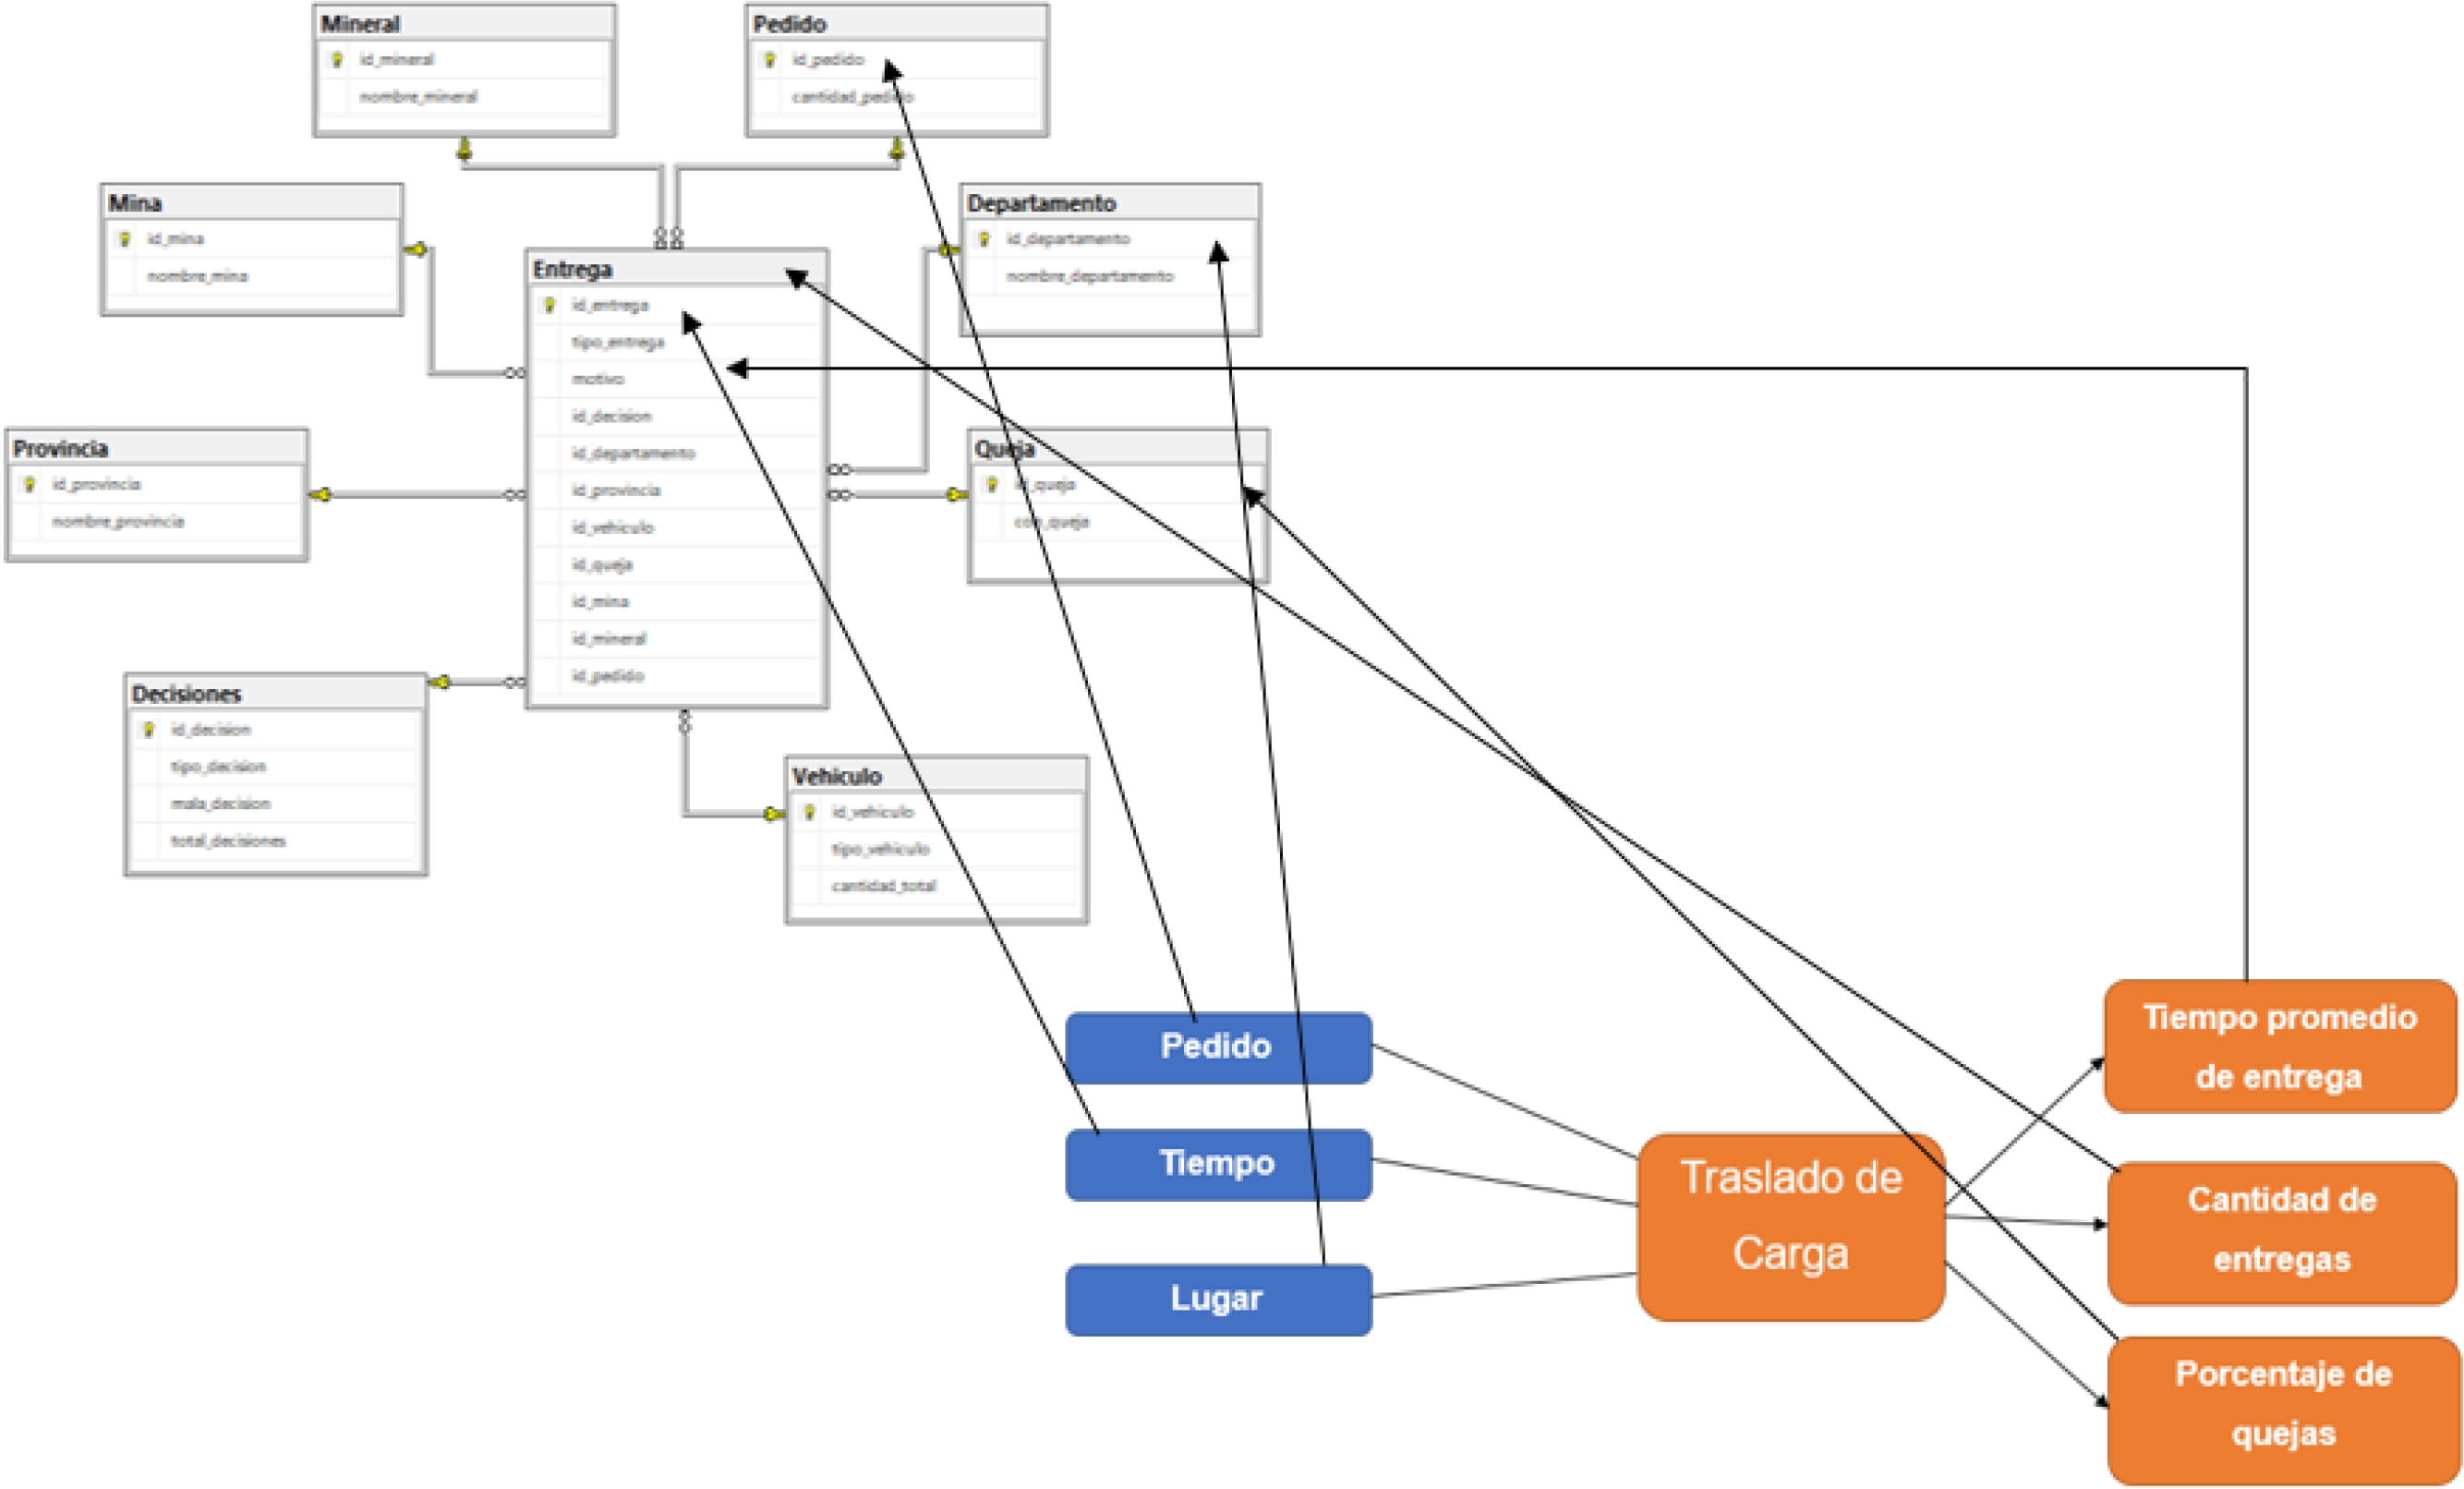
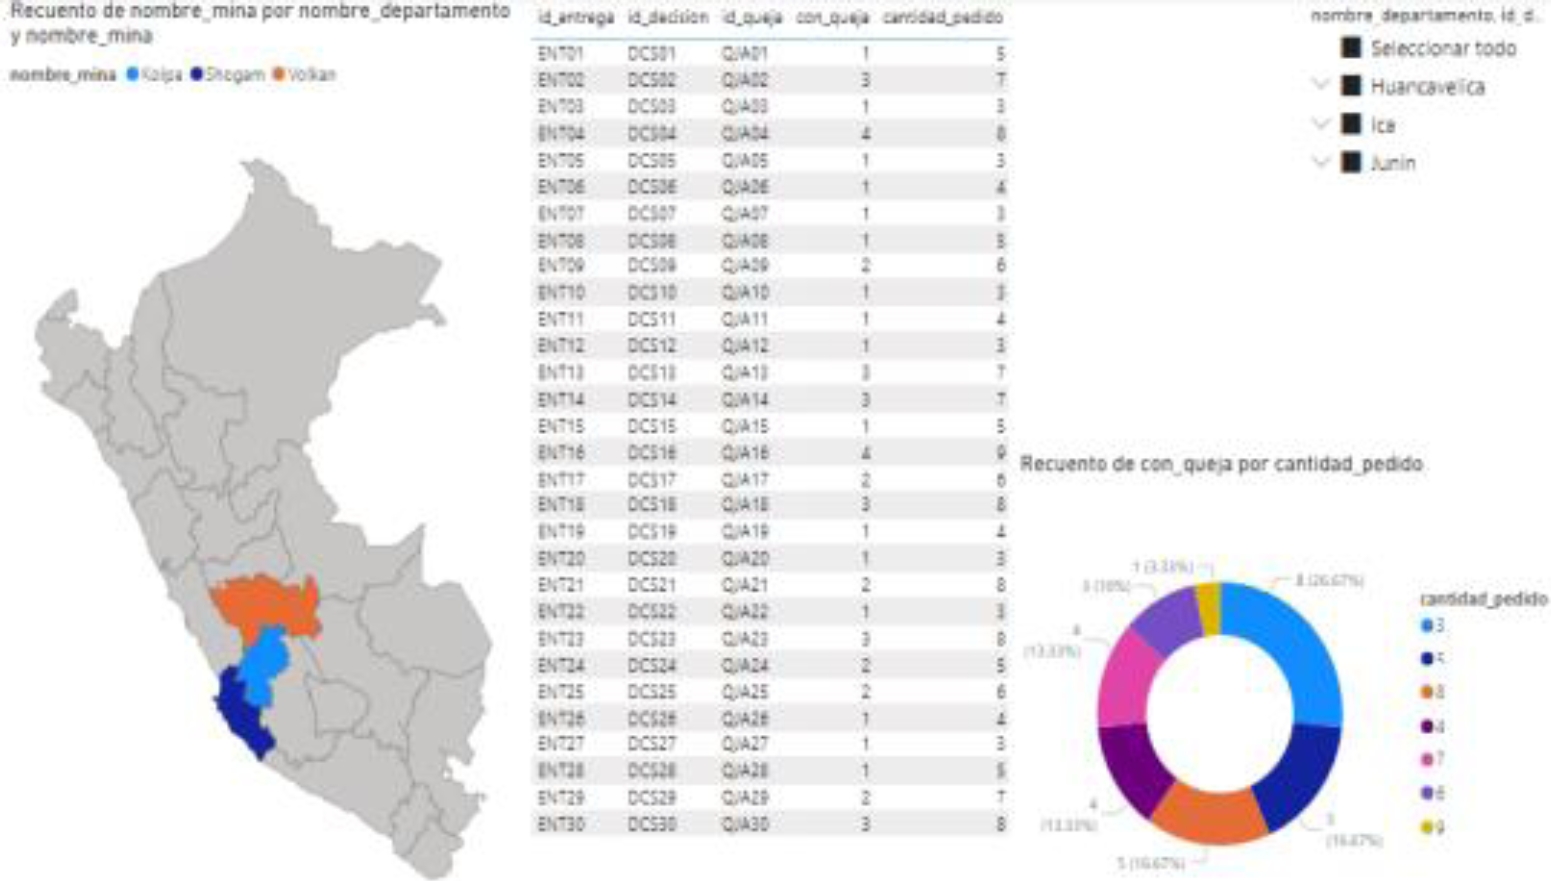
The database of RB TRANSERVI E.I.R.L. is presented (see Figure 4).
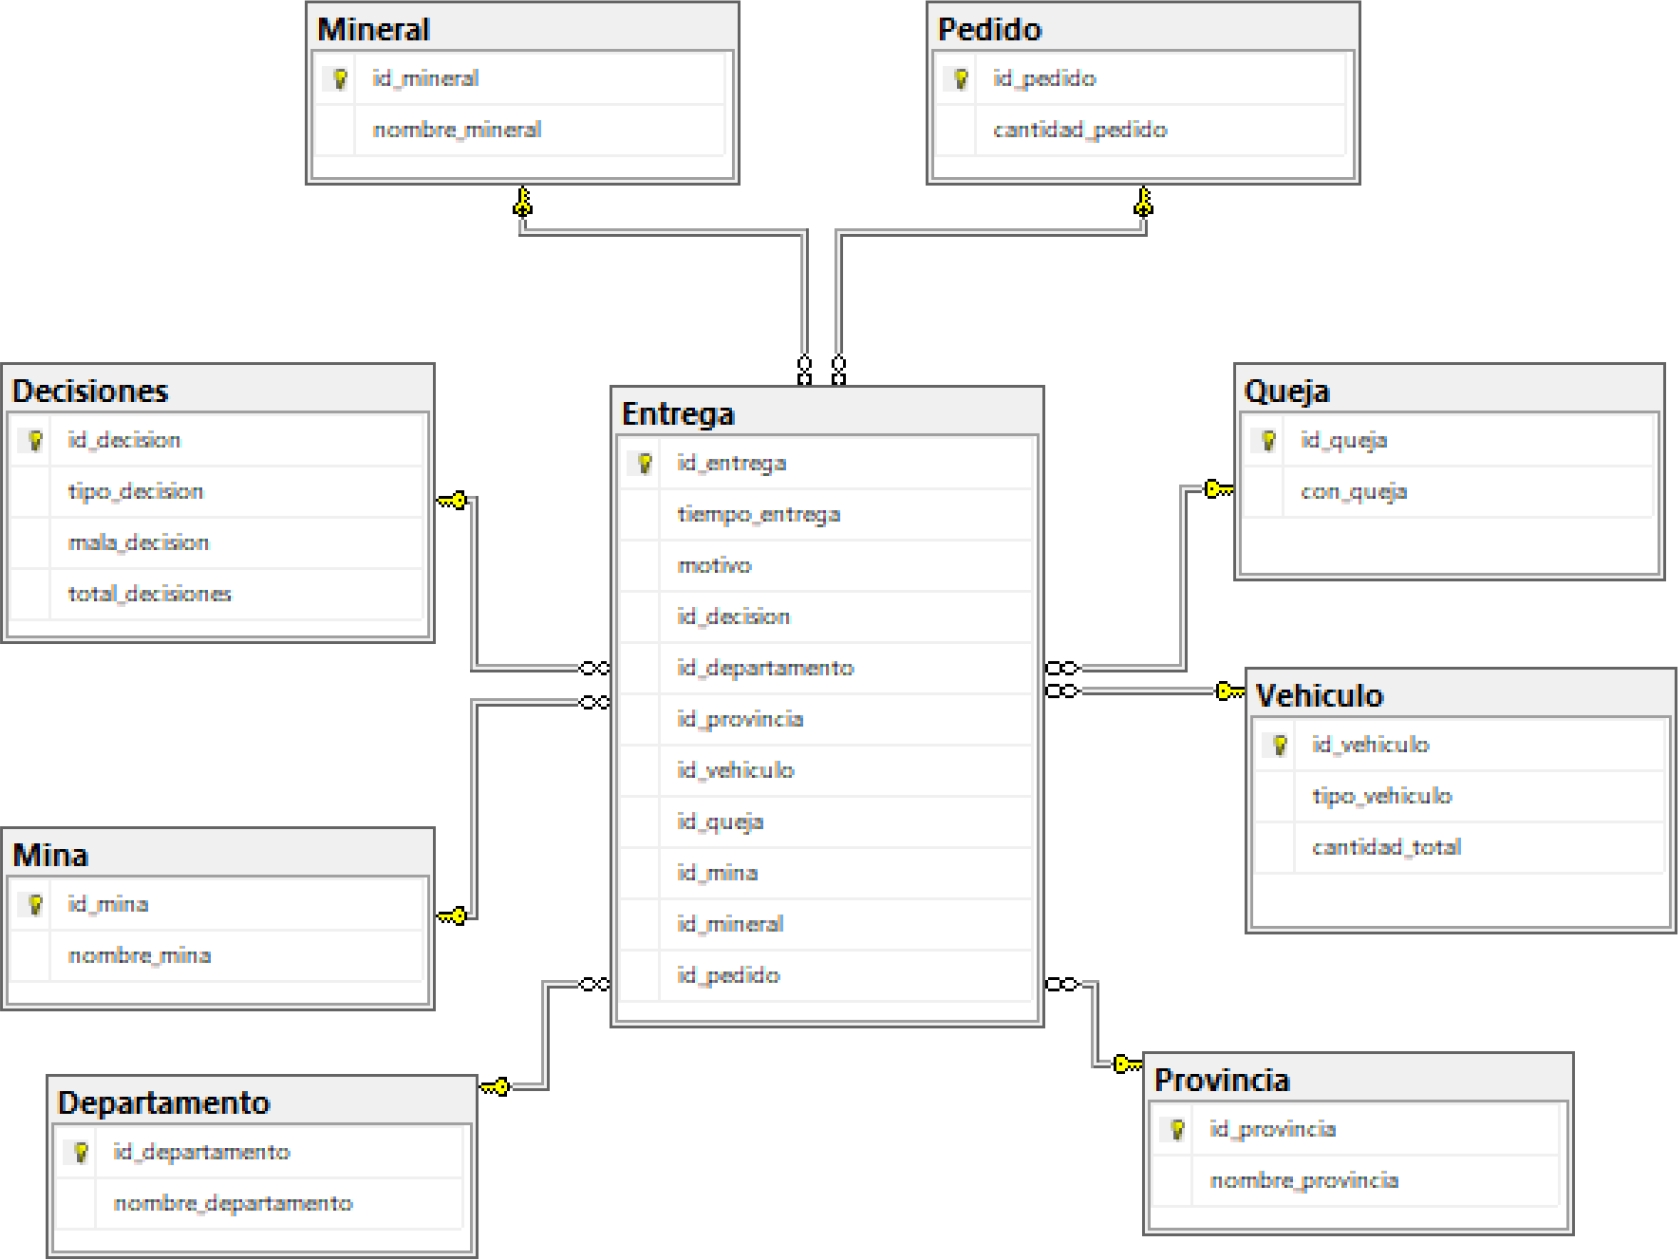
In Figure 5, the correspondences between the indicators and the database structure are defined.
4.2.3 Level of Granularity
Data granularity is detailed for the dimensions obtained from the analysis.
4.2.4 Expanded Conceptual Model
After defining the correspondences, the expanded conceptual model is presented, which incorporates a more detailed structure of the indicators and their relationship with the data sources. This version allows for a better representation of information and its alignment with Data Warehouse (DW) requirements, facilitating more accurate analysis (see Figure 6).
4.3 Logical Data Warehouse Model
In this phase, the type of logical model to be implemented in the Data Warehouse (DW) is defined, ensuring an optimized structure for data analysis. Dimension tables and the fact table are designed and generated, establishing the relationships between them using an appropriate schema, such as the Star Schema or Snowflake Schema, to improve query efficiency and data integration in the BI system.
-
— Type of logical model:
-
— Dimension tables:
— Location dimension (figure 9).
-
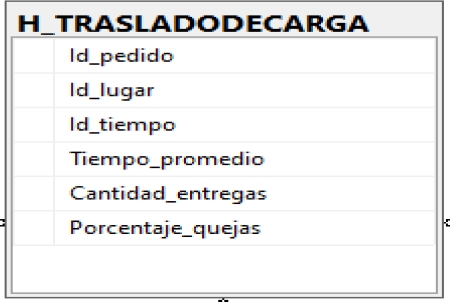
— Fact table.
— Joins.


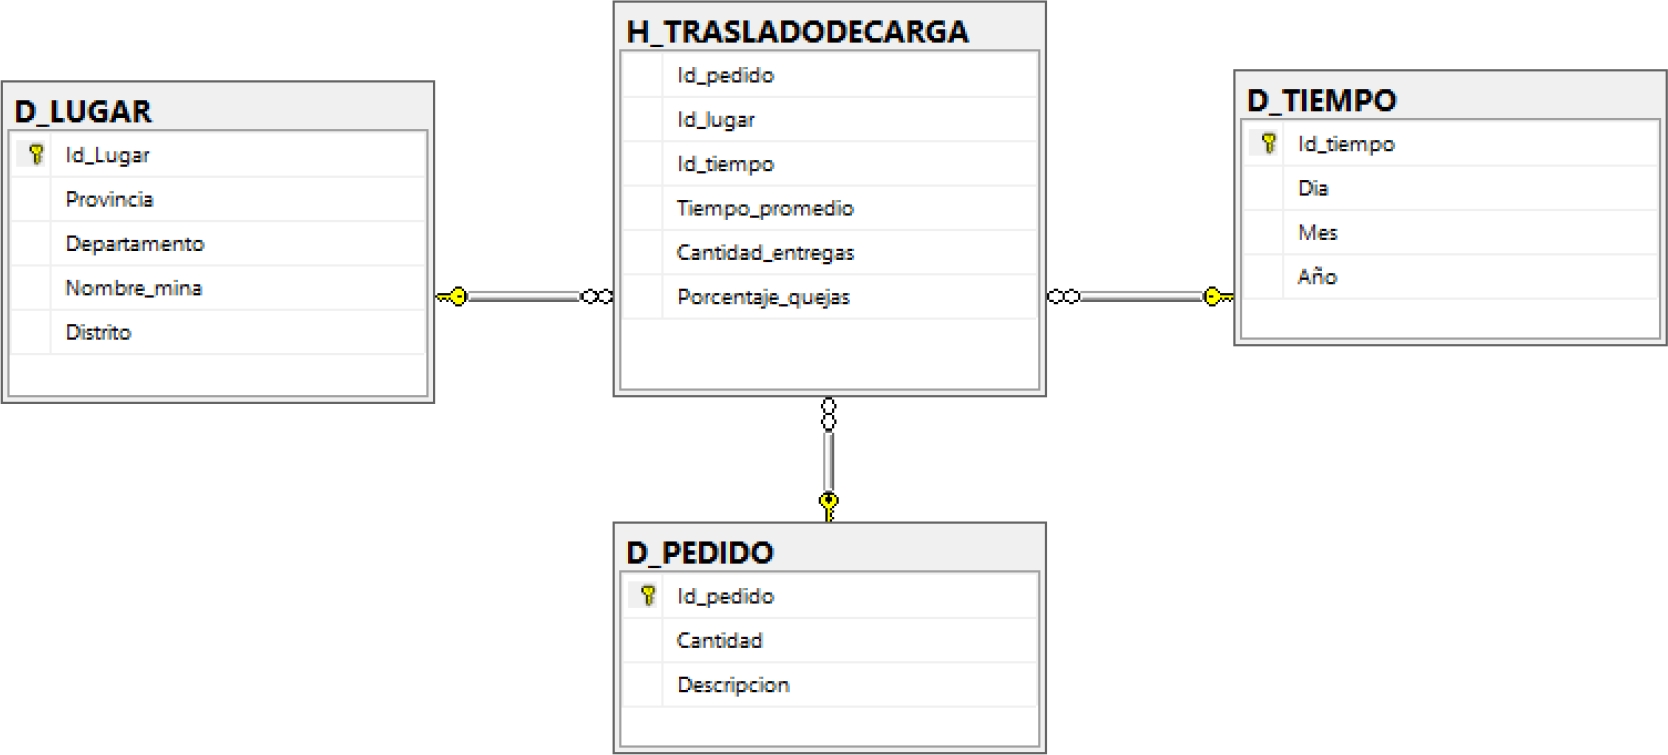
The join table of the dimensions with the fact table using the Star Schema logical model is presented (see Figure 11).
4.4 Data Integration
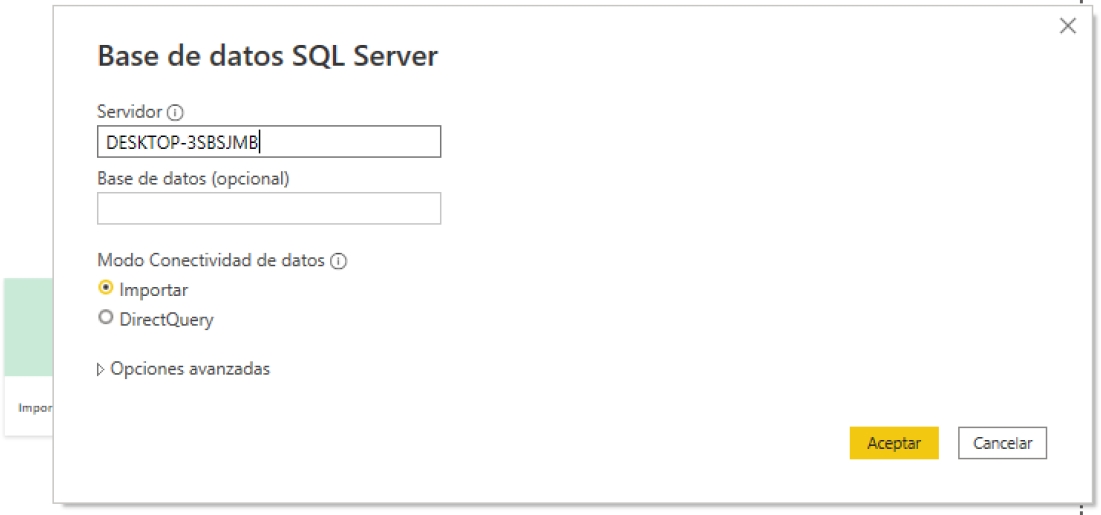
Initial Load: Power BI is used to perform the initial data load, ensuring proper integration and availability in the Data Warehouse (DW). This process structures information from various sources for subsequent analysis and visualization (see Figure 12).
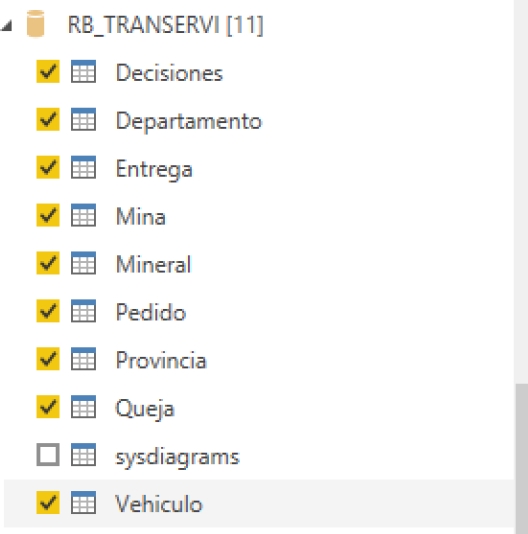
The data is imported from the RB_TRANSERVI database (see Figure 13).
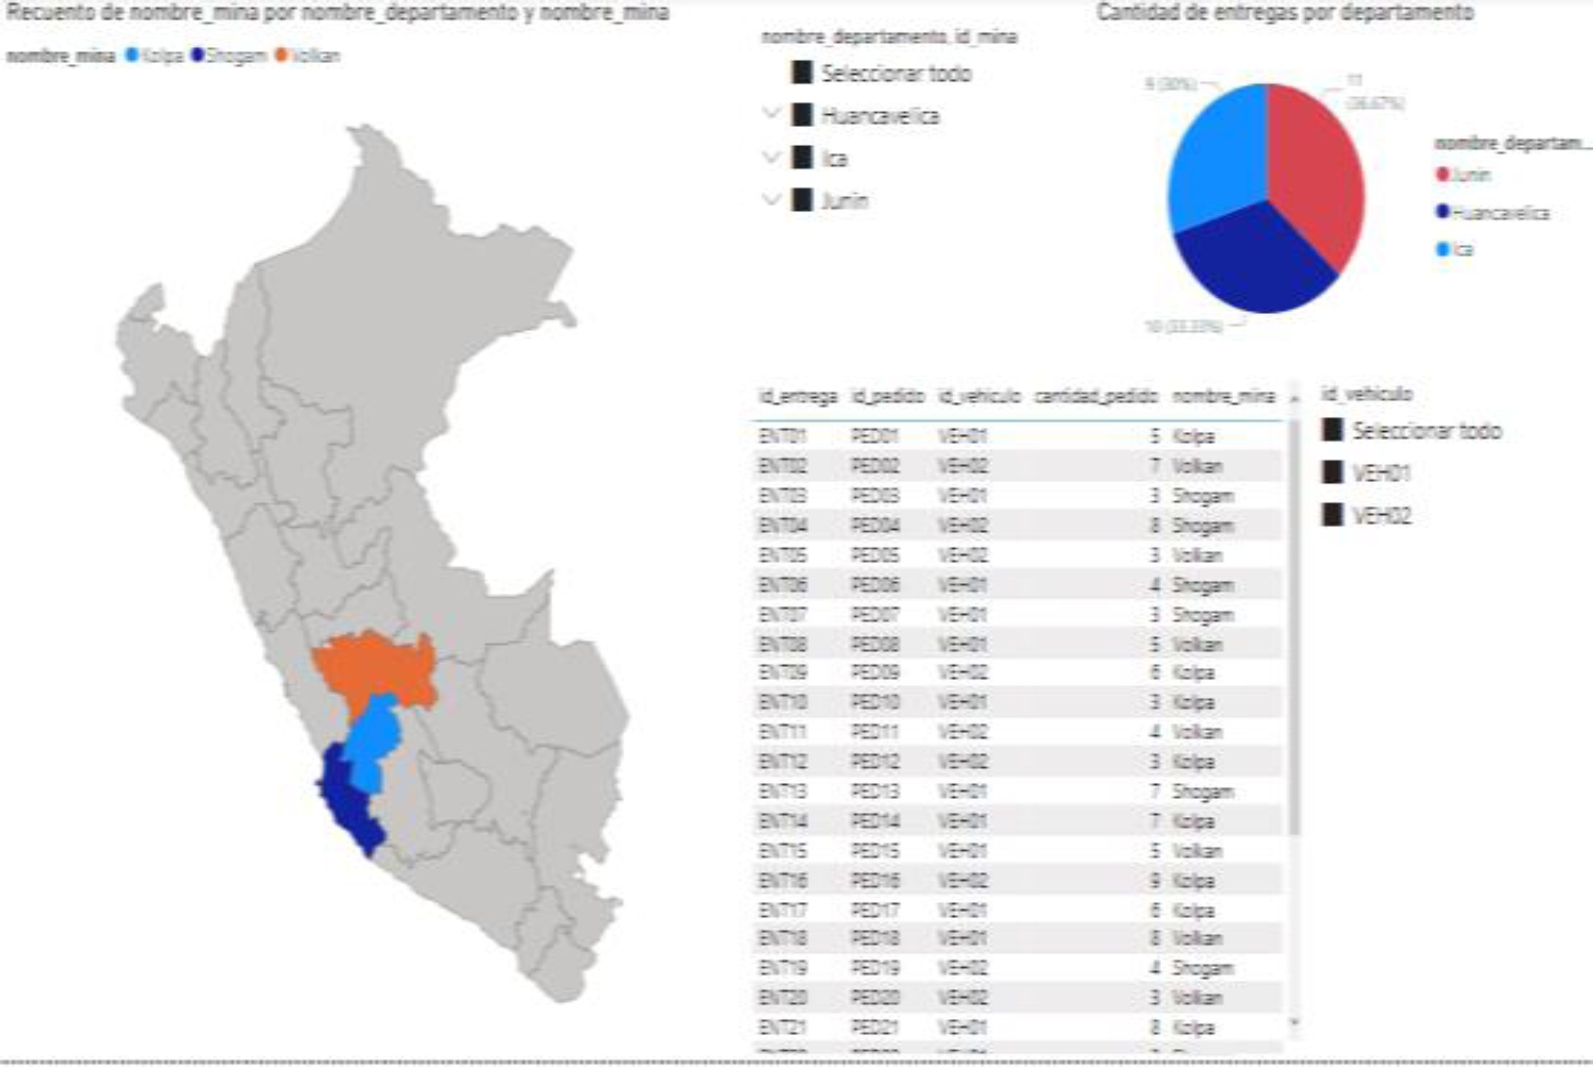
A report on the Number of Deliveries is generated (see Figure 14).
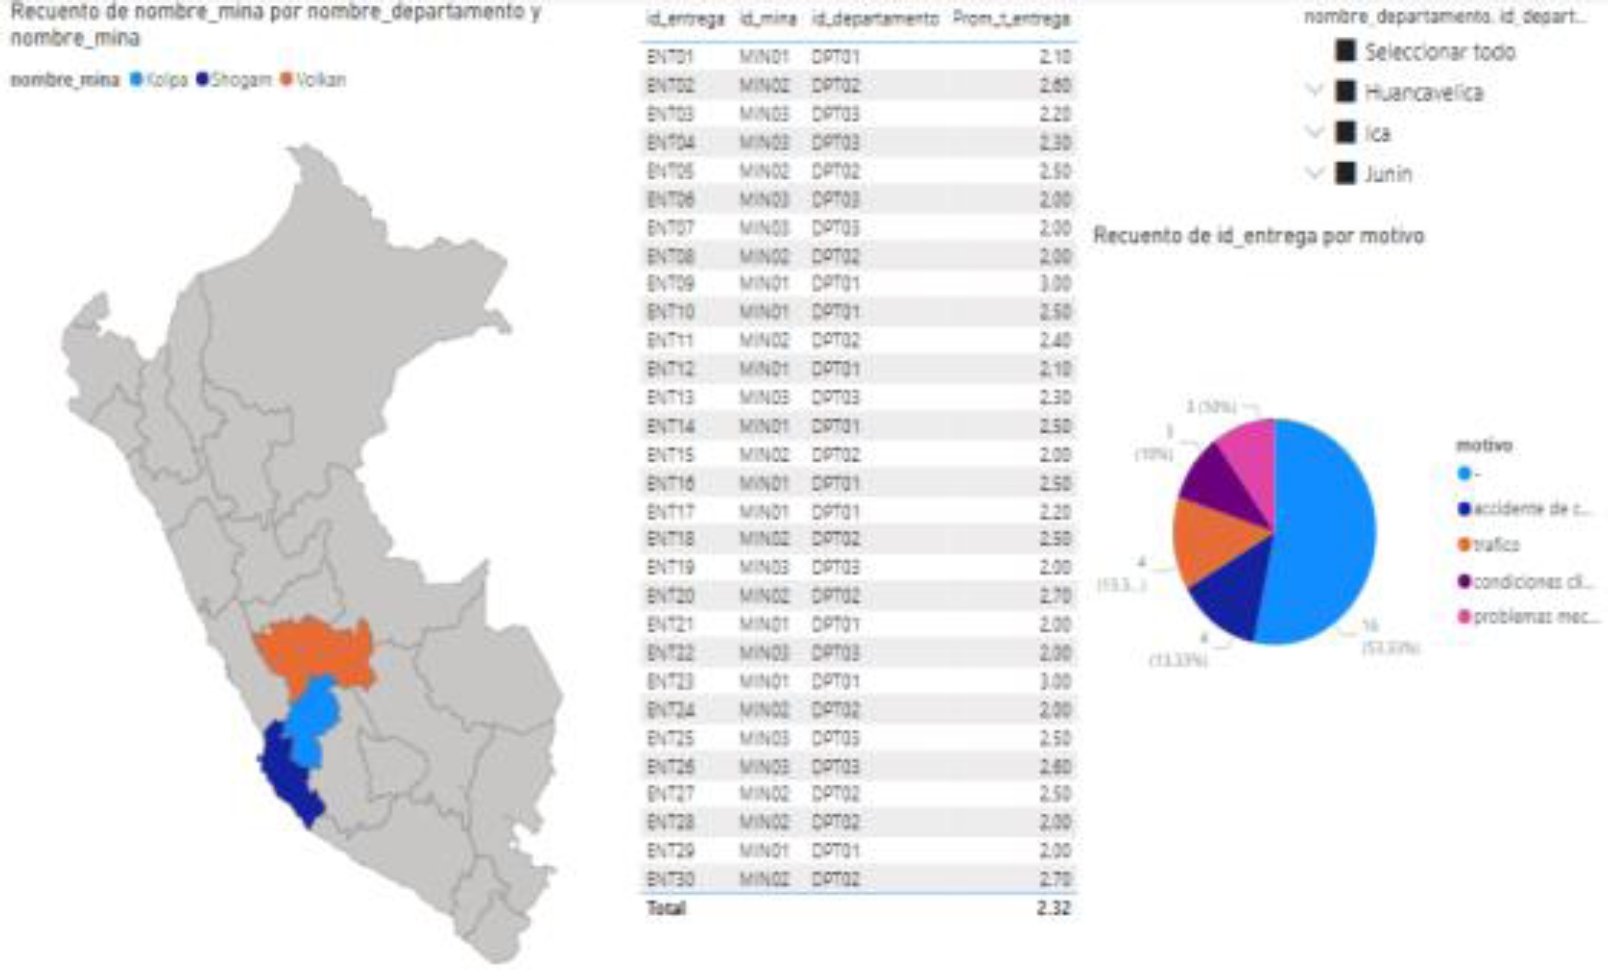
A report on the Average Delivery Time is generated, also indicating the main reasons for late deliveries (see Figure 15).
A report on the Percentage of Complaints relative to the number of orders is generated (see Figure 16).
5 Results and Discussion
This section presents the findings obtained after the implementation of Business Intelligence (BI) in freight transport, evaluating its impact on operational efficiency and decision-making. The experimental results are analyzed, compared with previous studies, and discussed in terms of their relevance to logistics optimization. Additionally, the implications of the key indicators are examined, providing quantitative evidence of the improvements achieved and identifying opportunities for future research.
5.1 Experimental Results
The results show a significant improvement in delivery time, on-time deliveries, a reduction in the percentage of poor decisions, and a decrease in the percentage of complaints. A total of 30 values were collected for each indicator, which are presented in Table 2 and Table 3, providing a quantitative basis for analyzing the impact of BI implementation on freight transport optimization.
The following formulas were used to calculate On-Time Deliveries (CEA), Percentage of Poor Decision-Making (PMD), and Percentage of Complaints (PQ):
The results demonstrate significant improvements in freight transport management following the implementation of BI. The experimental group (Ge) showed a reduction in Delivery Time (I1) and an increase in On-Time Deliveries (I2), reflecting enhanced operational efficiency. Moreover, the Percentage of Poor Decision-Making (I3) and the Percentage of Complaints (I4) decreased notably, indicating improved planning accuracy and increased customer satisfaction. These findings confirm that the use of BI optimizes decision-making, reduces errors, and strengthens competitiveness in the freight transport sector.
5.2 Normality Test
The normality test is essential for evaluating the distribution of the data and determining whether they follow a normal distribution.
In this way we validate the applicability of parametric statistical tests. This analysis ensures rigor in the interpretation of the results and the reliability of the conclusions obtained (see Figures 17, 18, 19, and 20).
For I1: Delivery Time.
For I2: On-Time Deliveries.
For I3: Percentage of Poor Decision-Making.
For I4: Percentage of Complaints.
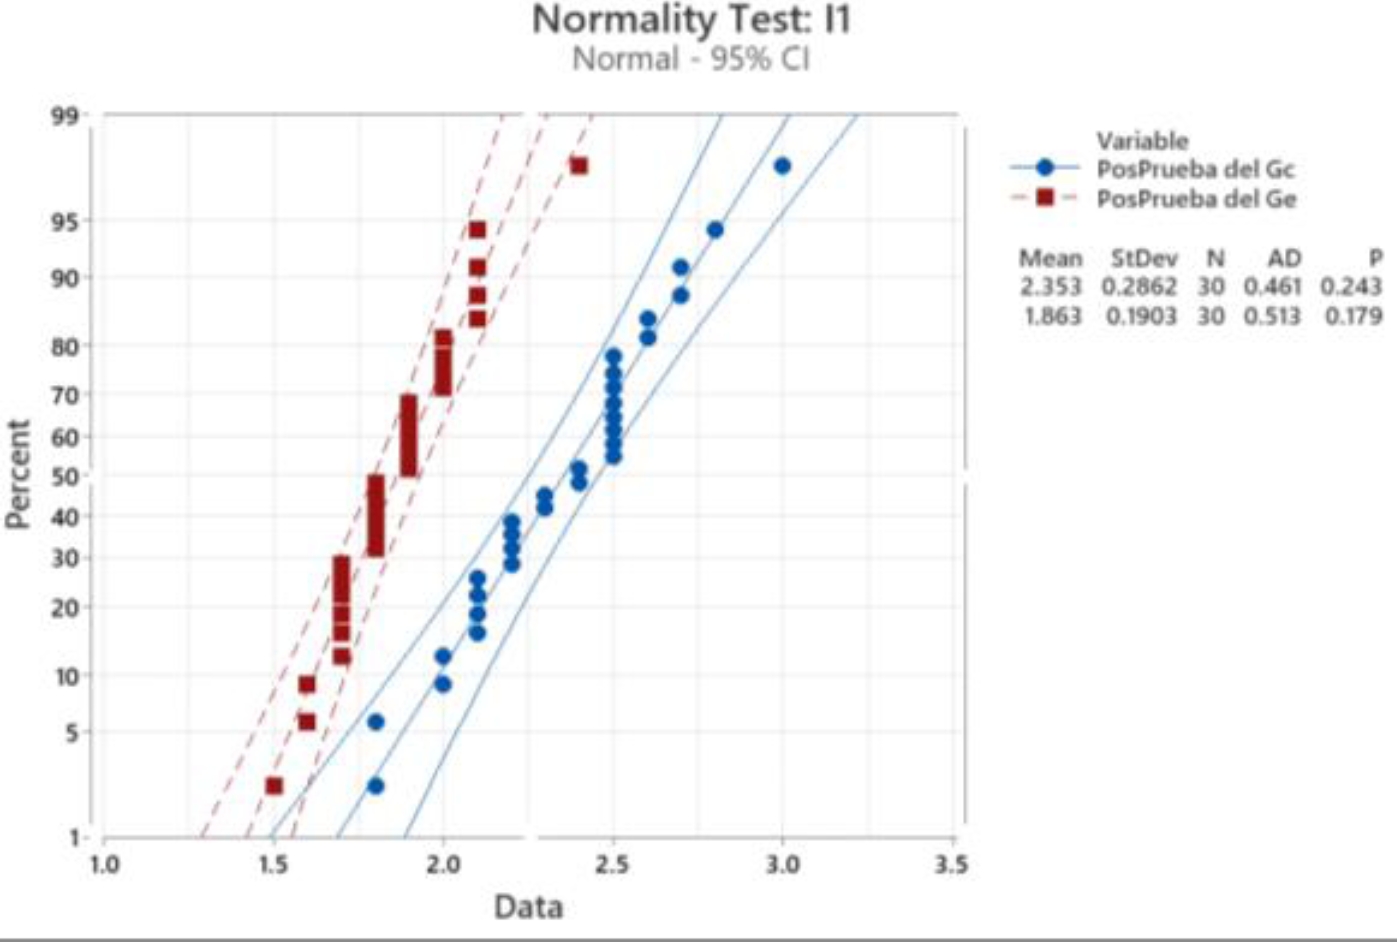
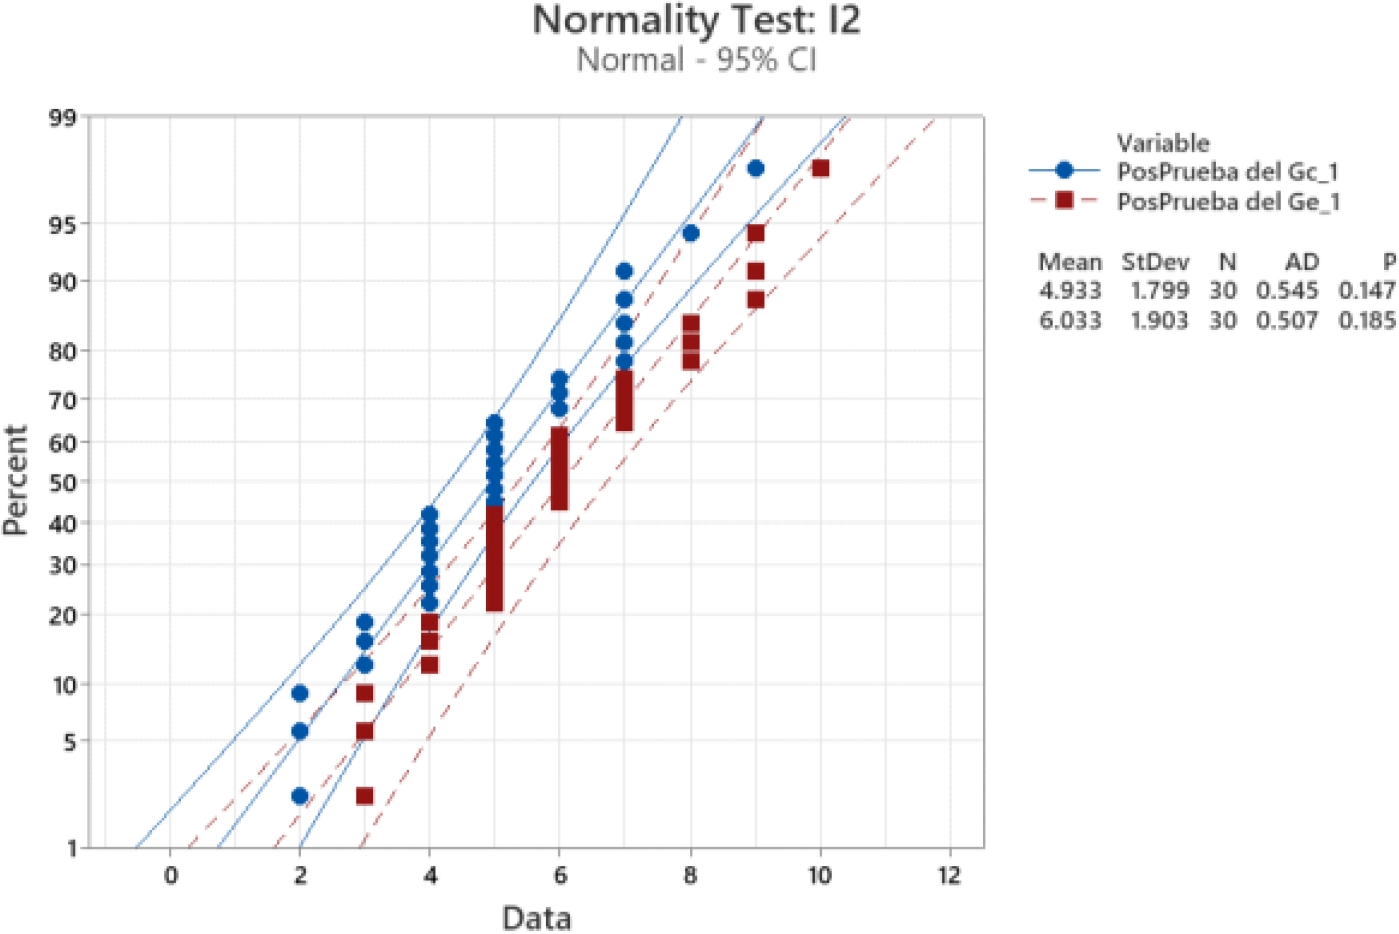

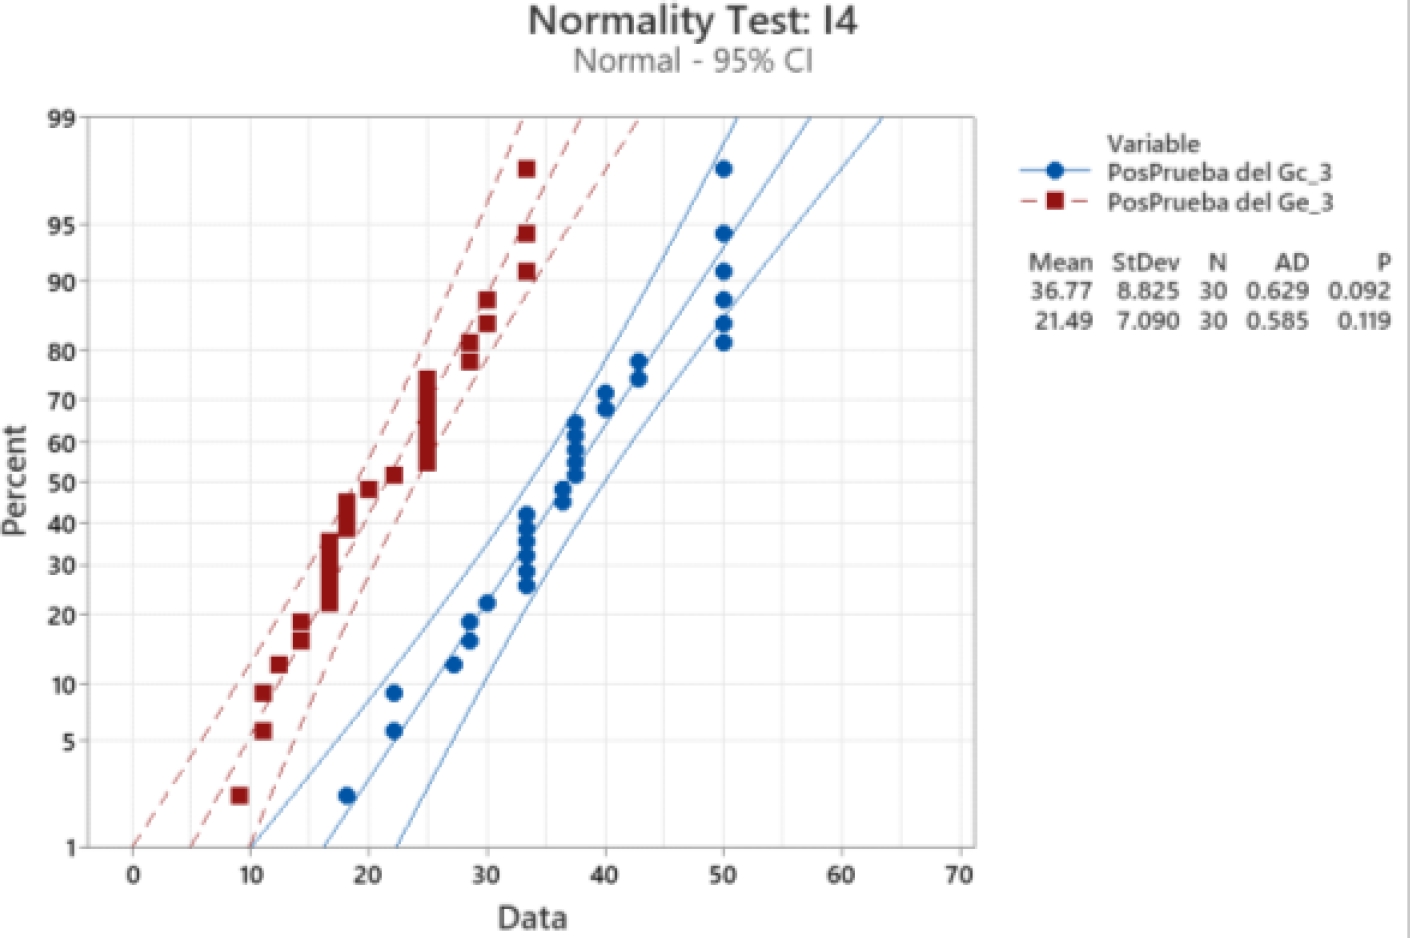
For the indicators I1, I2, I3, and I4, the normality test reveals that the p-value is higher than the established significance level (α = 0.05), confirming that the data follow a normal distribution. This validation allows for the application of parametric statistical tests, therefore, the Student's t-test will be used to test the formulated hypotheses and evaluate the impact of BI implementation on optimizing freight transport.
5.3 Discussion of Results
A descriptive and inferential analysis of the data obtained in the research is now conducted, allowing a detailed interpretation of the findings. The objective is to contextualize the impact of the results concerning each previously formulated hypothesis, evaluating their validity and relevance within the study.
5.3.1 Using Descriptive Statistics
A descriptive analysis of the data is performed, identifying trends and relevant patterns in the evaluated indicators. This review provides a clear view of the distribution and behavior of the variables, facilitating the interpretation of the obtained results (see Tables 5 and 6).
For Indicator I1: Delivery Time
The experimental group (Ge) presented a shorter delivery time (Mean = 1.863 days) compared to the control group (Gc) (Mean = 2.353 days), demonstrating a reduction in logistics times after the implementation of BI. The standard deviation (StDev) in Ge (0.190) was lower than in Gc (0.286), indicating less variability in delivery times. The 95% confidence interval for Ge (1.792 – 1.934 days) confirms the reduction in delivery times. The kurtosis (0.817) in Ge indicates a slightly more concentrated distribution of central values, and the skewness (0.568) suggests a slight tendency towards higher values. Finally, the third quartile (Q3 = 2.00 days) in Ge confirms that 75% of the deliveries were made in 2 days or less.
The results obtained in this study exceeded the findings of Caratt-Padilla et al. [17] in their research "Impact of Non-Compliance with Product Deliveries on Return on Investment," where an 8.82% reduction in delivery times was reported, allowing the company to evaluate the financial impact of the process and improve cash flow.
Similarly, Temesgen et al. [18], in their study "Evaluation of Decision to Delivery Time Interval and Its Effect on Feto-Maternal Outcomes and Associated Factors in Category-1 Emergency Caesarean Section Deliveries: Prospective Cohort Study" achieved a 19.6% decrease in delivery times, demonstrating significant operational improvements. In contrast, Nisingizwe et al. [19], in their work "Effect of Unmanned Aerial Vehicle (Drone) Delivery on Blood Product Delivery Time and Wastage in Rwanda: A Retrospective, Cross-Sectional Study and Time Series Analysis" documented a 65.83% reduction in delivery times using drones for medical supply distribution compared to traditional land transport methods.
These studies reinforce the importance of innovative strategies in logistics optimization, although the differences in reduction percentages suggest that the impact varies by sector and technology employed. The reduction in delivery time confirms that the implementation of BI can significantly improve logistics efficiency in transport companies. These findings can be extrapolated to other sectors dependent on time optimization, such as last-mile distribution and inventory management. Globally, the adoption of intelligent systems in logistics could reduce operational costs and enhance competitiveness in highly dynamic markets.
For Indicator I2: On-Time Deliveries
The experimental group (Ge) achieved a higher number of on-time deliveries (Mean = 6.033) compared to the control group (Gc) (Mean = 4.933), indicating an increase in service punctuality. The standard deviation (StDev) was similar in both groups, although slightly higher in Ge (1.903) compared to Gc (1.799), suggesting that the increase in on-time deliveries with BI may generate variability in certain cases. The 95% confidence interval for Ge (5.322 – 6.743 deliveries) demonstrates a significant improvement. The kurtosis (-0.612) indicates a flatter distribution in Ge, and the skewness (0.270) suggests a slight tendency towards higher values. The third quartile (Q3 = 7.25 deliveries) shows that 75% of the cases in Ge achieved at least 7 on-time deliveries.
The findings of this study were lower than those reported by Kowalczyk, Lipman, and Carvalho [20] in their study "Estimating Obstetric Anaesthesia Workload: Number of Deliveries Compared to Time-Based Workload" where 41% on-time deliveries were achieved when comparing workdays and non-workdays. Similarly, Zapata, Vélez, and Arango [21], in their article "Improving the Distribution Process in a Transport Company" reported a 50% increase in on-time deliveries after optimizing vehicle routing management. However, the results obtained in this study outperformed those of Ruiz Moreno et al. [22] in their research "Mathematical Model for the Distribution Network Optimization of a Courier and Parcel Company," where a 19% increase in delivery punctuality was observed after improving the distribution network. These differences highlight the impact of various logistics and operational strategies on optimizing on-time deliveries, emphasizing the need for approaches tailored to each business context. The increase in on-time deliveries suggests that BI is an effective tool for optimizing transport planning and execution. This model can be applied in contexts where delivery precision is critical, such as the pharmaceutical industry or e-commerce. In the long term, the use of advanced technologies for transport management could reduce urban congestion and improve sustainability in goods distribution.
For Indicator I3: Percentage of Poor Decision- Making
The experimental group (Ge) experienced a significant reduction in the percentage of poor decision-making (Mean = 21.49%) compared to the control group (Gc) (Mean = 36.77%), demonstrating that BI contributed to improved accuracy in operational management. The standard deviation (StDev) in Ge (7.090) was lower than in Gc (8.825), indicating less variability in decision quality. The 95% confidence interval for Ge (18.840 - 24.135%) supports the reduction in poor decisions. The kurtosis (-1.030) in Ge indicates a less centralized distribution, and the skewness (0.098) suggests a symmetric behavior of the data. The third quartile (Q3 = 25.89%) in Ge indicates that the majority of the values are below 26%.
The values obtained in this research exceed those reported by Alonso et al. [23] in their study "Poor Decision Making and Sociability Impairment Following Central Serotonin Reduction in Inducible TPH2-Knockdown Rats," where a 20% reduction in the percentage of poor decision-making was achieved after reducing serotonin levels, directly affecting the decision-making process. Similarly, Huachillo, Ramos, and Pulache [24], in their work "Financial Management and Its Impact on Financial Decision-Making," recorded 35.71% poor decisions in the financial context. However, the results obtained were lower than those reported by Lichtenthal et al. [25] in their research "Regret and Unfinished Business in Parents Bereaved by Cancer: A Mixed Methods Study," where a 73% reduction in the frequency of poor decision-making was achieved. These comparisons highlight the influence of various factors on optimizing the decision-making process, emphasizing the importance of data-driven approaches and specialized methodologies to improve decision accuracy in diverse contexts. The reduction in poor decisions demonstrates the positive impact of data analytics on strategic and operational decision-making. This approach can be replicated in sectors such as financial management, industrial production, and human resource management, where poor decisions can lead to significant losses. In the future, the integration of predictive models with BI could further enhance decision quality.
For Indicator I4: Percentage of Complaints
The experimental group (Ge) reduced the percentage of complaints (Mean = 21.49%) compared to the control group (Gc) (Mean = 36.77%), reflecting an improvement in customer satisfaction after implementing BI. The standard deviation (StDev) in Ge (7.090) was lower than in Gc (8.825), indicating less variability in service perception. The 95% confidence interval for Ge (18.840 - 24.135%) confirms the improvement in customer satisfaction. The kurtosis (-1.030) in Ge suggests a more dispersed distribution, while the skewness (0.098) indicates a symmetric pattern in the distribution of complaints. The third quartile (Q3 = 25.89%) shows that 75% of the cases in Ge had fewer than 26% complaints.
The results obtained in this research exceeded those reported by Kim et al. [26] in their study "Use of Online Consumer Complaint Forms to Enhance Complaint-Based Surveillance for Foodborne Illness Outbreaks in Minnesota," where an 18% reduction in the percentage of complaints was achieved.
However, the values obtained were lower than those reported by Cedeño, S., Cedeño, J., and García [27] in their article "Cost of Transportation and Its Impact on Distribution in J&C Company, Santo Domingo 2023," where a 67% reduction in poor decision-making was achieved. Similarly, the findings were also lower compared to those of Ingaldi [28] in their research "Complaint Analysis as Part of Service Quality and Safety Management," where an 88.78% reduction in the percentage of complaints was obtained.
These differences reflect the variability in the effectiveness of strategies applied in different sectors, highlighting the need for customized approaches to service quality management and operational process optimization. The reduction in the percentage of complaints highlights the importance of effective data analysis in enhancing the customer experience. This optimization model can be applied in industries such as tourism, customer service, and retail, where user satisfaction is a key factor. In terms of technological evolution, the integration of BI with artificial intelligence could anticipate demand trends and prevent issues before they affect service perception.
5.3.2 Using Inferential Statistics
Table 7 presents the results of the statistical tests applied to test the hypotheses, providing quantitative evidence of the impact of BI implementation on freight transport optimization. These values validate the significant differences between the experimental group (Ge) and the control group (Gc), confirming the effectiveness of the proposed approach.
Table 7 Hypothesis Testing for Parametric Indicators
| Sample | n | Ho | t-value | p-value |
| I1: Post-Test (Gc) | 30 | µ1 ≤ µ2 | 7.81 | 0.00 |
| I1: Post-Test (Ge) | ||||
| I2: Post-Test (Gc) | 30 | µ1 ≥ µ2 | -2.30 | 0.01 |
| I2: Post-Test (Ge) | ||||
| I3: Post-Test (Gc) | 30 | µ1 ≤ µ2 | 7.39 | 0.00 |
| I3: Post-Test (Ge) | ||||
| I4: Post-Test (Gc) | 30 | µ1 ≤ µ2 | 7.39 | 0.00 |
| I4: Post-Test (Ge) |
For Delivery Time (I1)
The null hypothesis (Ho: µ1 ≤ µ2) is rejected with a t-value of 7.81 and a p-value of 0.00, confirming that the experimental group (Ge) achieved significantly shorter delivery times than the control group (Gc). This indicates that the BI implementation significantly reduced delivery times.
These results suggest that using BI in logistics can improve operational efficiency in sectors such as freight transport, distribution, and e-commerce. The optimization of delivery times can be replicated in urban and international environments, reducing costs and enhancing competitiveness.
For On-Time Deliveries (I2)
The null hypothesis (Ho: µ1 ≥ µ2) is rejected with a t-value of -2.30 and a p-value of 0.01, indicating that the experimental group (Ge) achieved a significantly higher number of on-time deliveries compared to the control group (Gc). This demonstrates that BI optimized delivery planning.
The increase in on-time deliveries suggests that BI can be applied in sectors requiring high precision, such as pharmaceutical transportation and the food industry. Its implementation in logistics companies would reduce penalties for delays and improve customer satisfaction.
For Percentage of Poor Decision-Making (I3)
The null hypothesis (Ho: µ1 ≤ µ2) is rejected with a t-value of 7.39 and a p-value of 0.00, indicating that the experimental group (Ge) made significantly fewer poor decisions compared to the control group (Gc). This demonstrates that BI improved decision-making quality.
This result confirms that BI is a key tool for enhancing strategic and operational decision-making in various sectors, such as finance and manufacturing. Its application in high-uncertainty environments can minimize critical errors and optimize resources. The future integration with artificial intelligence could further enhance decision-making processes.
For Percentage of Complaints (I4)
The null hypothesis (Ho: µ1 ≤ µ2) is rejected with a t-value of 7.39 and a p-value of 0.00, demonstrating that the experimental group (Ge) experienced a significant reduction in the percentage of complaints compared to the control group (Gc). This suggests that BI improved service quality.
The reduction in the percentage of complaints indicates that BI can be an effective solution in sectors where customer satisfaction is crucial, such as retail and tourism. The application of advanced analytical tools would allow for problem anticipation and enhanced user experience. In the long term, the combination of BI with predictive models could further reduce complaints and increase customer loyalty.
6 Conclusions and Future Research
The implementation of Business Intelligence (BI) has proven to be a decisive factor in optimizing freight transportation, as evidenced by significant improvements in operational efficiency, delivery punctuality, and decision-making quality. The results of this study show a notable reduction in the average delivery time, decreasing from 2.35 days (Gc) to 1.86 days (Ge), reflecting an increase in logistics efficiency. Similarly, the number of on-time deliveries increased from 4.93 (Gc) to 6.03 (Ge), demonstrating BI's capacity to enhance logistics planning and reduce delays in freight transportation. In terms of management quality, the percentage of poor decisions was significantly reduced from 36.77% (Gc) to 21.49% (Ge), showing that real-time information access enabled more accurate and data-driven decision-making. Likewise, the percentage of complaints experienced a considerable decrease from 36.77% (Gc) to 21.49% (Ge), reflecting an improvement in service perception and an increase in customer satisfaction. The use of advanced tools such as Power BI facilitated the generation of detailed reports and interactive dashboards, allowing for a clearer analysis of key logistics performance indicators. This not only accelerated the identification of critical areas but also strengthened the ability to make strategic decisions with greater speed and precision. Additionally, the implementation of BI has enhanced the company's competitiveness by optimizing internal processes and offering higher-quality service. These findings confirm that the use of BI in freight transportation not only improves operational efficiency but also lays the foundation for more sustainable logistics management that is adaptable to dynamic environments.
For future research, the application of predictive models and data mining techniques is recommended, as these methodologies would allow for anticipating customer behavior patterns and projecting market changes. The integration of these approaches would enhance strategic decision-making, optimize operational management, and increase competitiveness in the freight transportation sector.

