


 nueva página del texto (beta)
 Inglés (pdf)
 Artículo en XML
 Referencias del artículo
 Enviar artículo por email
 Citado por SciELO
  Similares en
SciELO
Similares en
SciELO 
 Permalink
1 Introduction
The pooled prevalence of depression during the COVID-19 outbreak was estimated at 25%, a staggering seven-fold increase compared to pre-pandemic levels. Young adults, women, and individuals experiencing job loss were particularly affected by heightened anxiety and depression symptoms. While the most acute phase of the pandemic has subsided, the long-term mental health consequences, including depression, continue to be a major concern [14].
Depression is a significant public health concern, especially among young adults. University students, facing academic pressures, social adjustments, and other stressors, are particularly vulnerable. This study aims to explore the application of various clustering algorithms to identify distinct patterns associated with depression among Mexican university students [15].
By analyzing a dataset of university students, including demographic, academic, and psychological factors, we seek to uncover subgroups of students with similar depression profiles. These subgroups may highlight specific risk factors or protective factors that contribute to the development of depression. The findings of this research can inform targeted interventions and support services for university students at risk of depression [14].
Additionally, this study contributes to the growing body of research on the application of data mining techniques in mental health. By comparing the performance of different clustering algorithms, we aim to identify the most effective approach for identifying depression patterns in this specific population [15].
This research is focused on finding the patterns for the depression cases by comparing the symptoms and depression groups in two different times of the semester: beginning and closing.
The structure of this article begins with the related work, where we expose a few articles with a similar research approach to this work. It’s also presented the theory used in the research for this article. The next section presents the results obtained and the evaluation of the same. To end this article we find the conclusions and future work.
2 Related Work
In this section, we will present works that apply different machine learning algorithms to the study of mental health.
The study presented in [11] employs a variety of sophisticated algorithms, including: Deep Neural Networks (DNNs), Support Vector Machines (SVMs) and Unsupervised Learning Models to improve patient outcomes by personalizing treatment plans and enabling early identification of mental health conditions through advanced Artificial Intelligence (AI) methodologies. They find that the integration of AI and deep learning into precision psychiatry holds great promise for revolutionizing the diagnosis and treatment of depression, paving the way for more effective and individualized mental health care solutions.
The work [7] applies four hybrid models combining different feature extraction techniques and classification algorithm to detect signs of depression in Twitter tweets. The model with preprocessing, term frequency-inverse document frequency (TF-IDF), and Logistic Regression achieved the highest accuracy (0.994).
Other study shown in [6] aims to find predictive models of depression in hypertensive older adults using machine learning and metabolomics. Several machine learning techniques are used, including BayesNet and random forests. These two methods were highlighted as the best-performing models, achieving Area Under the Curve (AUC) values greater than 0.9. It results in 19 metabolites by GC-MS (Gas chromatography-mass spectrometry) and 65 metabolites by LC-MS (Liquid chromatography-mass spectrometry) were identified as significant BayesNet and random forests were the best-performing machine learning methods with AUC values greater than 0.934. With this study the conclude that the combination of metabolomics and machine learning shows promise in predicting depression in hypertensive older adults, aiding further clinical research.
In [10] the research is aimed to identify predictive models for depression in hypertensive patients using machine learning and metabolomics. For this, 24 classification methods were used, with random forests and BayesNet. The models were evaluated using metrics such as TPR (True Positive Rate), FPR (False Positive Rate), precision, recall, F-measure, MCC (Matthews Correlation Coefficient), and AUC (Area Under the Curve). The final results of the study highlighted that Random Forest and BayesNet were the top-performing algorithms, achieving AUC values greater than 0.9. Random Forest, in particular, showed the best overall performance with the highest values in TPR and AUC.
A study shown in [9] aims to predict depression risk using a combination of Roman Urdu (a non-structural language) and English (a structural language) by creating a Roman Urdu dataset and merging it with an English dataset. The machine learning models tested include Support Vector Machine (SVM), SVM Radial Basis Function (SVM-RBF), Random Forest (RF), and Bidirectional Encoder Representations from Transformers (BERT). The evaluation is done by using accuracy, precision, recall, and F1 score. The SVM model achieved the best result with an accuracy of 84%. The study highlights the challenges of predicting depression in non-structural languages and the importance of creating datasets for such languages.
The research carried out in [1] compares various machine learning techniques to diagnose clinical depression, using a data set of 134 clinical reports. The techniques evaluated include fuzzy logic, neural network, neuro-fuzzy system, and genetic neuro-fuzzy system. The models were assessed using the confusion matrix, the sensitivity, the specificity, and the classification accuracy. The genetic neuro-fuzzy System achieved the highest accuracy at 95%.
This article has the objective of finding the patterns of depression cases that are present in a student population with the application of unsupervised learning algorithms focused on the clustering problem. Before the theoretical framework and the methodology we will present some investigations to compare the obtained results of our research.
The study [8] used correlation analysis and machine learning to identify factors influencing mental health. Their analysis revealed correlations between weather, physiological data, and mental health states. These findings can improve the accuracy of mental health prediction models.
The research done [17] in develops an automatic method to classify depression levels using unsupervised machine learning. K-means clustering was used for its simplicity and efficiency. Evaluated using accuracy, AUC, sensitivity, and Adjusted Rand Index (ARI). High robustness with an ARI of 0.91 and sensitivity above 90
In the following section we will expose the theory used in this work.
3 Theoretical Framework and Methodology
This section will outline the theoretical framework and methodologies used in our study. We’ll discuss key theories, data collection techniques, analysis methods, and evaluation approaches.
3.1 Depression Symptoms
To analyses the patterns for each depression case, this study applies the CES-D scale that focuses on two types of symptoms: physiological and psychosocial. A sample size of 210 students is sufficient for a depression survey among 3000 students, based on a 95% confidence level and a 5% margin of error. This calculation uses the Yamane formula [16] with a 85% prevalence of depression[5]. The application of the surveys to that sample sizer were authorized by the general lawyer of the university but was not contemplated the application to a same group of students. This means every survey has a different population size and attributes.
The Center for Epidemiological Studies Depression Scale (CES-D) is a self-report questionnaire designed to assess the prevalence of depressive symptoms. While it is a valuable tool, interpreting its results requires careful consideration. First, the total score is calculated by summing the responses to all items. A higher score indicates a greater severity of the depressive symptoms.
There is no universal cut-off point for diagnosing depression.
The specific threshold can vary depending on the population studied and the diagnostic criteria used. Individuals are often categorized into groups based on their total score, such as ”no depressive symptoms”, ”mild depressive symptoms,” ”moderate depressive symptoms,” and ”severe depressive symptoms”.
The CES-D scale is a tool that consists of a set of questions that explore how a patient has felt for a specific amount of time. Each question assesses the frequency in days with which the person has experienced certain symptoms associated with depression, such as sadness, lack of interest, difficulty sleeping, or changes in appetite.
Symptoms are measured over different time periods of days, and for all symptoms there is a simple question to answer How many days have you felt the x symptom? Then for every period of days there is a numeric value in a range from 0 to 4. This equivalence is presented in table 1 [12].
Table 1 CES-D Scale values
| Scale value | Symptom presence |
| 0 | 0 to 1 days |
| 1 | 1 to 2 days |
| 2 | 3 to 4 days |
| 3 | 5 to 7 days |
| 4 | 10 to 14 days |
The answers to these questions are scored and added up to obtain a total score. This score is compared to established criteria to determine if the person has a level of depressive symptoms that could indicate the presence of a depressive disorder [5].
3.2 Symptoms
The symptoms described in the CES-D scale [13] can be separated into two categories: Psycho-social and Physiological. Each category and their belonging symptoms is described in table 2.
Table 2 Symptoms tables
| Type of Symptom | Description | Symptoms |
| Psycho-social | This type of symptoms are shown in the social and psy-chological behavior of the patient. | Sadness, Stress, Easy Anger, Less talk, Fearful, Feeling of Failure, Unpleasant, Lose of Focus |
| Physiological | These symptoms are related to the physical feeling of the body of the patient. | Sturdyness, Slow moves, Insomnia, Weight loss |
3.3 Application of Surveys
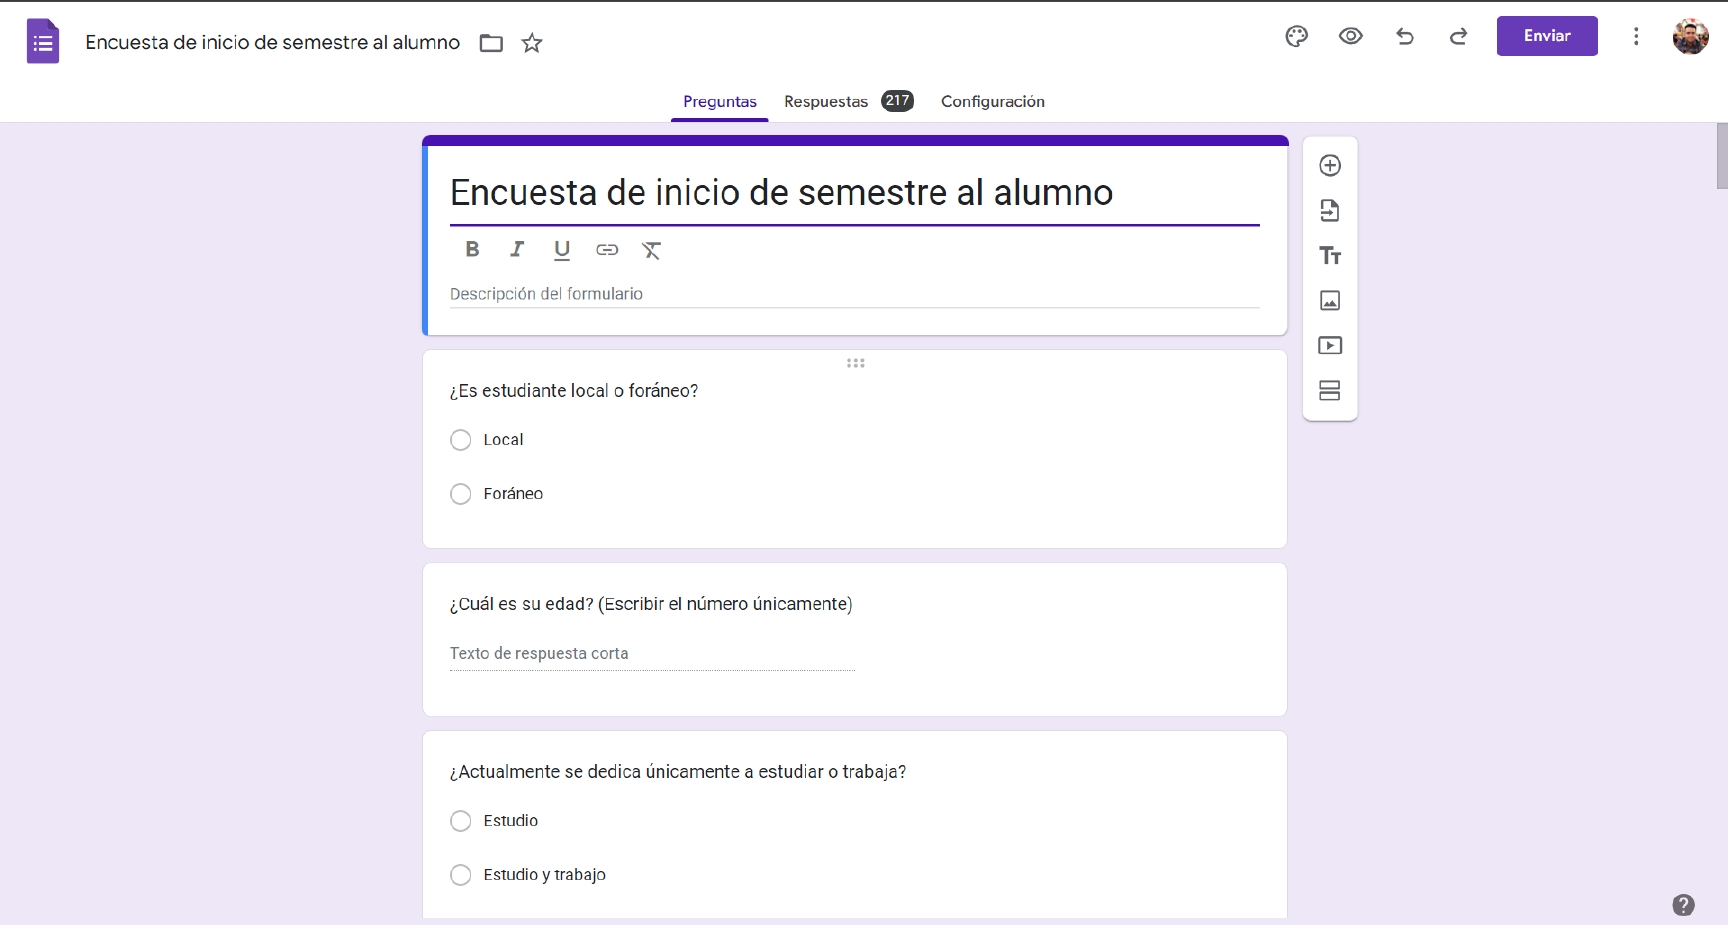
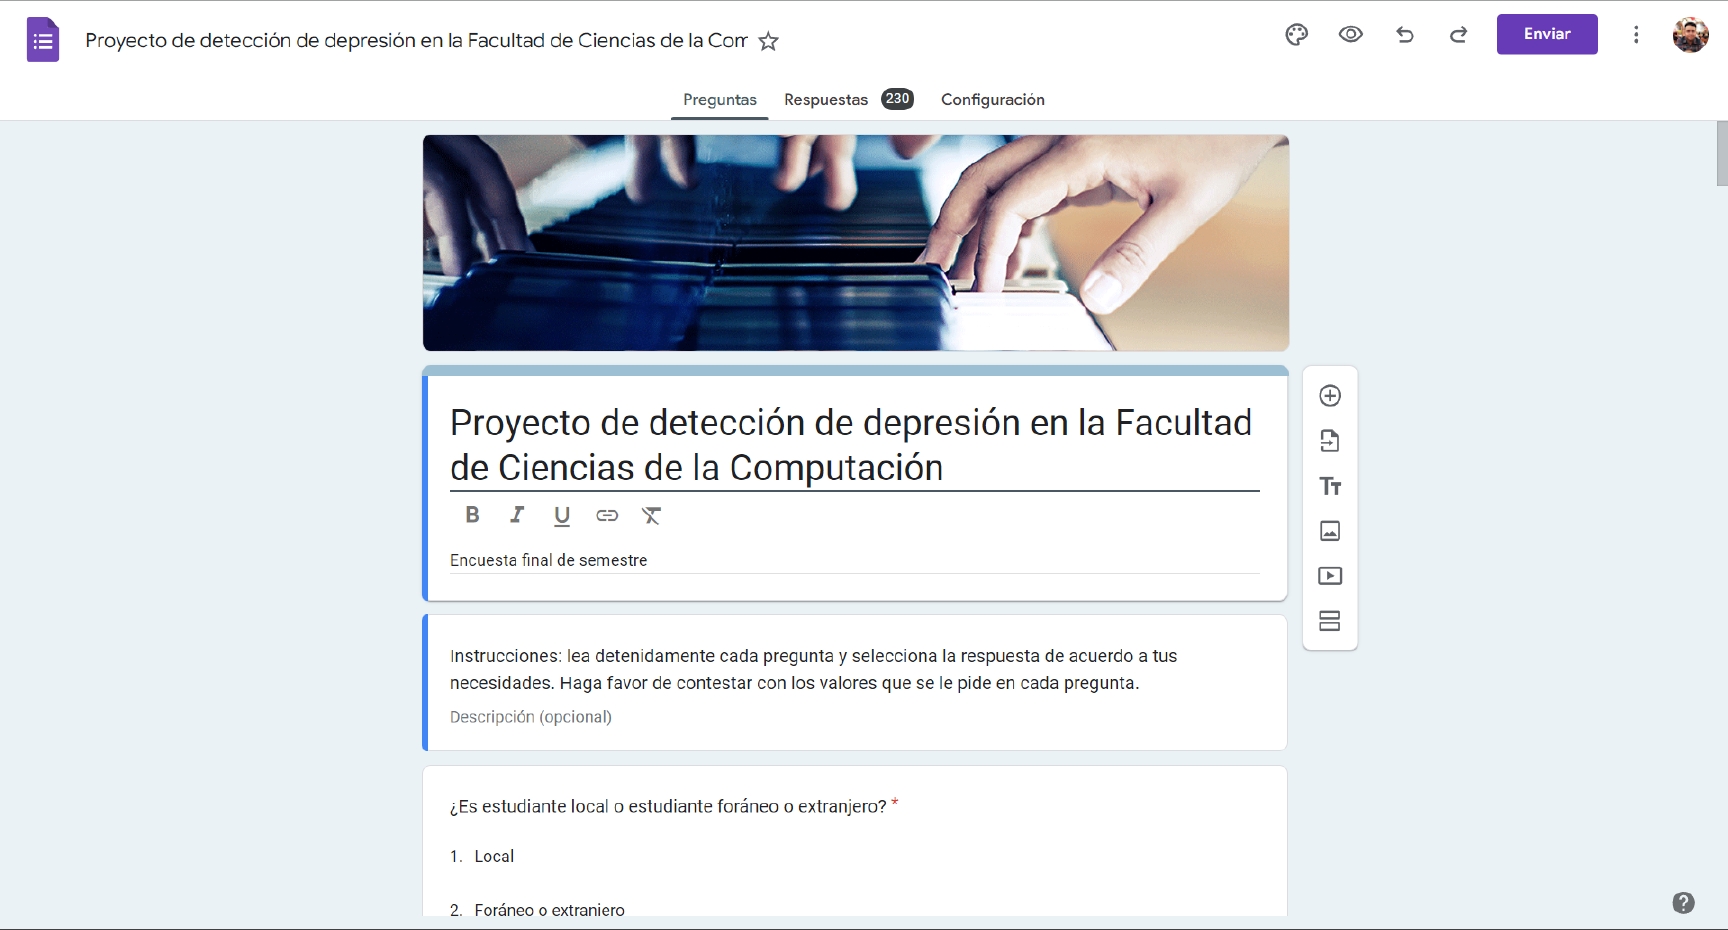
A series of surveys were created in the free software tool Google Forms, which allowed the easy extraction and storage of the gathered data.
Once obtained the minimum amount of registers, for this research is 210, we proceeded to the process of data cleaning an data wrangling, where some outliers were eliminated and filled with data normalization techniques using statistical measures, specifically, the average of age and grade point average (GPA).
In this study unsupervised learning algorithms will be applied to data that will be gathered from the application of two surveys presented in this section, both have the same questions that include the CES-D scale (figures 1 and 2)
3.3.1 Unsupervised Learning Algorithms
The main task of this work is to apply clustering algorithms that form part of the unsupervised learning algorithms.
Clustering is a machine learning technique that groups similar data points together. This grouping can be used for various purposes, such as customer segmentation, image compression, and anomaly detection. The clustering algorithms applied in this study are: K -Means, AGNES and DKM (Differential K -Means Neural Network)
K-Means Clustering: This algorithm initializes K centroids, then randomly select K points from the dataset as initial centroids. The next step is to assign each data point to the nearest centroid and calculate the new centroids as the mean of the data points assigned to each cluster. This process is repeated until the centroids converge or a maximum number of iterations is reached [4].
AGNES (Agglomerative Nested Nesting): It starts with each data point as a cluster, which means, each data point initially forms its own cluster. Then find the two closest clusters and merge them into a single cluster. The process continues by merging clusters until a single cluster remains [2].
DKM (Differential K -Means Neural Network):
This algorithm identifies data points that have a minimum number of neighbors within a specified radius. It expands the cluster from a core point by including neighboring points that are also core points or have a core point as a neighbor. One of its advantages is that is capable to find points that are not part of any cluster which are considered outliers.
The best clustering algorithm for a given problem depends on various factors, such as the shape and size of the clusters, the presence of noise and outliers, and the computational resources available. It’s often beneficial to experiment with different algorithms and evaluate their performance using appropriate metrics. In this work the Silhouette Coefficient and Davies-Bouldin index will be used [3].
3.3.2 Algorithm Evaluation
Silhouette Coefficient: The Silhouette Coefficient is a measure of how similar an object is to its own cluster (cohesion) compared to other clusters (separation). It ranges from -1 to 1.
A high value (near 1) indicates that the object is well matched to its own cluster and poorly matched to neighboring clusters. A value near 0 means the object lies between two clusters. A negative value indicates that the object may have been assigned to the wrong cluster.
It takes the average distance between a sample and all other data points in the same cluster a and the average distance between a sample and all other data points in the nearest cluster b.
We define the Silhouette Coefficient with equation 1:
In essence, the silhouette coefficient provides a measure of how well-defined the clusters are.
Davies-Bouldin Index: The Davies-Bouldin Index is another metric used to evaluate the clustering quality. It measures the average similarity of each cluster with its most similar cluster. A lower Davies-Bouldin index indicates better clustering. How it’s calculated is shown in equation 2:
— It begins by calculating the average distance between each data point and the centroid of its cluster,
— For each cluster, find the most similar cluster (based on the average distance between their centroids),
— The calculate the ratio of the within-cluster dispersion to the between-cluster separation for each cluster pair,
— The last step is to compute the average of these ratios over all clusters.
In simpler terms, the Davies-Bouldin Index measures how well separated the clusters are and how similar the data points within a cluster are.
These metrics are used to:
— Evaluate the quality of different clustering al-gorithms,
— Determine the optimal number of clusters (e.g., in K -means clustering),
— Compare different clustering results.
All the required theory for this investigation has been exposed in this section, in the following sections will present the results and analysis of the obtained dataset.
4 Results
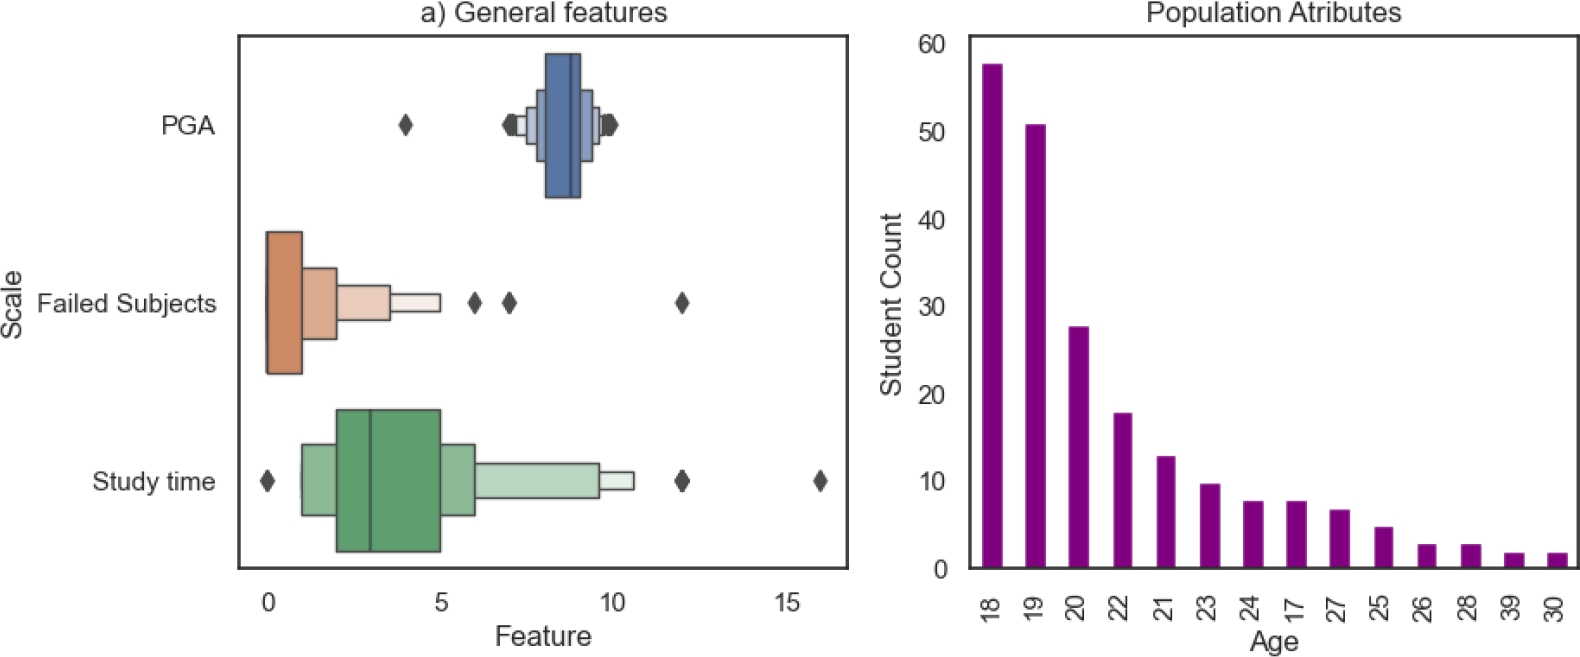
This section presents the results obtained from the statistical analysis of the symptoms and the general population attributes which are age, GPA, study time and amount of failed subjects.
Finally, the last subsections show the groups created by the clustering algorithms and the evaluation of each model.
4.1 Beginning of Semester
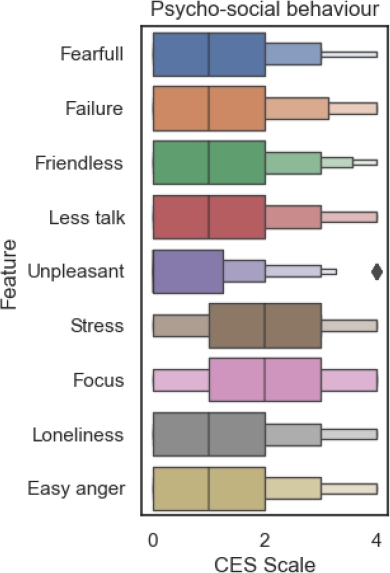
For the beginning of the semester is expected for the social symptoms to belong in lower values of the CES-D scale, this means, in a boxen plot the first quartile must be concentrated in values from 0 to 2.
4.1.1 Symptom Analysis
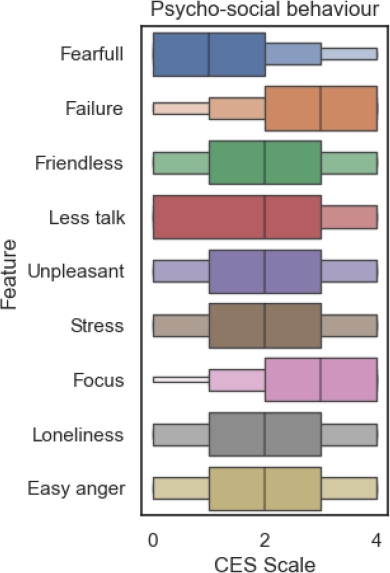
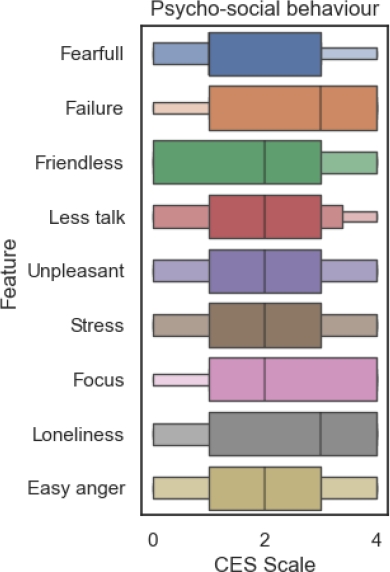
As mentioned in section 4 for the statistical analysis this work focuses on the behavior of the physiological and psycho-social symptoms. In figure 3 can be observed that most of psycho-social symptoms are concentrated in the lower values of the CES-D scale, the only ones with different scale values are Stress and Lose of Focus.
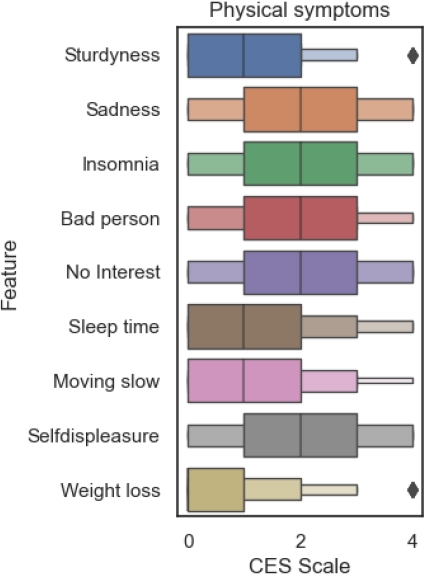
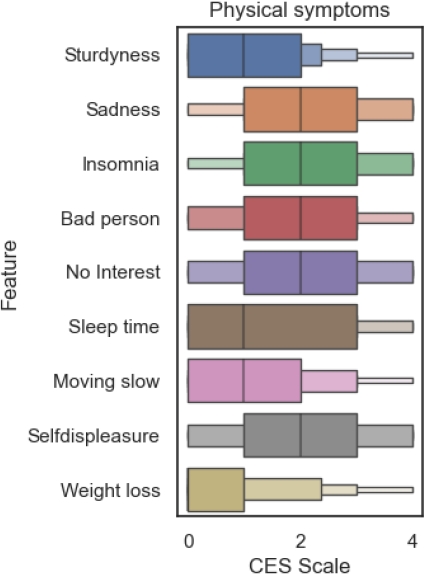
The analysis of physiological symptoms (figure 4) shows that Insomnia is more concentrated from 1 to 3 in the CES-D scale.
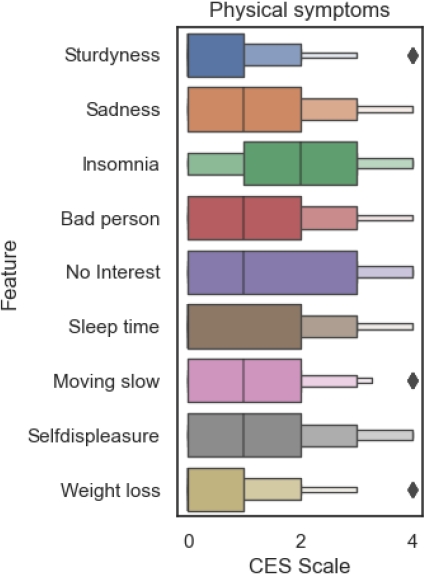
With this analysis of both type of symptoms it can be observed that stress, lose of focus and insomnia are the most important attributes for the clustering process.
The general attributes of the population in figure 5 show that most of the population belongs to a range of age from 18 to 20 years, which are the part of the population changing from middle school to college. This can be a key hypothesis for a future work.
4.2 Intermediate of Semester
The data gathered in the intermediate part of the semester shows the evolution of the symptoms but also gives us and idea of which symptoms are more correlated to the patterns of the future clusters. In this subsection will be presented the analysis of both categories of symptoms and the general attributes of the population.
4.2.1 Symptom Analysis
In figure 6 it can be observed that all of the psycho-social symptoms have moved on the scales values. The symptoms with greater increase over the CES-D scale where the feeling of failure and the lose of focus. This can tell us that with passing of time, the assigning of homework, dedication to study and other academic activities have a bigger footprint in the mental health during this part of the semester.
After seeing the evolution of the psycho-social in the intermediate part of the semester it’s turn for the physiological symptoms.
The boxen plot shown in figure 7 presents a great transition in the CES-D scale for the sadness, feeling to be a bad person and no interest in personal activities symptoms. Both symptoms can be related to how the psycho-social symptoms have evolved in figure 6 due to their relationship with the personal behavior of a student.
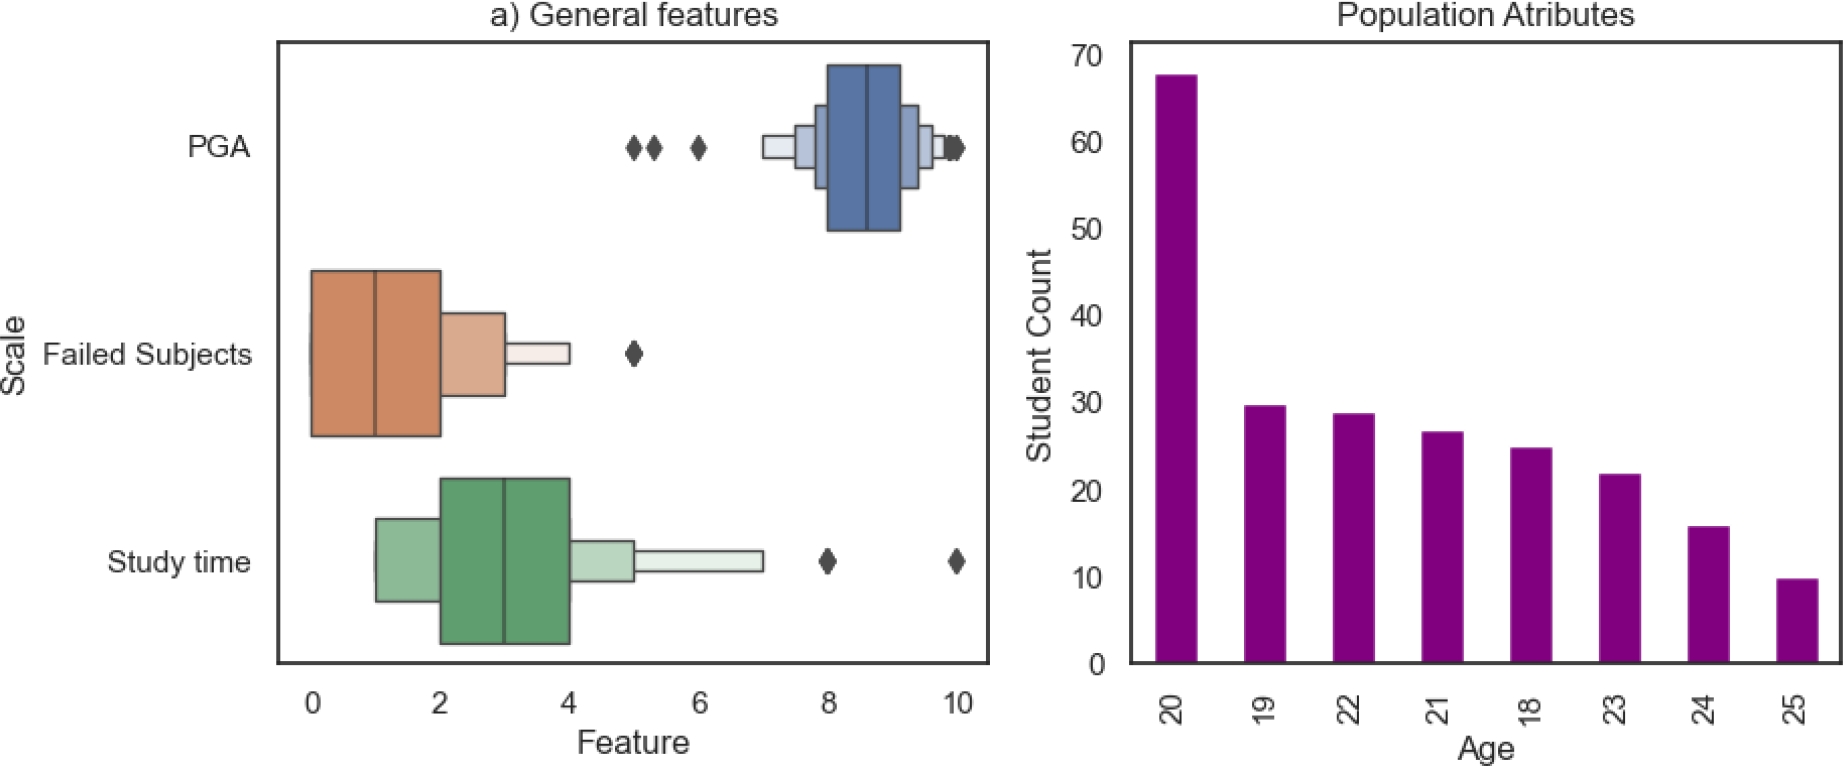
In this part of the semester we observe how the population average age has moved from the range of 18 to 20 years to being mostly dominated from students with 20 years old (figure 8), while the other attributes keep a similar behavior to the one presented at the beginning of semester in section 4.1.
4.3 Closing of Semester
To observe the evolution of cases, there must be a comparison between two parts of the semester: the beginning, where students have a light work load, and the closing, where work is at full. In this section the analysis of gathered data in this part of the semester is shown.
4.3.1 Symptom Analysis
In section 4.1.1 we discussed how stress, lose of focus and insomnia where the symptoms with greater values over the CES-D scale at the beginning of semester.
The figure 9 presents an evolution in all the pyscho-social symptoms, once again lose of focus appears as a strong reference to depression, it is also added the loneliness feeling symptom to the highly scaled symptoms.
At the closing of semester the physiological symptoms (figure 10) present a huge increment in the CES-D scales values, insomnia remains on the higher values of the scale, but the sadness, feeling as a bad person, no interest in personal activities and self displeasure symptoms start to locate in the same range.
The general attributes of the population in the closing of semester don’t have a great change as seen in figure 11.
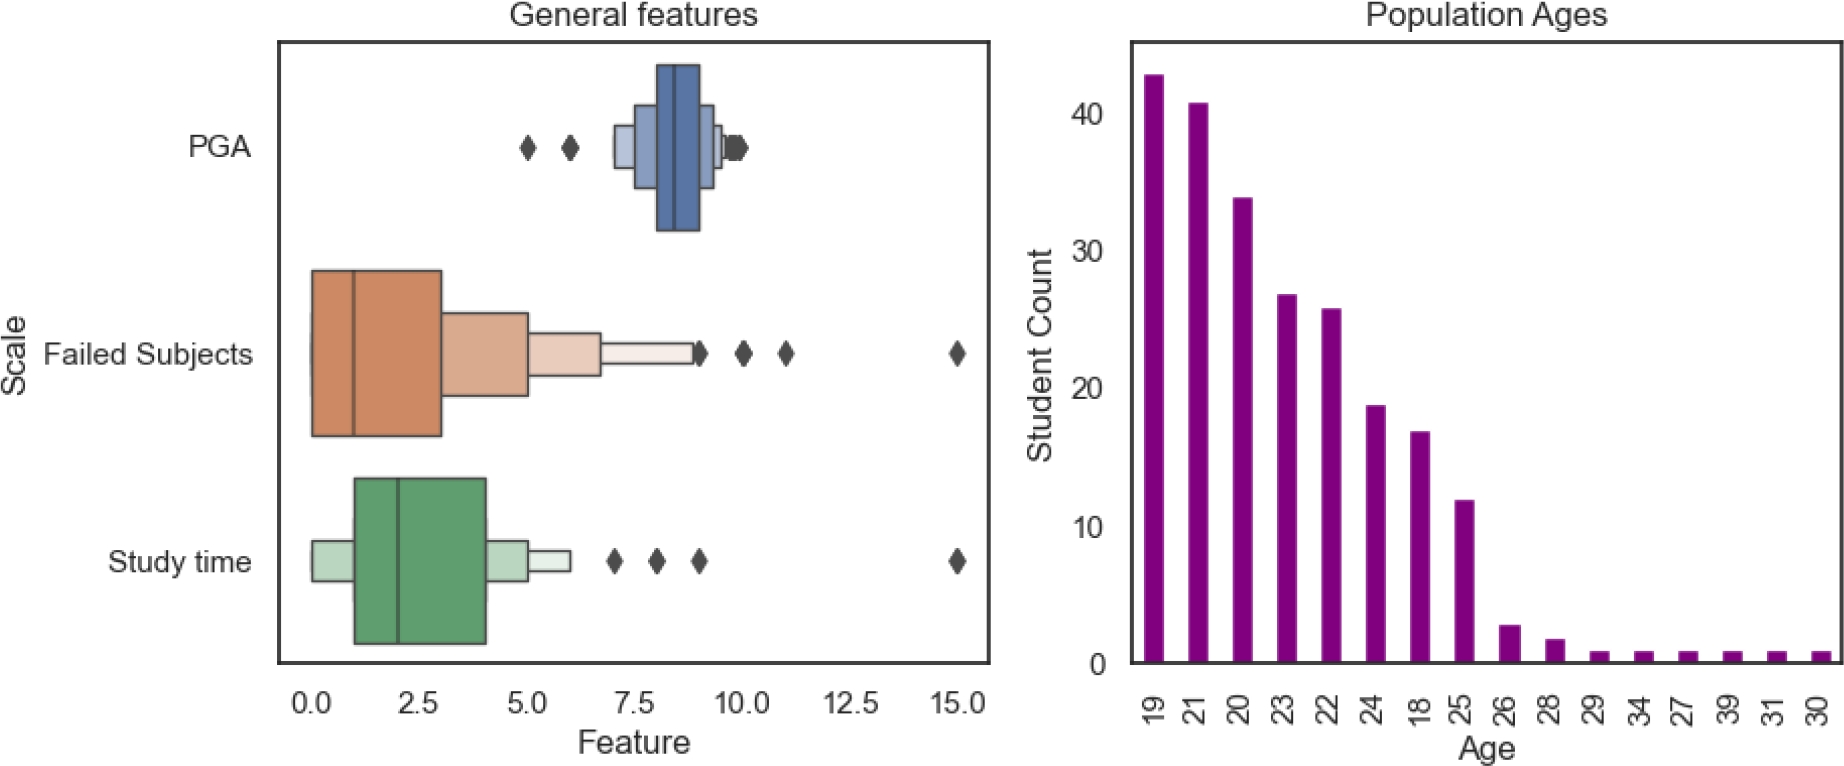
The population’s average age is still found in the range of 18 to 20 years old, the same as observed in figure 5 if observable for the other attributes in the closing of the semester.
4.4 Cluster Comparison
We present the results of the application of the clustering algorithms with bar plots, shown in figure 12.
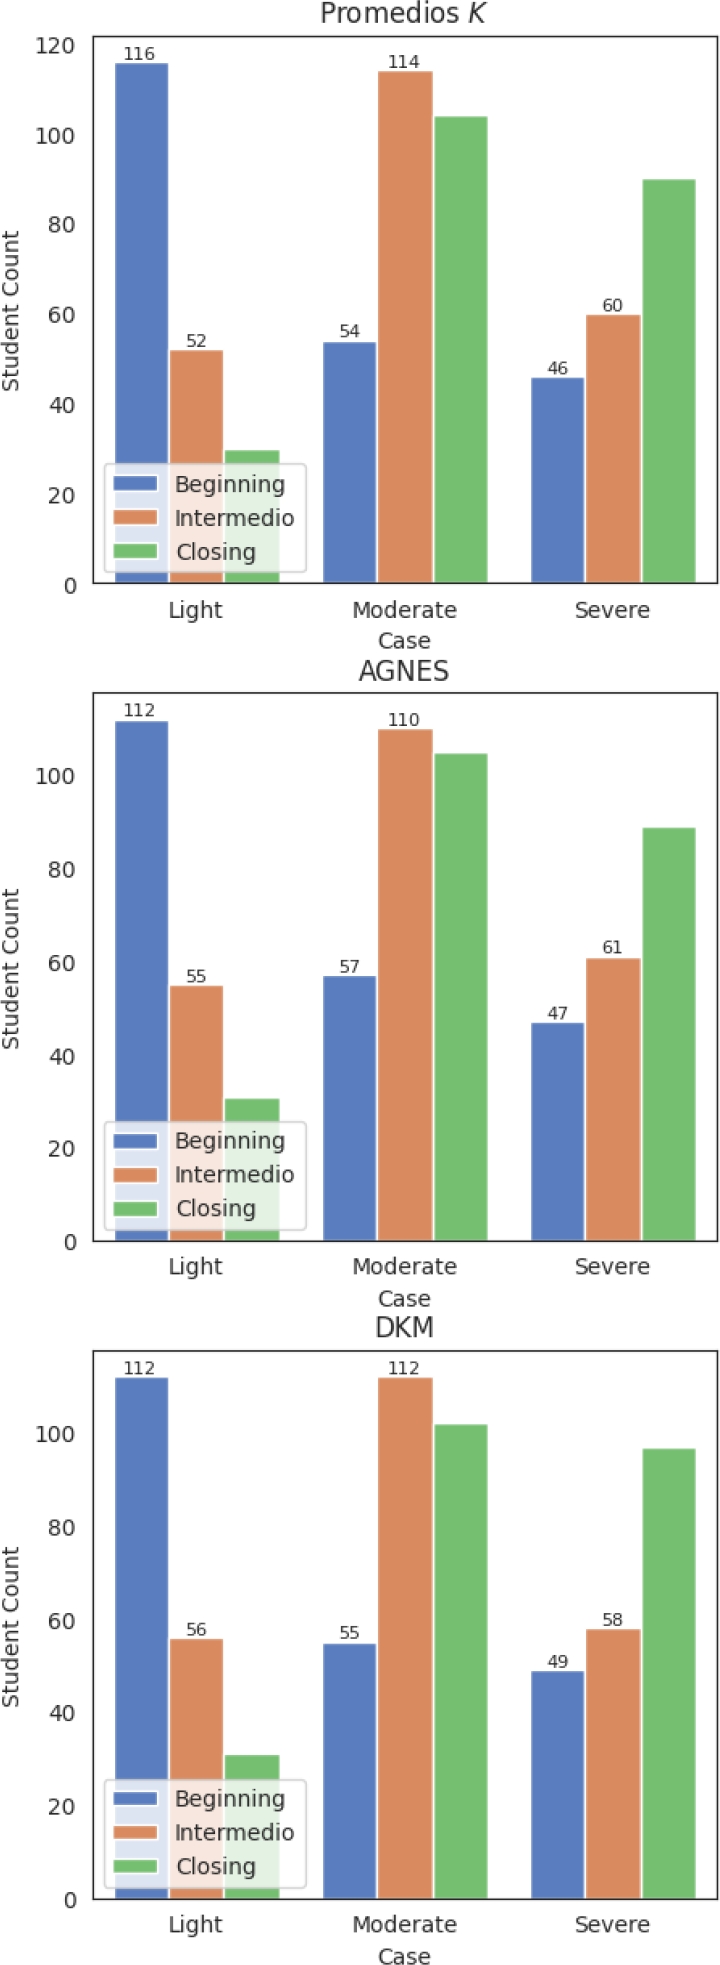
Population sizes for all three algorithms evolved over the semester. Moderated depression had the largest population at the end, while severe depression cases significantly increased.
The clusters have already been created, but it’s required to evaluate the models used in this research, in the following section it’s presented the values of the Silhouette Coefficient and the Davies-Bouldin Index of the three algorithms.
4.5 Model Evaluation
In section 3.3.2 we explained how both exposed metrics work and how are obtained. In this section we will present the results of the metrics exposed in 3.3.2 which are Silhouette Coefficient and Davies-Bouldin Index.
Table 3 presents the values obtained from the Silhouette coefficient metric, the nearer to 1 is the value, the better.
Table 3 Silhouette coefficient values
| Part | Agnes | K -means | DKM |
| Beginning of semester | 0.6205 | 0.5912 | 0.6041 |
| Middle of semester | 0.6721 | 0.6399 | 0.6790 |
| Closing of semester | 0.67 | 0.654 | 0.6809 |
It can be observed a great performance by AGNES and DKM algorithms, both have metric values greater than 0.5 and lower than 1, it’s something good because we are not having any over fitting problem.
Table 4 shows the Davies-Bouldin (DB) values of the created clusters. In this case we wanted to have this values in a range from 0 to 1. The behavior of this values tell us that the better clusters were created by the K -means algorithm, opposite to the silhoutte coefficient.
Table 4 Davies-Bouldin Values
| Part | Agnes | K -means | DKM |
| Beginning of semester | 0.2530 | 0.2902 | 0.2561 |
| Middle of semester | 0.2706 | 0.3110 | 0.2681 |
| Closing of semester | 0.2517 | 0.2761 | 0.2421 |
In this next section we will present the conclusions and some points to improve for a future work.
5 Conclusion and Future Work
The proposed unsupervised learning models identified depression patterns among Mexican university students based on demographics, academics, and psychology. Stress, loss of focus, and insomnia were key indicators. Clustering algorithms proved effective for mental health research. This study advances machine learning in mental health and suggests targeted interventions for at-risk students.
The strengths and limitations of this investigation are presented in a live application, this can be a great tool but it can be used in a different way of it was created for. In a future work we want to study the patterns with active data, i.e., we want to develop a model with an specific user interface that allows for a live observation of the depression cases of each student and aid them when they are in lighter cases.

