


 nueva página del texto (beta)
 Inglés (pdf)
 Artículo en XML
 Referencias del artículo
 Enviar artículo por email
 Citado por SciELO
  Similares en
SciELO
Similares en
SciELO 
 Permalink
1 Introduction
LR occurs when abnormal leukocytes invade the retina, causing multiple retinal manifestations, including Microaneurysms (MA), Foveal infiltrates (FI), Cotton wool spots (EX), Roth spots (RS) and HE [20, 3].
Beyond the clinical manifestations, early signs of LR in leukemic patients frequently emerge before symptoms become apparent in other parts of the body. Therefore, early detection through regular ophthalmic exams and retinal image analysis is crucial for timely diagnosis and treatment of leukemia. In this context, the use of advanced techniques such as deep learning for the automated classification of retinal images emerges as a powerful tool, significantly improving the accuracy and speed of disease detection. However, to date, only one study has focused on the detection of LR, primarily addressing the classification of the disease [14], highlighting the need for further research in this area.
This article focuses on the automated detection of lesions in LR. The ability to identify lesions in retinal images is essential, and the use of deep learning models, such as those based on YOLO [15], enable these detections. This automated approach not only optimizes analysis time but also, reduces the possibility of human error, providing more consistent and reliable results.
The use of intelligence models for detecting lesions, faces significant challenges becuse of the lack of an adequate quantity of accurately labeled images. Manual labeling by experts is an arduous and costly process that requires high specialization. In addition, collaboration among experts is often limited by availability and time, further complicating the creation of robust datasets. Here is where tools like the SAM [8] can play a crucial role, enabling automatic labeling that facilitates the process and making it more accessible to the research community.
To overcome these challenges, techniques such as TL and DTL are presented as effective solutions. These techniques allow leveraging pre-trained models in related domains, such as diabetic retinopathy (DR), to transfer that knowledge to LR, thereby optimizing results despite the limitation of images. In this context, the combined use of YOLO for object detection and SAM for automatic labeling is further enhanced, creating a workflow that maximizes efficiency and accuracy in the automated diagnosis of this disease.
The main contributions of this research are:
— To implement an automatic labeling method using a pre-trained YOLO model on the DR dataset, in combination with SAM.
— To propose an innovative procedure that lever-ages the knowledge gained from previously segmented elements in DR images adapting it to LR.
— To introduce an approach using deep learning techniques for segmentation of lesions in fundus images associated with LR.
This article is structured as follows: Section 2 describes related work in lesion detection, with a particular focus on DR. Section 3 details the utilized methodology, explaining the knowledge transfer approach between related diseases, as well as the models used, such as the YOLO model and the SAM model, along with the performance metrics employed. Section 4 provides detailed information on the databases used. Section 5 presents the experiments performed, the results obtained and their corresponding discussion, while Section 6 discusses the conclusions and states possible directions for future research.
2 Related Work
This section provides an overview of different studies for the detection of lesions associated with DR using YOLO. Firstly, [19] proposed a model based on YOLOv8, integrated with the Jetson Nano development kit and a CSI camera module, for real-time detection of retinal lesions; this model achieved a top1 accuracy of 93.77 % in the training dataset and 72.6% in the validation dataset. On the other hand, [23] focused on the detection of MA, proposing an automatic model based on YOLOv8. The results were 88.23 % in recall, 97.98 % in precision, 92.85 % in F1-score and 94.62 % in Average Precision (AP).
In [17] they focused on fundus lesion detection using YOLOv5, using the DDR and IDRiD datasets. On the DDR dataset, the model achieved a mean Average Precision (mAP) of 0.2630 and F1-score of 0.3485 in the validation stage, and a mAP of 0.1540 and F1-score of 0.2521 in the test stage.
For their part, [6] used an enhanced version of YOLOv4 with integrated SENet. The Kaggle dataset on DR was used to validate the model. Experimental results showed a 12.68% increase in F-score.
Finally, [1] propose a YOLOv3-based system for detection and localization of DR lesions. The model achieved a mAP of 0.216 in lesion localization in the DDR dataset.
A comparison of YOLO models and labeling methods used for lesion detection in retinopathy is presented in Table 1. The ’Author/Year’ column lists the articles reviewed, including author and year of publication. The YOLO models used in these studies range from YOLO v3 to YOLO v8, all applied to detection of DR.
In all previous studies, manual labeling of images was employed to identify lesions. In contrast, the proposed approach uses a variant of the YOLO v8-obb model, which applies DTL for detection in both DR and LR . In addition, the SAM model is used to perform automatic annotation.
3 Methodology
3.1 Proposed DTL Semantic Segmentation Model
The methodology proposed in this work follows a DTL approach for lesion detection in LR, leveraging knowledge acquired from DR.
As illustrated in Figure 1, this process begins with automatic label generation, where the SAM, previously trained on DR, generates automatic lesion masks for both datasets (DR and LR). This method allows label creation without manual intervention, which is especially useful in scenarios where expert labeling is limited.
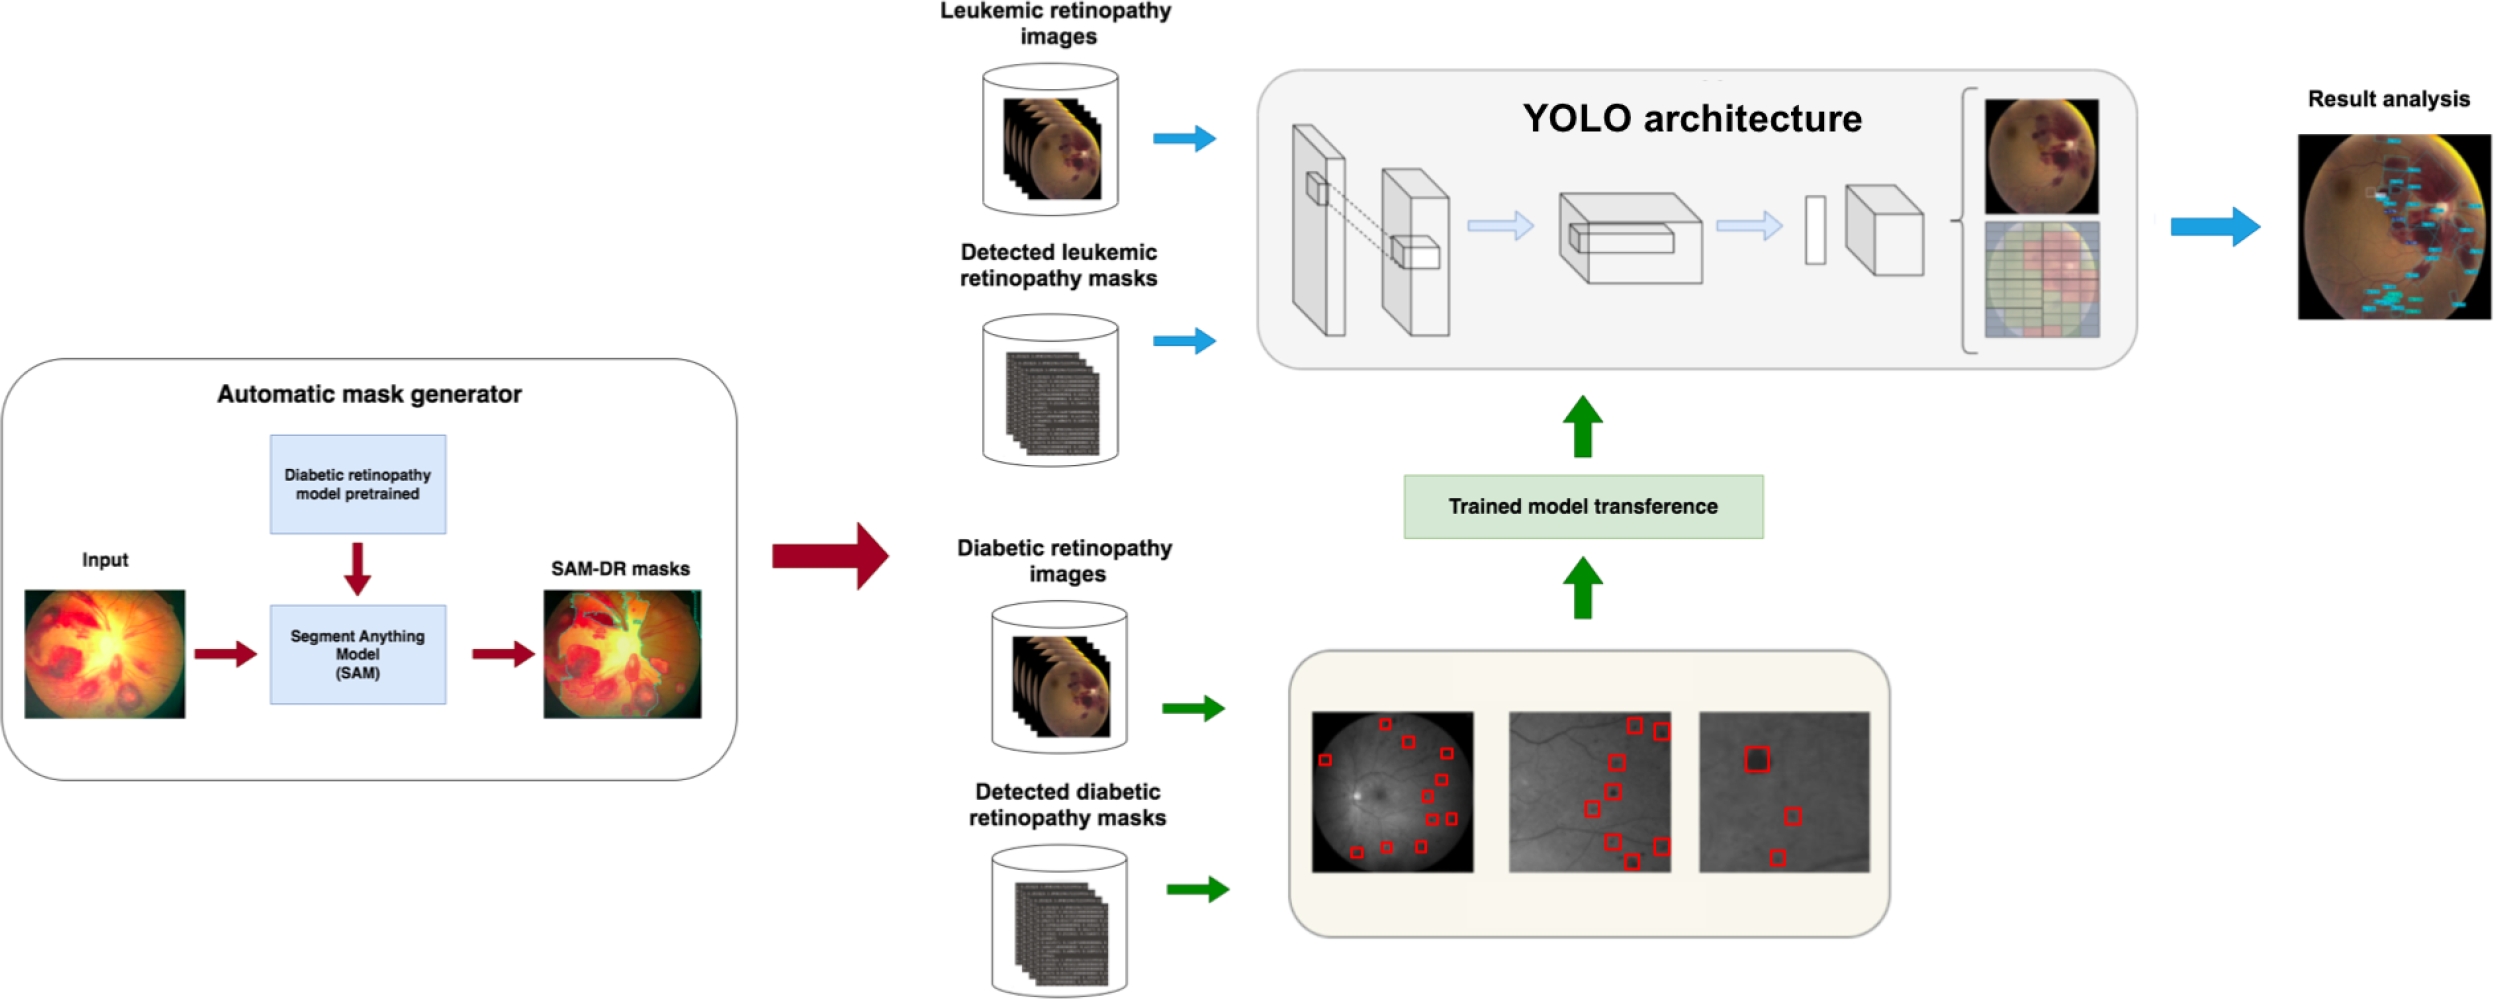
Next, the YOLO architecture is trained using DR images and their automatically generated labels by SAM to learn relevant features of retinopathy lesions. This model serves as a foundation for knowledge transfer, capturing patterns that could be shared between the two pathologies. The YOLO model trained on DR is then adapted to a new YOLO architecture specifically designed for lesion detection in LR images.
Subsequently, this second modified YOLO architecture is trained with LR images and their SAM-generated labels, leveraging the knowledge transferred from DR. Finally, the final model is used to detect and analyze lesions in LR images.
This DTL approach improves accuracy in lesion segmentation and optimizes the use of limited data, making it a valuable solution in medical contexts where manual labeling is scarce.
3.2 YOLO Model
YOLO is an object detection model that reformulates the problem as a regression task to directly predict bounding boxes and class probabilities from a single evaluation of the entire image. Unlike previous approaches that repurpose classifiers to perform detection, YOLO employs a unified neural network that predicts bounding boxes for each class.
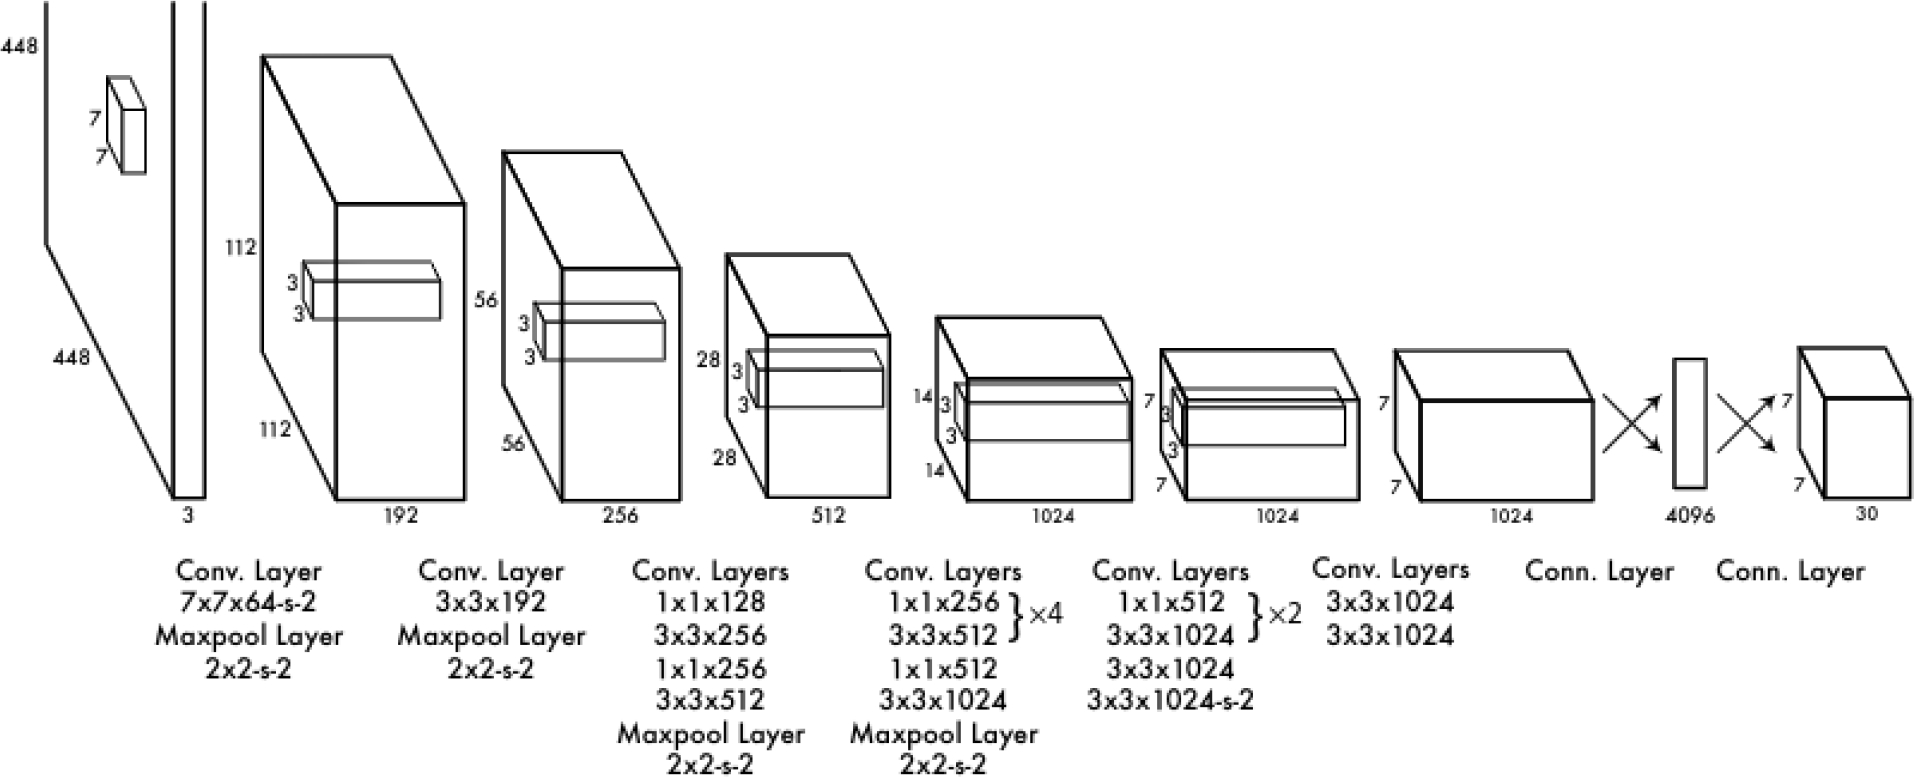
The YOLOv1 architecture consists of 24 convolutional layers followed by two fully connected layers, as illustrated in Figure 2. The authors originally designed the network by using the first 20 convolutional layers as the backbone. They then added an average pooling layer and a fully connected layer, and pre-trained the model on the ImageNet 2012 dataset. During the inference process, the final four convolutional layers and the two additional fully connected layers were integrated and randomly initialized. This configuration allowed YOLOv1 to maintain a balance between speed and accuracy in object detection, standing out as a fast and efficient approach in its field.
YOLO has evolved significantly since its first version, with each iteration introducing improvements in accuracy, efficiency, and functionality. From YOLOv2, which incorporated batch normalization and anchor boxes, to YOLOv10, which eliminates the need for Non-Maximum Suppression, each version has expanded the model’s capabilities. YOLOv8, developed by Ultralytics, stands out for its versatility, supporting a wide range of computer vision tasks. YOLOv9 introduced new methods such as Programmable Gradient Information (PGI) and the Generalized Efficient Layer Aggregation Network (GELAN). Finally, YOLOv10, created by researchers from Tsinghua University, advanced real-time object detection with an end-to-end head that eliminates the need for Non-Maximum Suppression (NMS) [21].
On the other hand, object detection is a task that involves identifying the location and class of objects in an image or video sequence. The output of an object detector is a set of bounding boxes that enclose the objects in the image, along with class labels and confidence scores for each box.
In the Oriented Bounding Boxes (OBB) version of YOLO, object detection goes a step further by introducing an additional angle that allows a more precise localization of objects. This is achieved through rotated bounding boxes that precisely enclose objects in the image, providing class labels and confidence scores for each box. This version is ideal when it is necessary to identify objects of interest in a scene with greater accuracy in their orientation.
3.3 SAM Model
SAM [8], is an advanced image segmentation model designed to perform real-time segmentation by integrating computer vision techniques and transformer-based neural networks. The process begins with the image encoder, which uses a pre-trained Vision Transformer (ViT) to transform a high-resolution image into an embedding, i.e., a compact numerical representation of the image. This embedding represents a reduced version of the original image, with a resolution of 64 x 64 pixels and 256 channels, allowing the model to operate more efficiently since this processing is done only once per image.
The model also includes a prompt encoder, responsible for processing the prompts that guide the model in the segmentation task. These prompts can be specific points in the image, bounding boxes, or even text-based instructions. Each type of prompt is encoded in a particular way, enabling the model to understand and effectively use both geometric and contextual information.
The mask decoder is the component responsible for generating a segmentation mask from the image embedding and the prompt embeddings, as shown in Figure 3. This decoder is based on a modified transformer that performs multiple stages of attention, both self and cross, between the prompts and the image embedding.
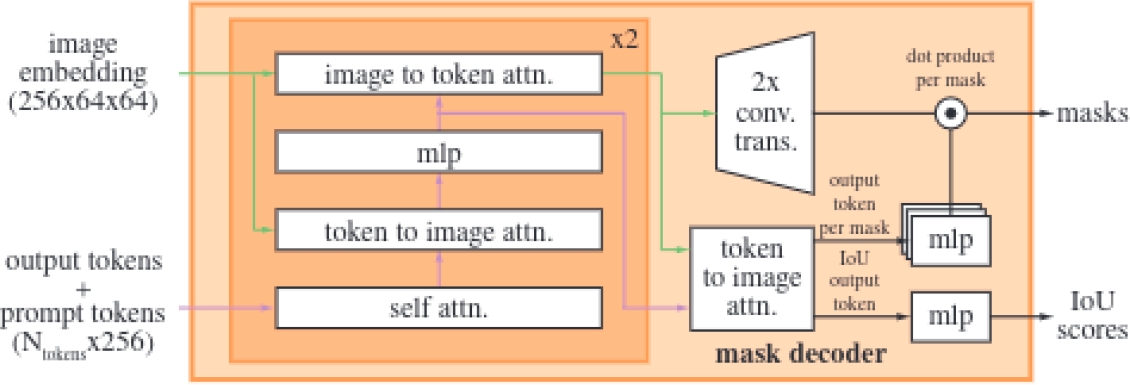
Specifically, the lightweight mask decoder uses a two-layer design where each performs a cycle of operations, including self-attention on the tokens, cross-attention between the tokens and the image embedding, and updates via Multilayer Perceptron (MLP).
After processing these operations, the image embedding is upscaled using transposed convolutions to increase its resolution, facilitating the precise generation of the final masks through a pointwise product between the image embedding and the MLP output.
This approach also allows the decoder to handle ambiguity in predictions; when a single prompt generates multiple valid outcomes, the model predicts several masks simultaneously, selecting the most accurate one. However, when multiple prompts are used, the model simplifies the prediction to a single mask to avoid redundant results.
Finally, SAM improves the accuracy of the predicted masks by combining two loss functions: focal loss and dice loss. In addition, it incorporates an Intersection Over Union (IoU) prediction head, which allows to measure how accurately the predicted mask covers the real object in the image.
3.4 Labeling of LR Images
This section describes the process of automatic labeling of LR images using two approaches based on the SAM model.
SAM: First, image labeling was performed using the weights of a YOLO model previously trained on the COCO dataset. This automatic annotation process was performed by specifying the location of the images [8]. This approach uses the YOLO model to detect regions of interest in the images, while SAM takes care of segmenting these regions, thus generating the necessary labels for the dataset.
SAM-DR: Subsequently, an enhanced automatic annotation process was implemented to generate segmentation datasets with higher accuracy. In this version, a pre-trained detection model specifically tuned for DR images was used. This process was carried out by specifying the location of the images, along with the pre-trained detection model and the SAM model [8].
In this case, combining the pre-trained detection model with SAM not only improves the accuracy of the generated labels, but also optimizes the process of creating datasets for more specific segmentation tasks.
Manual Labeling: For manual labeling of the images, the Roboflow [9] platform was used, selected for its intuitive interface and tools that facilitate the process of annotating and exporting the images.
3.5 Performance Metrics
Intersection over Union (IoU): IoU is a metric that quantifies the overlap between a predicted bounding box and an actual bounding box, as shown in Equation 1. It is defined as the ratio of the area of the intersection to the area of the union of the two boxes:
Average Precision (AP): AP calculates the area under the precision-recall curve, providing a single value that reflects the model’s performance in terms of precision and recall. It can be expressed as in Equation 2:
where
mean Average Precision (mAP50): mAP50 refers to the mean Average Precision at an IoU threshold of 50%. This metric evaluates how well the model’s predictions match the ground truth when a predicted bounding box overlaps with the actual object by at least 50%.
mAP50-95: mAP50-95 represents the mean Average Precision calculated across multiple IoU thresholds, specifically from 50% to 95% in increments of 5%. This metric provides a more comprehensive evaluation of the model’s performance by considering a range of overlap levels between predicted and ground truth bounding boxes.
Precision and Recall: They are fundamental metrics in the evaluation of classification models, as shown in Equation 3. Precision quantifies the proportion of true positives among all positive predictions and is defined as:
The recall measures the proportion of true positives among all actual positives and is calculated as in Equation 4:
F1-score: The F1-score is the harmonic mean of precision and recall, providing a balanced metric that takes into account both false positives and false negatives, as shown in Equation 5:
This metric is ideal for achieving a balance between precision and recall when assessing the model’s effectiveness.
4 Dataset Description and Attributes
4.1 DR and LR Datasets
During the first stage, which required training the model with images of DR, a dataset of ocular lesions, labeled through the Roboflow portal [16], was used. This dataset was composed of a total of 3,930 images, distributed into 3,624 images for training, 154 images for validation, and 152 images for testing. Each image was 640 x 640 pixels in size and the labels corresponded to four classes of lesions: EX, HE, MA and SE, as shown in Figure 4.
Regarding LR images, a comprehensive review was conducted across various sources, such as medical journals and websites, with the aim of identifying representative images of this condition. As a result of this search, 49 images were selected from various specialized sources on this arrangement [7, 18, 20, 12, 13, 10, 11, 2, 5, 4, 22].
4.2 Lesion Morphology in LR
The morphology of retinal lesions is crucial for the diagnosis of diabetic and leukemic retinopathies, including HE, MA, EX, RS, and FI.
HE are bleeding areas within the retina that appear as dark red or brown spots with variable shapes and sizes. On the other hand, EX are deposits of lipids and proteins that appear as yellow spots with well-defined edges, usually associated with MA and macular edema. MA are small dilations of retinal capillaries, visible as well-defined red dots, and are often the first sign of vascular damage in the retina.
RS are hemorrhagic spots with a pale white center, formed by fibrinous material or cellular debris, and are associated with conditions such as leukemia. Finally, FI are accumulations of inflammatory cells or deposits in the fovea, appearing as opaque or gray areas, affecting high-resolution vision.
5 Experiments and Results
5.1 Knowledge Transfer Experiments for Lesion Detection in Retinopathy
First Experiment: Automatic Label Generation. Version 1 of the SAM model was used, fine-tuned with a pretrained model on DR images. This model generated automatic lesion masks for both databases (DR and LR).
Second Experiment: Initial Training with DR Images. Using DR images and their automatically generated labels from SAM, fine-tuning was applied to a YOLO network, previously trained on the COCO dataset, to learn relevant features of retinopathy lesions. Several versions of YOLO were tested, and the one with the best results was selected. This model serves as a foundation for knowledge transfer, capturing patterns that could potentially be shared between the two pathologies.
Third Experiment: Model Transfer to the YOLO Architecture for LR. After training the YOLO model with DR images, a second knowledge transfer was conducted, applying the previously optimized model to a new YOLO architecture specifically designed for lesion detection in LR images.
Training with LR Images. Finally, the modified YOLO architecture was trained with LR images and their SAM-generated labels. This step allowed the model to be adjusted to the specific characteristics of LR lesions, benefiting from previously transferred knowledge from DR.
5.2 Results in TL in YOLO with DR Images
Table 2 below presents the results obtained in the first stage of the research, in which different versions of the YOLO model in its ’m’ size and Object Detection mode were trained using DR images, with the aim of determining which version best fits the datasets.
Table 2 Comparing lesion segmentation results in LR images with SAM and SAM-DR labeling
| Version | Class | Precision | Recall | F1-score | mAP50 | mAP50-95 |
| YOLO v5 | all | 0.408 | 0.218 | 0.281 | 0.204 | 0.090 |
| YOLO 8 | all | 0.239 | 0.254 | 0.246 | 0.222 | 0.125 |
| YOLO v8-obb | all | 0.454 | 0.267 | 0.336 | 0.279 | 0.152 |
| YOLO v9 | all | 0.422 | 0.229 | 0.296 | 0.223 | 0.096 |
Among the evaluated versions, YOLO v8-obb shows the best results in terms of precision, recall, and mAP, standing out with a precision of 0.454, suggesting that it is the most suitable option for lesion segmentation in this context. For this reason, YOLO v8-obb was chosen over the other versions.
5.3 Image Labeling of LR with SAM and SAM-DR
Figure 5 below presents the results of the automatic labeling generated by SAM, comparing two approaches: without prior TL and applying TL with DR images
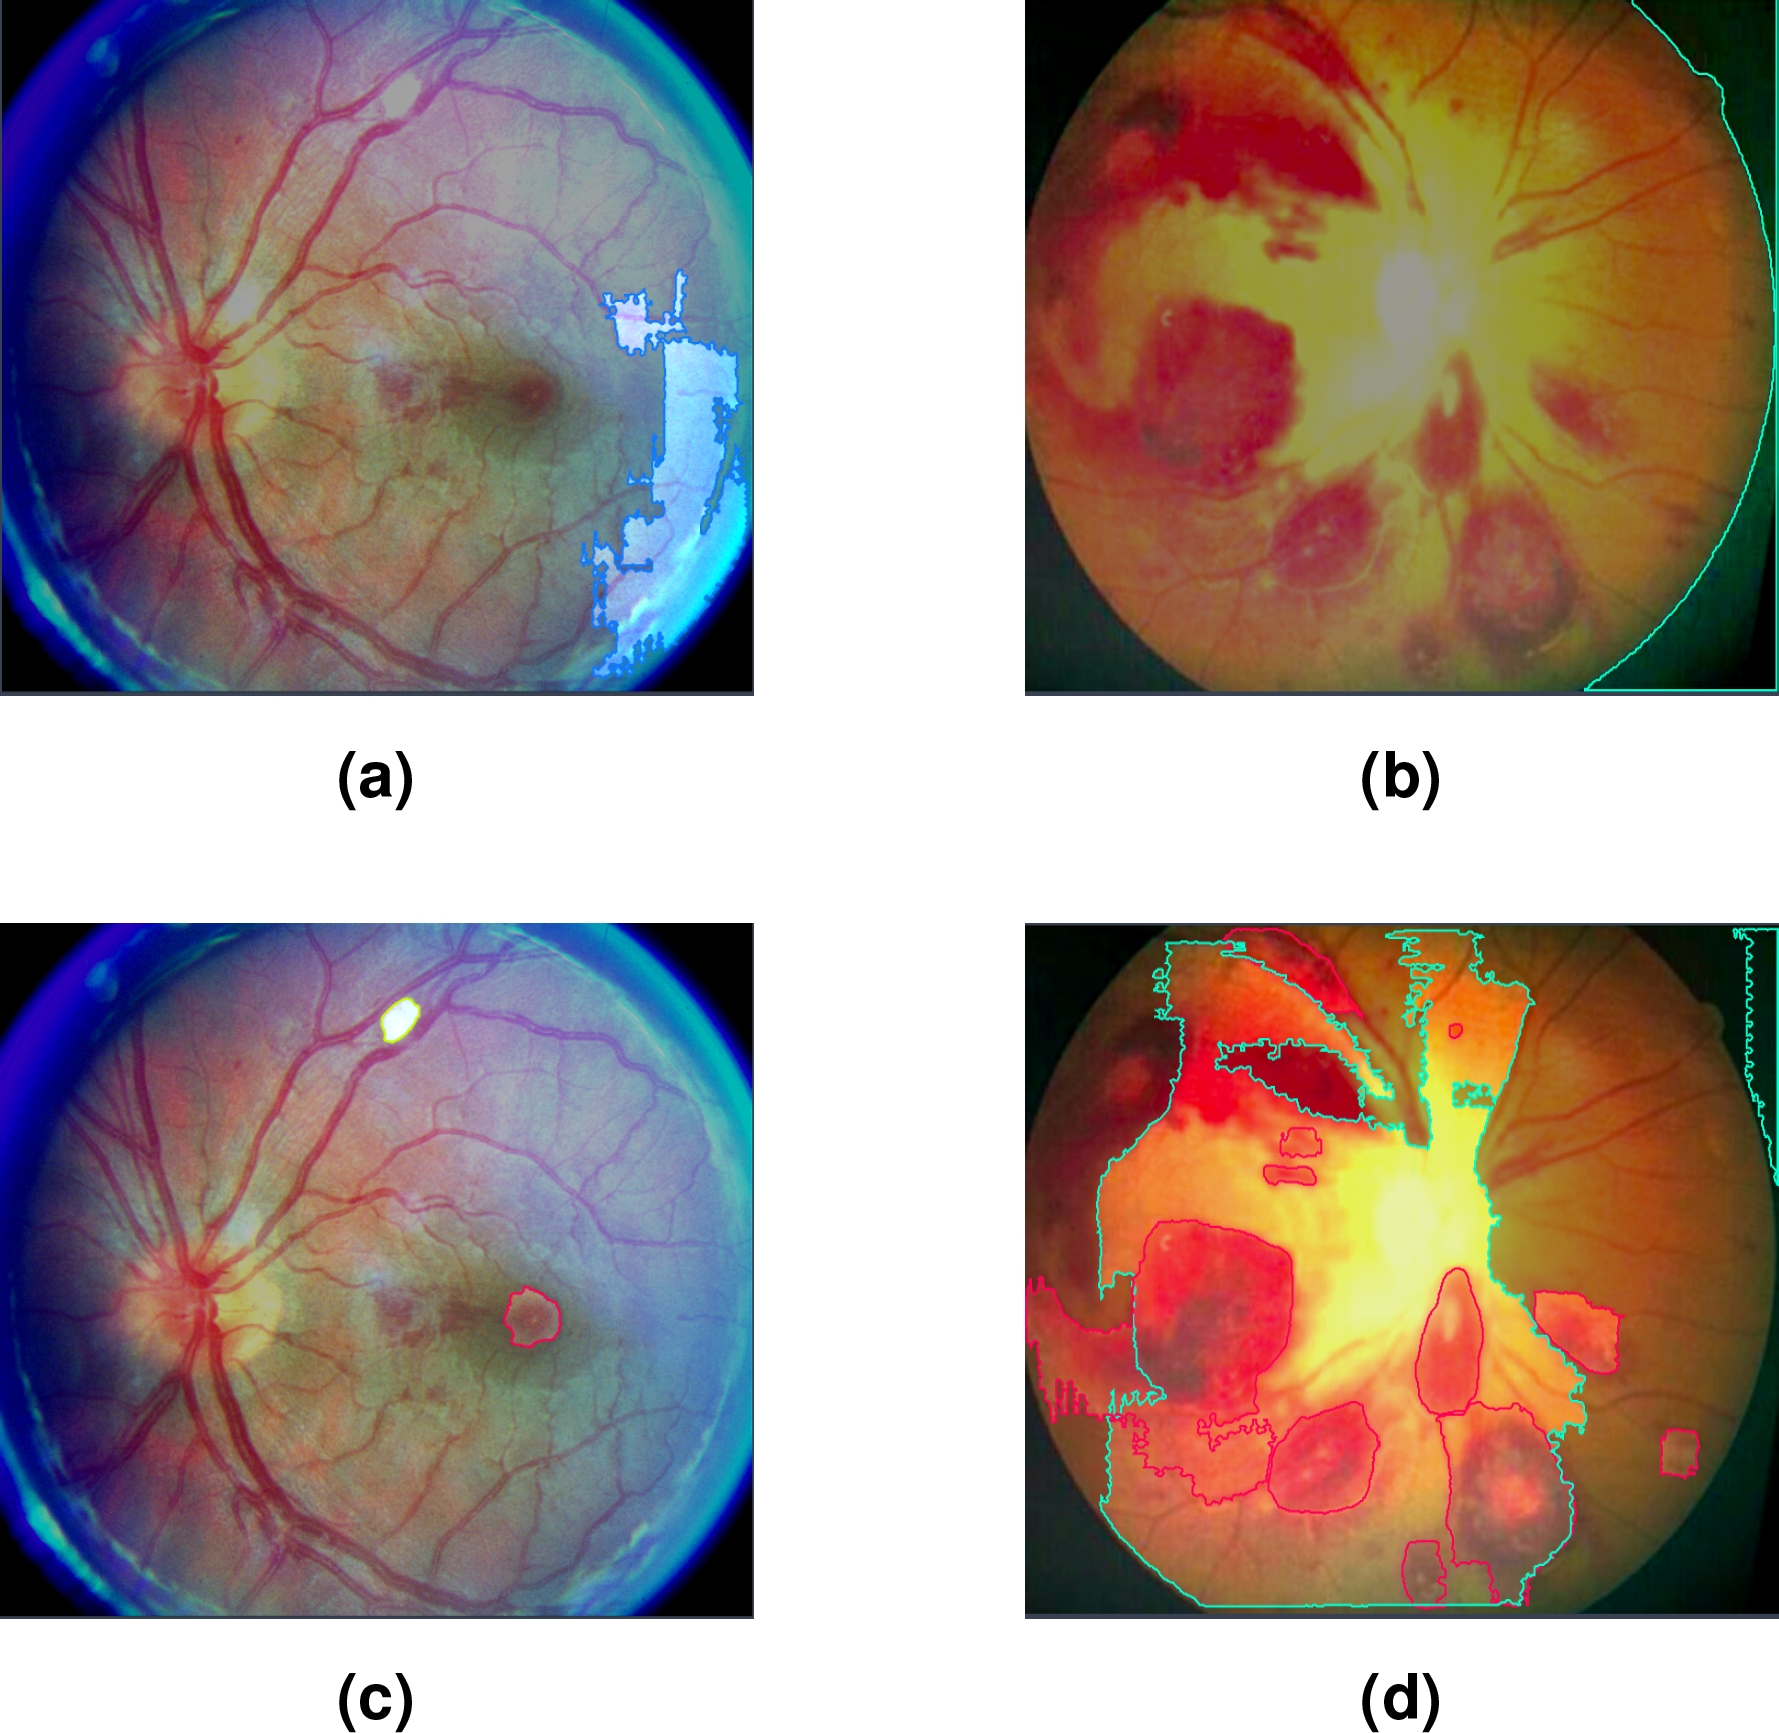
Fig. 5 Figures (a,b) correspond to masks generated automatically with SAM; while (c,d) were generated automatically with SAM-DR
In cases (a) and (b), the labels were automatically generated with SAM without applying prior TL. As seen in Figure (a), SAM selects a retinal area that does not correspond to any specific lesion, indicating incorrect or irrelevant segmentation. Similarly, in Figure (b), SAM selects areas of the black background, evidencing a lack of accuracy in identifying the areas of interest. In both cases, the detected classes are not given specific names, limiting the usefulness of labeling in these scenarios.
On the other hand, in Figures (c) and (d), TL was applied with DR images prior to SAM labeling; SAM-DR successfully identified some of the lesions present, assigning labels corresponding to the classes learned during training, but mislabeled or incomplete areas still remain.
5.4 Lesion Segmentation in LR Images using YOLO v8-obb
Table 3 shows the results obtained during the segmentation of lesions in LR images using the YOLO v8-obb model. This analysis focuses on evaluating the precision and effectiveness of the model in detecting various characteristic lesions of this disease, highlighting the advantages and limitations observed during the process.
Table 3 Comparing lesion segmentation results in RL images with SAM and SAM-DR labeling
| Labeling | Class | Precision | Recall | F1-score | mAP50 | mAP50-95 |
| SAM | all | 0.143 | 1 | 0.250 | 0.497 | 0.049 |
| - | 0.143 | 1 | 0.250 | 0.497 | 0.049 | |
| SAM-DR | all | 0.688 | 0.447 | 0.541 | 0.577 | 0.323 |
| EX | 0.442 | 0.333 | 0.379 | 0.349 | 0.206 | |
| HE | 0.934 | 0.560 | 0.700 | 0.804 | 0.441 |
Above are the results obtained by comparing the quality of lesion segmentation of the LR image set, using two approaches: automatic labeling with the SAM model and SAM-DR labeling using a fine-tuning process with DR images.
Figure 6 visually illustrates the differences in the segmentation of lesions associated with LR using two different approaches. Image (a) presents lesions segmented using only the SAM model. While image (b) shows the lesions segmented by the SAM-DR model.
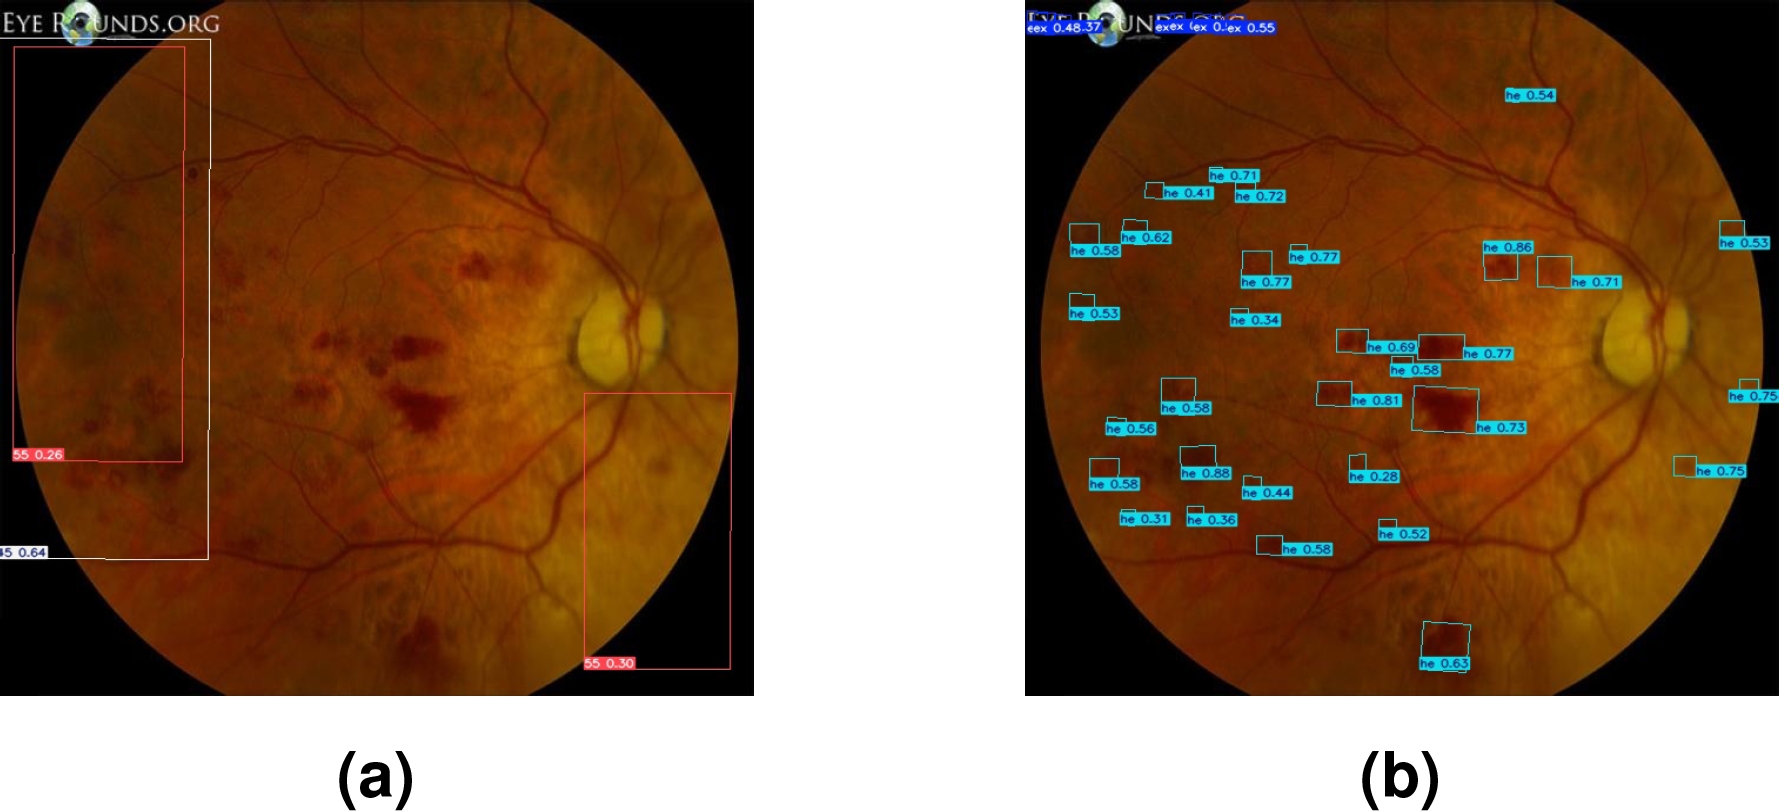
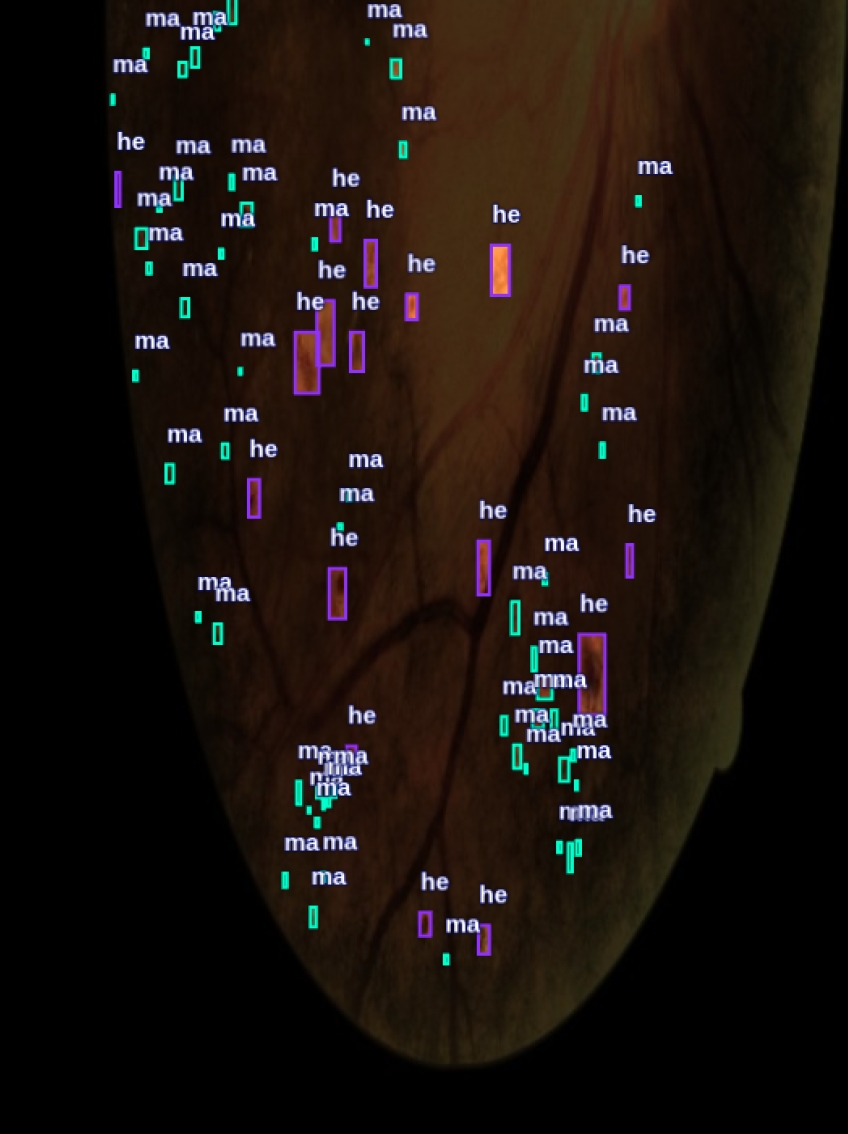
Figure 7 shows a visual comparison of the segmented lesions achieved with YOLO. Images (a) and (b) show the segmented lesions using manually generated labels. In contrast, images (c) and (d) present the segmented lesions using labels automatically generated by the SAM-DR model. In these images, more lesions associated with LR are detected compared to images (a) and (b).
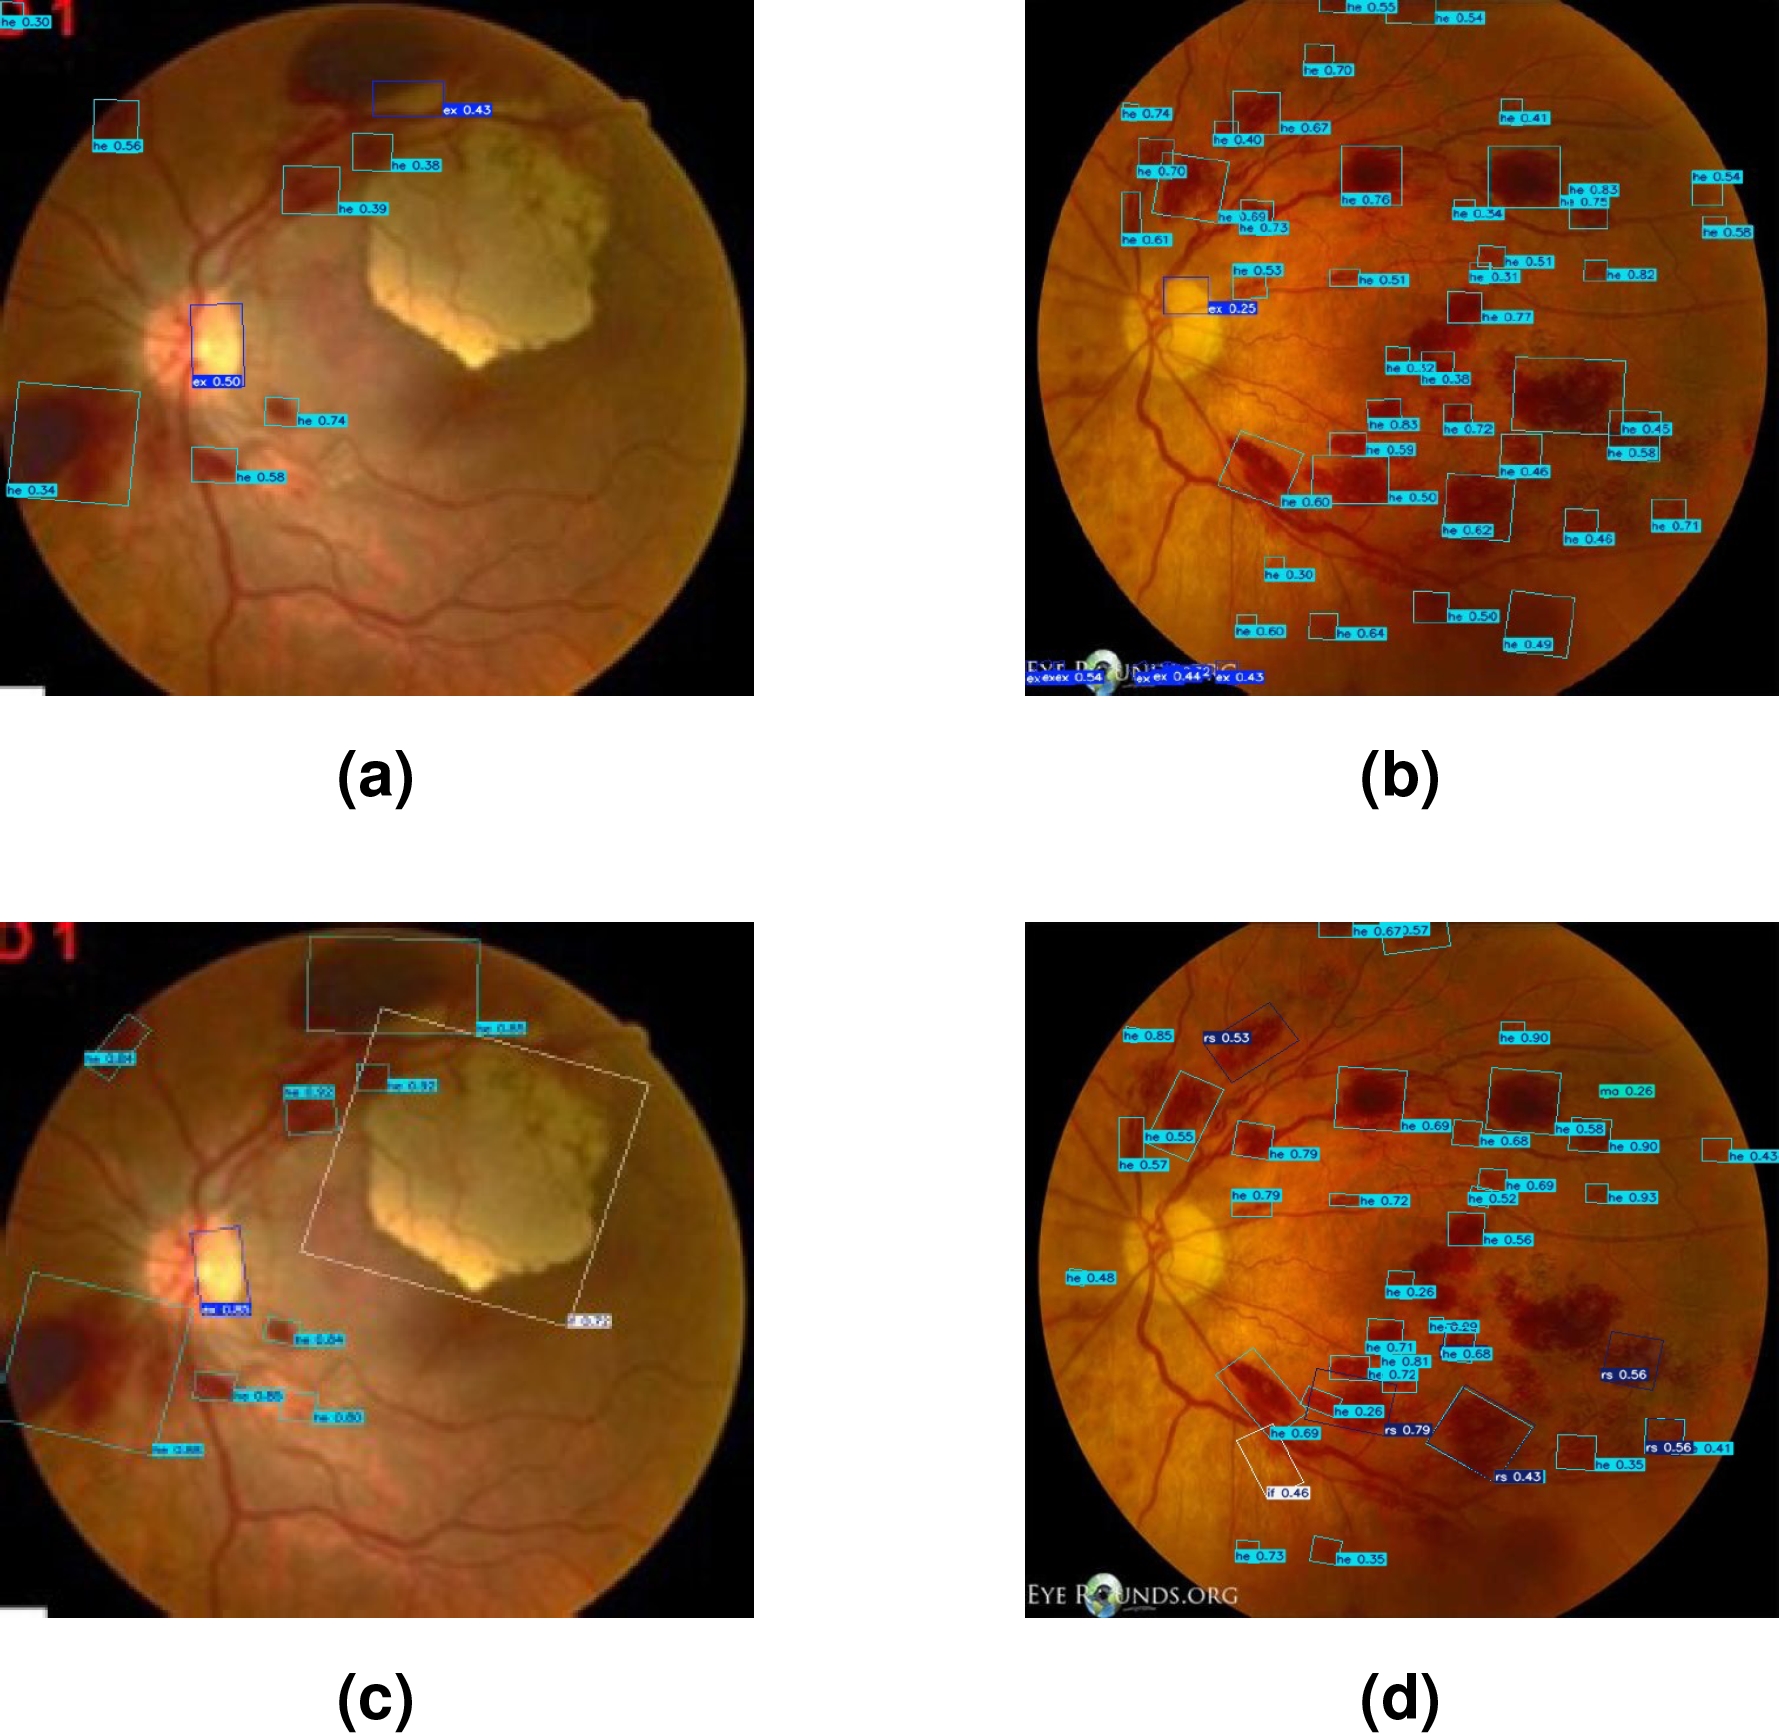
Fig. 7 Segmented lesions with LR images using YOLO: (a,b) manually labeled; (c, d) labeled with SAM-DR
Table 4 shows the results of the segmentation of lesions associated with LR, comparing two approaches: automatically generated labels with SAM-DR and manually generated labels, for the HE and EX classes.
Table 4 Comparing segmentation results with images labeled with SAM-DR and manually, with two classes
| Labeling | Class | Precision | Recall | F1-score | mAP50 | mAP50-95 |
| SAM-DR | all | 0.688 | 0.447 | 0.541 | 0.577 | 0.323 |
| EX | 0.422 | 0.333 | 0.372 | 0.349 | 0.206 | |
| HE | 0.934 | 0.560 | 0.700 | 0.804 | 0.441 | |
| MANUAL | all | 0.333 | 0.487 | 0.395 | 0.550 | 0.300 |
| EX | 0.333 | 0.333 | 0.333 | 0.466 | 0.267 | |
| HE | 0.333 | 0.640 | 0.438 | 0.654 | 0.332 |
It is important to highlight that in this comparison, only two classes were used because the SAM-DR model was trained exclusively with DR images, where the specific lesions of LR were not present.
As a result, during segmentation with YOLO, the SAM-DR model was only able to detect these two classes, leading to the decision to compare the same number of classes in both approaches to ensure a fair and consistent comparison.
5.5 Efficiency of TL vs. DTL in Segmentation of LR lesions
For this comparison, a dataset automatically generated by SAM-DR was used. This dataset was carefully reviewed and manually adjusted to include classes that were initially not present and to correct labeling errors.
Table 5 presents a comparison of lesion seg-mentation results in LR images, both approaches focused on the segmentation of five types of lesions: EX, HE, MA, FI, and RS. In the TL approach, only LR images were used. On the other hand, the DTL approach leveraged a model previously trained with DR images.
Table 5 Comparing Results Between TL and DTL
| Approach | Class | Precision | Recall | F1-score | mAP50 | mAP50-95 |
| TL | all | 0.245 | 0.323 | 0.278 | 0.391 | 0.248 |
| EX | 0.244 | 0.333 | 0.281 | 0.343 | 0.274 | |
| HE | 0.511 | 0.68 | 0.583 | 0.659 | 0.363 | |
| MA | 0 | 0 | 0 | 0.146 | 0.0775 | |
| FI | 0 | 0 | 0 | 0.155 | 0.0579 | |
| RS | 0.472 | 0.600 | 0.528 | 0.654 | 0.466 | |
| DTL | all | 0.535 | 0.424 | 0.473 | 0.388 | 0.231 |
| EX | 0.63 | 0.333 | 0.435 | 0.339 | 0.271 | |
| HE | 0.616 | 0.52 | 0.563 | 0.603 | 0.301 | |
| MA | 0.475 | 0.333 | 0.391 | 0.284 | 0.131 | |
| FI | 0.297 | 0.333 | 0.313 | 0.115 | 0.035 | |
| RS | 0.659 | 0.600 | 0.628 | 0.600 | 0.415 |
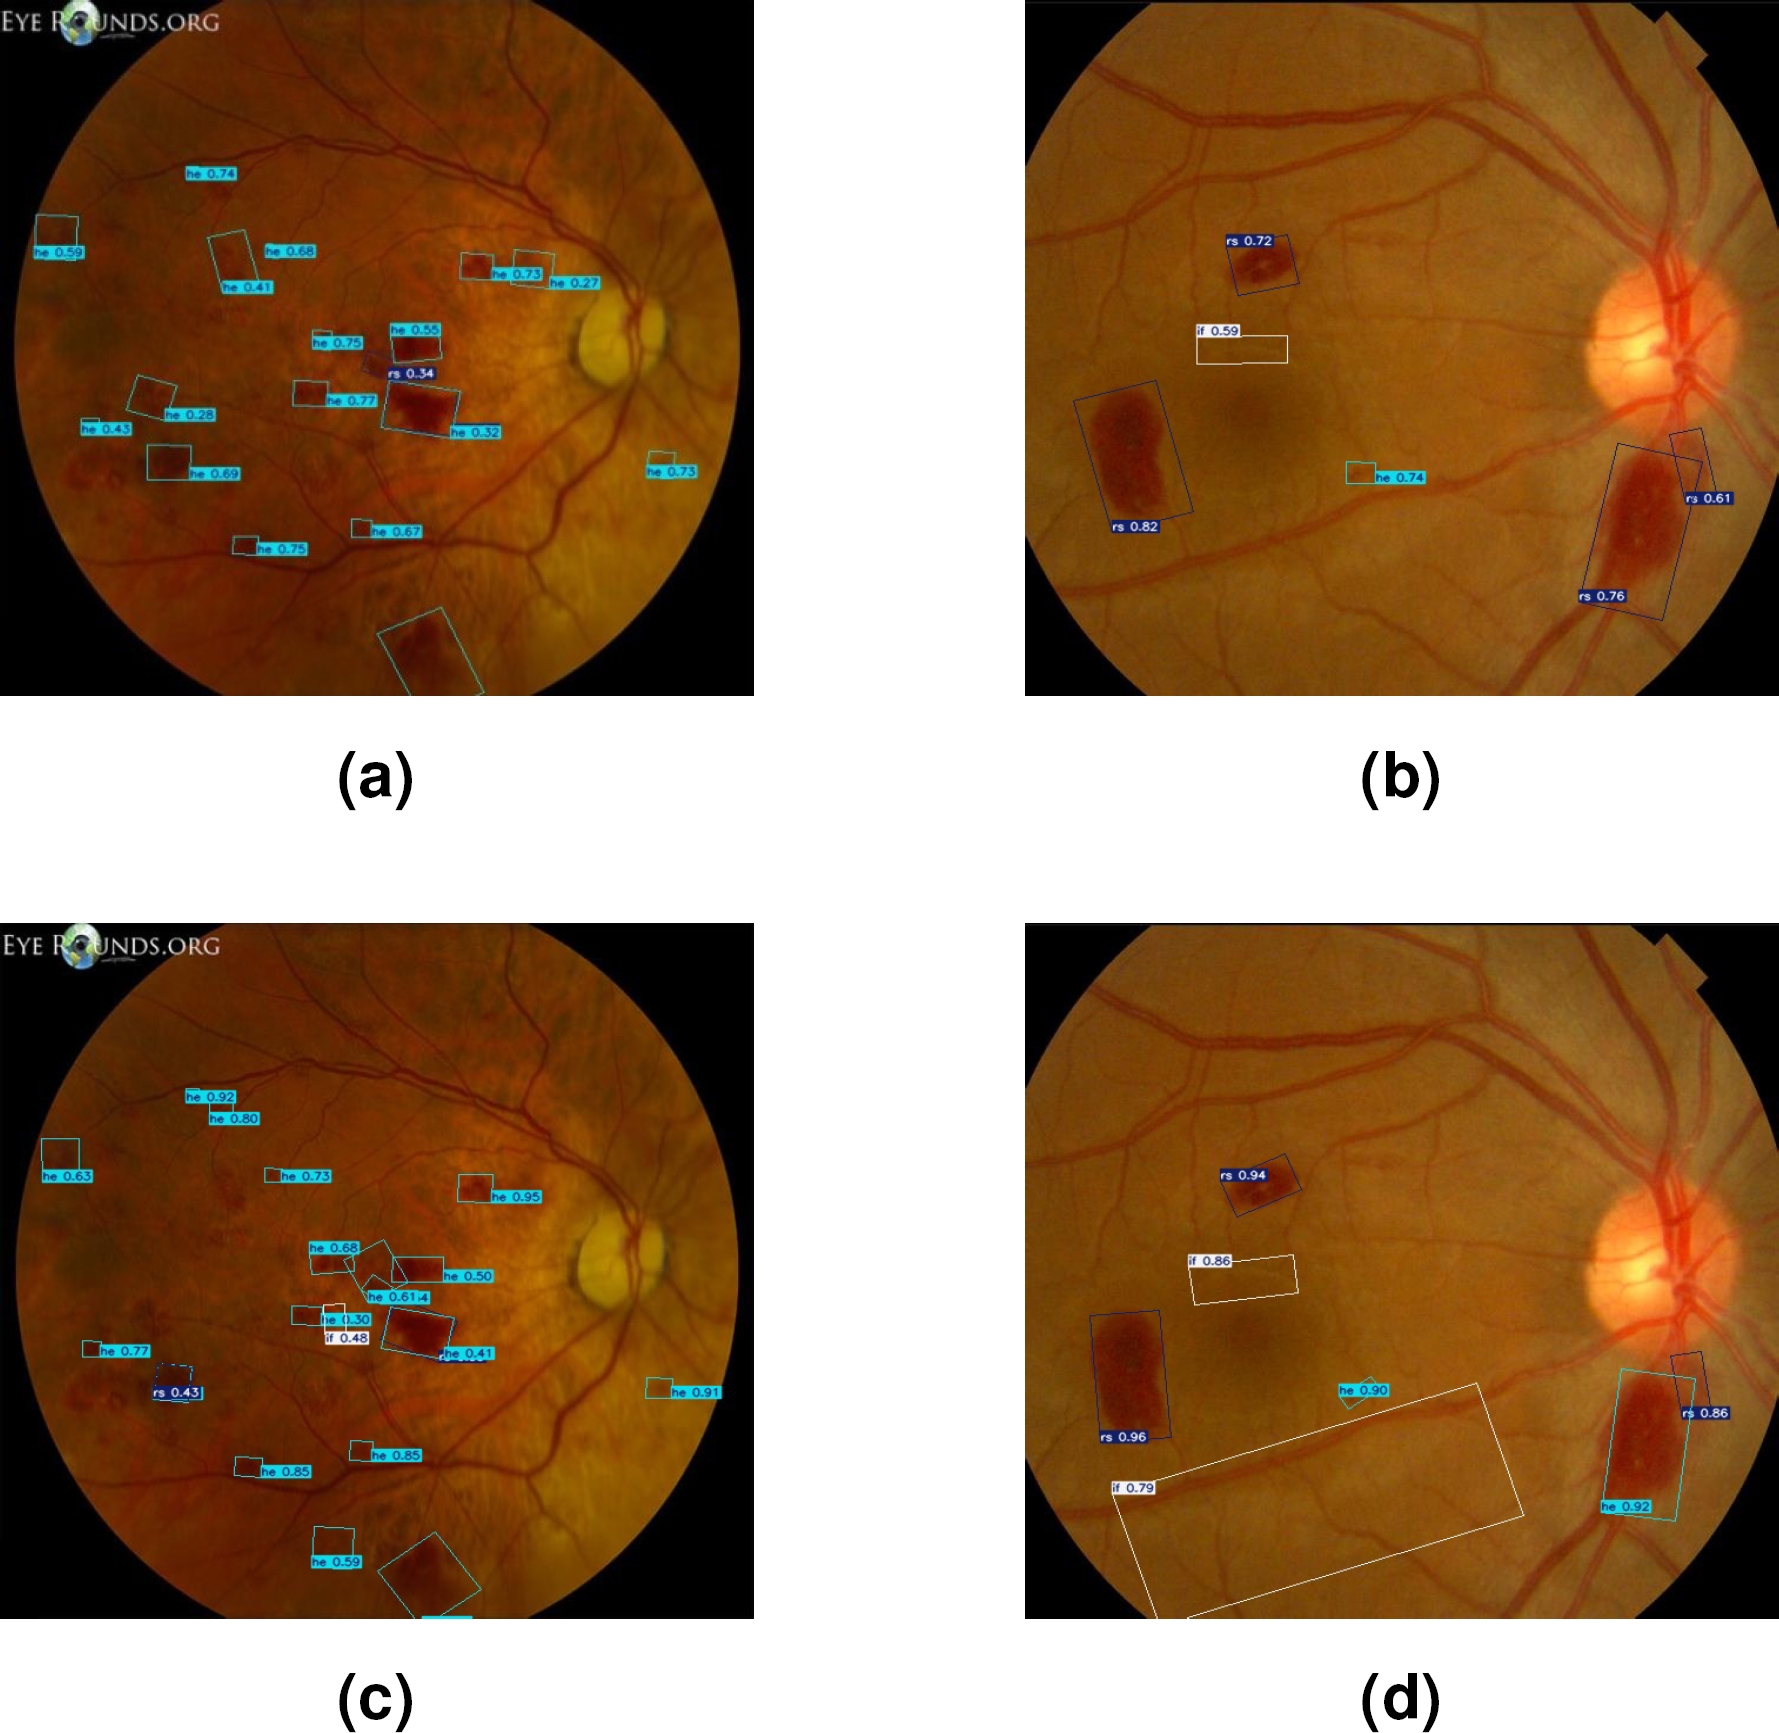
Finally, Figure 8 shows the bounding boxes generated by both techniques in lesion segmentation. Figures (a) and (b), present the results obtained with DTL. Meanwhile, Figures (c) and (d) show the bounding boxes generated through TL.
5.6 Discussion
When analyzing the results presented in Table 2, it is observed that the YOLO v8-obb model outperforms other versions in terms of precision, recall, mAP50, and mAP50-95. Specifically, YOLO v8-obb achieved a precision of 0.454 and a recall of 0.267, representing a superior balance between true positive detection and minimizing false positives compared to other versions. Additionally, the mAP50 reached 0.279 and the mAP50-95 was 0.152, indicating a better ability to correctly detect classes across a wider range of IoU thresholds.
In Table 3, it is observed that the labeling performed exclusively with SAM shows limited performance, with overall precision and recall of 0.143. These values reflect an insufficient ability to correctly identify lesions in LR images. In contrast, when using the SAM-DR model, the results significantly improve, especially in the EX and HE classes. The HE class shows a notable improvement, achieving a precision of 0.934 and a recall of 0.560. Additionally, while the first experiment with SAM failed to properly assign labels to the lesions.
During the second experiment, the proper assignment of HE and EX labels was achieved. On the other hand, in Figure 6, image (a) shows the segmentation performed solely with SAM, with detections that fail to cover all the lesion areas, even outside the retina, reflecting the lack of precision already evidenced in Table 2. In contrast, image (b), the segmentation is much more precise and complete, with better lesion area coverage.
The results presented in Table 4 show that automatic labeling with SAM-DR offers superior performance in terms of precision, recall, and mAP compared to manual labeling. In the HE class, SAM-DR achieves a precision of 0.934 and a recall of 0.560, with an mAP50 of 0.804, representing a significant improvement over the results obtained with manual labeling.
Although in the EX class, manual labeling shows better recall (0.487 compared to 0.333), the precision and mAP are lower compared to the results obtained with SAM-DR. This suggests that the TL process applied to SAM offers a considerable advantage in lesion identification, especially in the HE class, compared to manual labeling.
In Figure 7, images (a) and (b) representing detections with manually generated labels, show less accurate and complete segmentation, reflecting on the lower effectiveness of manual labeling evidenced by lower precision and mAP values. On the other hand, images (c) and (d), show that detections made with labels automatically generated by SAM-DR are more accurate and cover a larger area of the lesions, which is consistent with the superior quantitative results observed in Table 3.
Moreover, the experiment comparing TL and DTL utilized an enhanced dataset that was manually adjusted to correct errors and add missing classes. Table 5 shows moderate performance in the TL approach, with an overall mAP50 of 0.391 and an mAP50-95 of 0.248. In this approach, the HE and RS classes achieved the best results, with mAP50 of 0.659 and 0.654, respectively. However, the MA and FI classes were not adequately identified, showing very low or even non-existent precision and recall values, indicating a limited capacity of the model to detect these lesions when trained solely on LR images.
The DTL approach demonstrated significant improvement in most metrics, achieving an overall mAP50 of 0.388 and an mAP50-95 of 0.231. The RS class showed superior performance with a precision of 0.659 and a recall of 0.600, highlighting the model’s effectiveness in detecting this specific class. Additionally, a notable improvement was observed in the HE class, where the mAP50 reached 0.603.
This work faced several important limitations. The lack of specific databases for LR complicated the training process, as well as the generation of synthetic images using Generative Adversarial Networks (GAN) or traditional methods. In addition, no clinical validation of the results obtained was performed, which limits their applicability in real medical settings.
Since no statistical tests were conducted, it is important to clarify that the results presented are based on direct comparisons rather than formal statistical validation. These limitations emphasize the need for further research and access to more comprehensive datasets to improve both training accuracy and clinical relevance. Furthermore, performing a statistical analysis of the results could provide a more rigorous assessment of their effectiveness and robustness in clinical applications.
6 Conclusion and Future Work
The analysis demonstrates that the fine-tuning applied to the SAM model significantly improves segmentation quality compared to its original version, specifically in the context of LR. Additionally, it confirms that labeling with SAM-DR, powered by TL, offers a more precise and effective lesion segmentation compared to manual labeling, suggesting that this automated approach is not only more efficient but also more consistent in lesion detection. Lastly, the comparison between TL and DTL reveals that using a pre-trained model with DR images considerably enhances segmentation precision and capability, especially in classes that are difficult to detect.
This approach not only helps to mitigate the issue of data scarcity but also serves as valuable support in scenarios where expert assistance for labeling is unavailable, though it should be considered as a complement rather than a complete replacement for expert labeling.
For future research, it is proposed to establish collaborations with specialized medical personnel, which will ensure that the segmentations and detections performed by the models align with clinical practice. Additionally, another important aspect is the need to expand the dataset with more images representing LR during its various stages, which would contribute to a more robust and generalizable model and finally, a statistical analysis to be performed in order to further validate the results obtained.

