


 nueva página del texto (beta)
 Inglés (pdf)
 Artículo en XML
 Referencias del artículo
 Enviar artículo por email
 Citado por SciELO
  Similares en
SciELO
Similares en
SciELO 
 Permalink
1 Introduction
There is a burgeoning interest in the detection and identification of mental disorders within social media platforms. This arises from a societal demand due to the escalating prevalence of such disorders, encompassing various mental risks such as eating disorders, dysthymia, anxiety, depression, suicidal ideation, and more.
Initiatives such as the Cross-Lingual Evaluation Forum (CLEF) have organized events like the Early-Risk Identification task (eRisk) [9] in recent times. Nevertheless, these efforts have primarily centered on English, overlooking languages such as Spanish. MentalRiskES represents a groundbreaking effort focused on the early detection of mental disorders within Spanish comments sourced from Telegram users.
This initiative unfolded in both 2023 [6] and 2024. During its inaugural edition in 2023, the spotlight was on eating disorders, depression, and an undisclosed disorder aimed at assessing the adaptability of methodologies to emerging, unfamiliar conditions.
Subtask “a” is aimed at detecting if the user suffers from depression. Labels will be 0 for “control” (negative, indicating the user does not suffer from depression) or 1 for “suffer” (positive).
Subtask “b” is aimed at providing a probability for the user to suffer from depression. A value of 0 means 100% negative, and a value of 1 would indicate 100% positive.
Subtask “c” is oriented towards multiclass classification, aiming to decide among four different classes (“suffer+against”, “suffer+in favour”, “suffer+other”, “control”). The system must return one of these labels for each case.
Specifically, this paper centers on task 2a, “depression detection,” approached as a binary classification task. This work’s main contribution is an approach in which depression indicators are sought to feed a model that will classify users with symptoms of depression and without symptoms.
pTo carry out this idea, the creation of a set of texts is explored using chatGPT 3.5 [7] and the PHQ-9 questionnaires with the purpose of specializing a model to detect an indicator of depression. This article is structured as follows: Section 2 presents the related work, Section 3 describes the implemented algorithm for the solution, Section 4 explains how the experiment and evaluation were conducted, and finally, conclusions and references are provided.
2 Related Work
At the MentalRiskES 2023 competition [6], the work of the TextualTherapists team [3] addressed task 2a using an indicator-oriented approach, specifically focusing on those from the PHQ-9 questionnaire (Patient Health Questionnaire-9).
This approach revolves around identifying signals using various features and information suggesting the presence of any indicators, employing a Random Forest Classifier, and securing a fourth place in the competition.
Additionally, [14] in their work utilized an approach using PHQ-9 indicators in the D2S dataset and PRIMATE dataset, both containing texts in English. The top three positions used pre-trained models to tackle the task.
The model that took first place [8] was based on both monolingual and multilingual BERT models, while the models in second and third place [11] used an approach that expanded the vocabulary of BETO and employed a decision policy based on the history of predictions.
Another work employing indicators for depression detection is by [12], which relies on the BDI (Beck Depression Inventory) questionnaire to extract features from English Reddit posts.
Their aim was to enhance their model’s ability to consider both semantic contextual information and descriptive information from the PHQ-9.
The use of indicators for depression detection has already been combined with chatGPT; the work of [1] extracts relevant information based on BDI questionnaire indicators and employs chatGPT to respond to them. Also, there is a work like that of [5] which support the use of ChatGPT for generating sentimentally realistic narratives of simulated agents.
Also, the use of pre-trained models based on BERT in works such as those of [13] and [10], show that the use of these models in conjunction with different neural network architectures obtain good results.
3 Algorithm
For this work, a corpus creation stage for indicators is proposed, followed by model training, and finally classification for depression detection.
3.1 Corpus
For the creation of each corpus aimed at specializing a model in detecting an indicator, certain prompts have been considered. These prompts are designed to elicit responses from ChatGPT 3.5 [7] that can exemplify each of the indicators. Before explaining what each prompt consists of, it’s important to highlight that ChatGPT 3.5 only generates 50 sentences per query without any issues.
Therefore, prompts are requested in sets of 50 sentences using inputs like “Give me another 50 sentences” or “Give me 50 more sentences but shorter” in order to adjust the output based on the observed content. Each prompt for creating sentences representing an indicator started with the phrase “Generate 50 sentences of people with”. On the other hand, to create neutral sentences unrelated to the indicator, the phrase “generate 50 neutral sentences that don’t mention anything about” was used.
As observed in Table 1, each indicator has a set of keywords that can be used to identify each indicator. Finally, to create the corpus for each indicator, the sentences have been divided into 3 options: option a) which proposes sentences that fulfill the indicator, option b) which proposes sentences contrary to the indicator, and option c) which is linked to neutral sentences unrelated to the indicator. Each indicator has 900 texts, 300 texts per class. For example, for indicator 1, the 3 options to consider would be the following:
– a) Poco interés o placer en hacer cosas (Little interest or pleasure in doing things).
– b) Mucho interés o placer en hacer cosas (Great interest or pleasure in doing things).
– c) Tener poco interes o mucho interes en hacer cosas (Having little interest or a lot of interest in doing things).
Table 1 Indicators PHQ-9
| Indicator | |
| 1 | Little interest or pleasure in doing things |
| 2 | Feeling down, depressed, or hopeless |
| 3 | Trouble falling or staying asleep, or sleeping too much |
| 4 | Feeling tired or having little energy |
| 5 | Poor appetite or overeating |
| 6 | Feeling bad about yourself or that you are a failure orhave let yourself or your family down |
| 7 | Trouble concentrating on things, such as reading thenewspaper or watching television |
| 8 | Moving or speaking so slowly that other people couldhave noticed. Or the opposite being so figety orrestless that you have been moving around a lot morethan usual |
| 9 | Thoughts that you would be better off dead, or ofhurting yourself |
Finally, 8 corpora were generated (1 per indicator, except for indicator 9), each corpus containing 900 texts. A corpus for indicator number 9 could not be generated because ChatGPT 3.5 has policies against generating texts related to suicide and self-harm.
3.2 Training
To perform the training, each created corpus is used to create a model specialized in detecting a specific indicator. As observed in Table 2, each indicator is divided into 3 classes:
– Positive: For a message representing the indicator.
– Negative: For a message showing the opposite of the indicator.
– Neutral: For a message that is neutral regarding the indicator.
Table 2 Example of classes for indicator
| Text | Indic. | POS | NEG | NEU |
| after the math test I feel like a failure | 1 | ✓ | ||
| 2 | ✓ | |||
| 3 | ✓ | |||
| 4 | ✓ | |||
| 5 | ✓ | |||
| 6 | ✓ | |||
| 7 | ✓ | |||
| 8 | ✓ | |||
| i’m quite sleepy, today was an exhausting day | 1 | ✓ | ||
| 2 | ✓ | |||
| 3 | ✓ | |||
| 4 | ✓ | |||
| 5 | ✓ | |||
| 6 | ✓ | |||
| 7 | ✓ | |||
| 8 | ✓ |
Each model oriented towards each indicator is based on a pre-trained model.
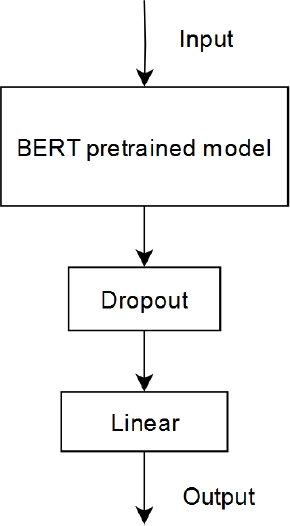
Two models have been selected for comparison: RoBERTa Base [4] and BERT-base-spanish-wwm-cased [2]. Figure 1 shows the architecture used to specialize each pre-trained BERT model in detecting each indicator. A dropout layer and a linear layer are added to each model.
The Table 2 shows how each text is classified across different indicators. If the text corresponds to the indicator, the classification is positive; conversely, if it expresses something opposite to the indicator, it would be negative, and it would be neutral if the text is unrelated to the indicator in any way.
3.3 Clasification
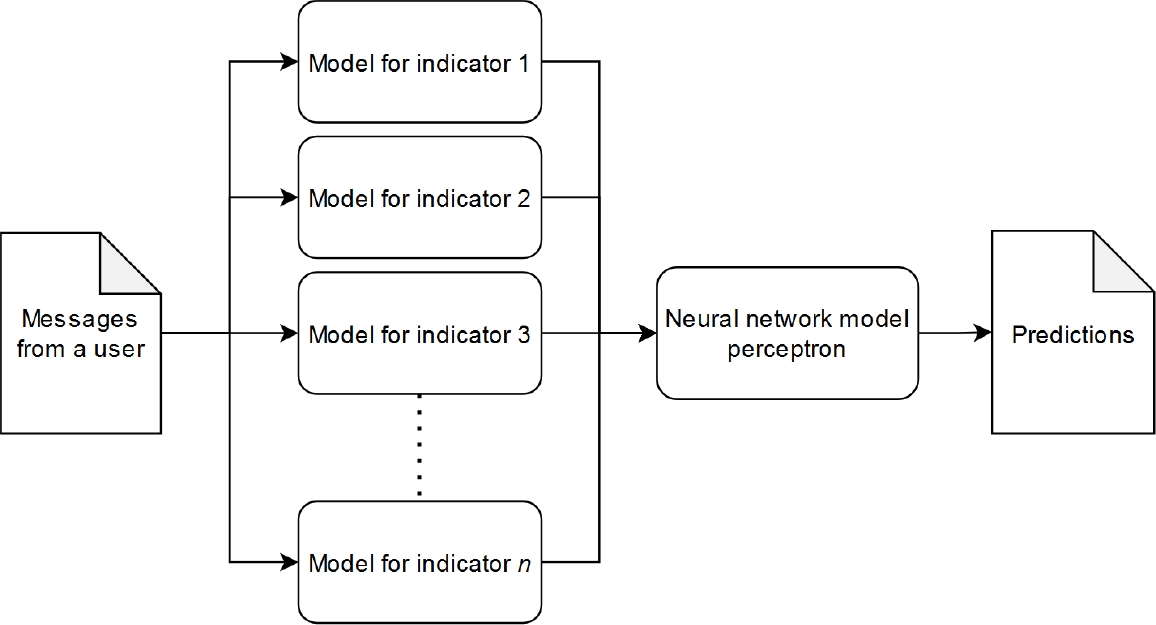
To obtain the final classification, a count is made of how many texts belong to each class for each indicator. The count for positives and negatives of each indicator has been used, resulting in a total of 16 input attributes per user (2 attributes per indicator). The following formula is used to normalize each attribute:
The minimum value is 0 because it’s the minimum count for each indicator, and the maximum value is the maximum count found among the attributes. For the final classification (depression detection in a profile), a multilayer perceptron neural network will be used, and the input to this network consists of the predictions from the models specialized in each indicator. This can be observed in Figure 2.
4 Experiment and Evaluation
In this section, details of the corpus used and the evaluation method will be presented to enable a fair comparison with MentalRiskES 2023 competitors [6].
4.1 Dataset
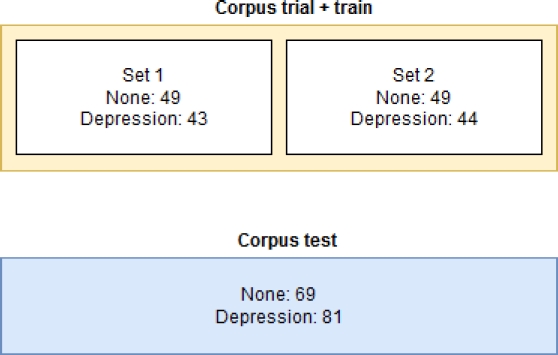
As observed in Table 3, the training corpus has 13 more users in the “None” class, while in the test corpus, there are more users within the “Depression” class, indicating that the classes are not balanced.
4.2 Evaluation
The trial + train corpus has been used for model training. In order to perform cross-validation, the training corpus has been divided into two folds. Figure 3 illustrates the number of instances for the test set and each created fold. Additionally, the test corpus has been preserved and only used for model evaluation, mirroring the approach in the competition.
5 Results
In this section, the results obtained with the folds and the test set will be shown. First, each model has been evaluated individually by splitting each corpus into 20% for evaluation and 80% for training. Tables 4 and 5 display the accuracy achieved by the models during evaluation. It can be observed that for indicator 8, the models exhibit lower performance, likely due to the ambiguity of the indicator.
Table 4 Accuracy RoBERTa base
| Indicators | Training | Testing |
| 1 | 0.9558 | 0.9388 |
| 2 | 0.9888 | 0.9666 |
| 3 | 0.9971 | 0.9200 |
| 4 | 0.9756 | 0.9207 |
| 5 | 0.9958 | 0.9666 |
| 6 | 0.9986 | 0.9853 |
| 7 | 0.9654 | 0.9502 |
| 8 | 0.7861 | 0.7861 |
Table 5 Accuracy BERT-base-spanish-wwm-cased
| Indicators | Training | Testing |
| 1 | 1.0 | 0.9777 |
| 2 | 1.0 | 1.0 |
| 3 | 1.0 | 0.9542 |
| 4 | 1.0 | 0.9878 |
| 5 | 1.0 | 0.9888 |
| 6 | 1.0 | 0.9944 |
| 7 | 1.0 | 0.9834 |
| 8 | 0.8930 | 0.7111 |
The accuracy values of both models are above 0.9, however, this could be due to the fact that each generated corpus points to a specific idea, which makes it easier for the model to learn the given examples. The results obtained for the final classification were achieved with the following configuration in the multilayer perceptron neural network: learning_rate_init: 0.004, activation: “logistic”, hidden_layer_sizes: (20,32), max_iter: 200.
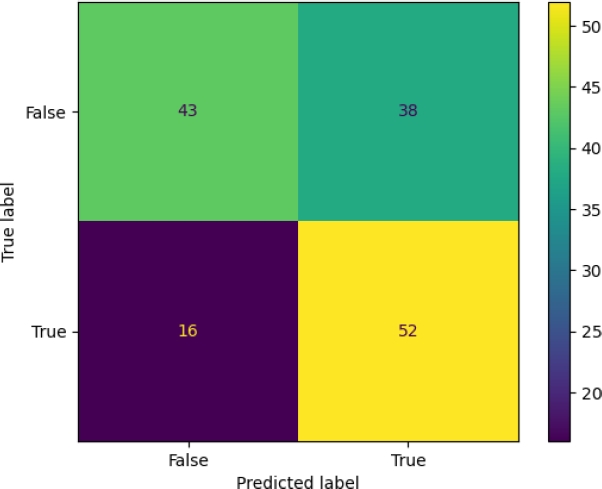
To obtain the fit of the perceptron neural network, the macro-F1 obtained in sets 1 and 2 has been balanced, performing a grid search with different parameters for the neural network. Tables 6 and 7 display the classification models based on different pre-trained models, evaluated using different folds and the test corpus. In Table 6 set 1 and 2 have a macro-F1 of 0.65, however, the test set has a lower macro-F1. On the other hand, Table 7 shows that the BERT-Spanish model maintains a macro-F1 of 0.77 in all folds. In Figure 4, the confusion matrix for the Ind-RoBERTa model is displayed. The figure shows that there are 16 false positives and 38 false negatives, indicating that the model achieved a higher score in the recall metric. Figure 5 presents the confusion matrix for the Ind-bert-base-spanish model.
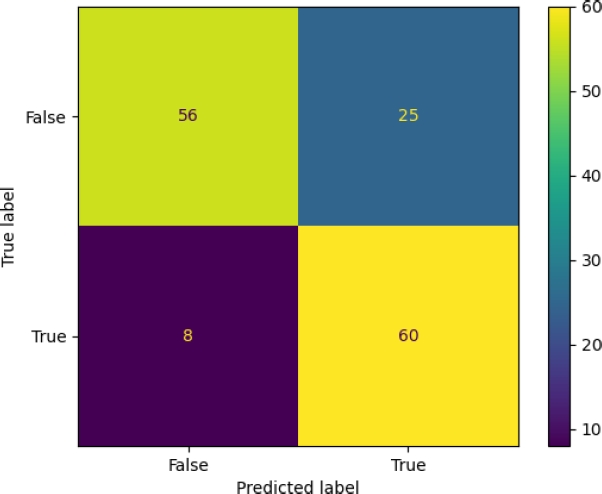
The figure shows 8 false positives and 25 false negatives, reflecting the model’s capacity to detect relevant cases. Finally, Table 8 presents the results obtained for the different models, compared to the competitors seen in MentalRiskES 2023 [6].
Table 8 MentalRiskES 2023
| Rank | Team | Macro-F1 |
| 0 | Ind-bert-base-spanish | 0.778 |
| 1 | UMUTeam | 0.737 |
| 2 | UNSL | 0.733 |
| 3 | UNSL | 0.731 |
| 4 | TextualTherapists | 0.729 |
| 5 | SINAI-SELA | 0.720 |
| 6 | UMUTeam | 0.705 |
| 7 | BaseLine - RoBERTa Large | 0.690 |
| 8 | Ind-RoBERTa base | 0.636 |
| 19 | BaseLine - RoBERTa Base | 0.605 |
The proposal using BERT-base-spanish-wwm-cased [2] outperforms the results obtained by the best result, while the model using RoBERTa-Base [4] surpasses the RoBERTa Base baseline. There is a 0.14 difference in the macro-F1 metric between the results of the two models, both of which were trained using the same indicator corpus.
6 Conclusion and Future Work
Models have been trained to classify each indicator, and the performance of the two proposals appears to depend heavily on how pre-trained models classify the different indicators. The corpus generated for each indicator with ChatGPT 3.5 fulfills its purpose in specializing each model in an indicator; however, labeling a set of texts manually would be necessary to measure the effectiveness of the generated texts in detail.
The model focusing on indicators based on BERT-base-spanish-wwm-cased achieved the best results. The RoBERTa-base model focusing on indicators managed to improve upon the results obtained by the baseline of the same model. As a future work, it is proposed to restructure the information and use a recurrent neural network in order to conserve and take advantage of the information of temporality existing on the dates of the messages.

